Bumping against long-term planets
Week beginning February 18, 2013
For the past four days Miss Pollyanna, the SP500, has been bumping her head against a multi-decade ceiling.

Copyright: Randall Ashbourne - 2011-2013
I indicated last weekend that if a correction does start now, it's probably not The Big One. While reaching the planetary barriers does increase the chances of a significant correction happening, the intermediate oscillators still suggest there will be another run northwards when the correction is done.
The coming week brings on the usually-negative 1Q-FM lunar phase; the Sun will shift signs into Pisces and it will conjunct Neptune; Saturn goes Retrograde; and, next weekend, we get the first Mercury Retrograde phase for the year.
What is "normal" for a Merc Rx phase is that markets tend to start a move which reverses course halfway through the Rx period.
And it's a time we all need to concentrate. It's not unusual to make small mistakes with big impacts during Mercury Rx ... such as hitting the Buy button when you really meant to hit the Sell button.
Sure, the price of the index isn't quite as high as it reached in 2000 and 2007, but that's because the planetary lines which capped those Bull runs have shifted.
This week ... next week probably at the latest ... the vacuous troll has to make up her mind whether she's going to breakout or breakdown.
This week ... next week probably at the latest ... the vacuous troll has to make up her mind whether she's going to breakout or breakdown.


Safe trading - RA
(Disclaimer: This article is not advice or a recommendation to trade stocks; it is merely educational material.)
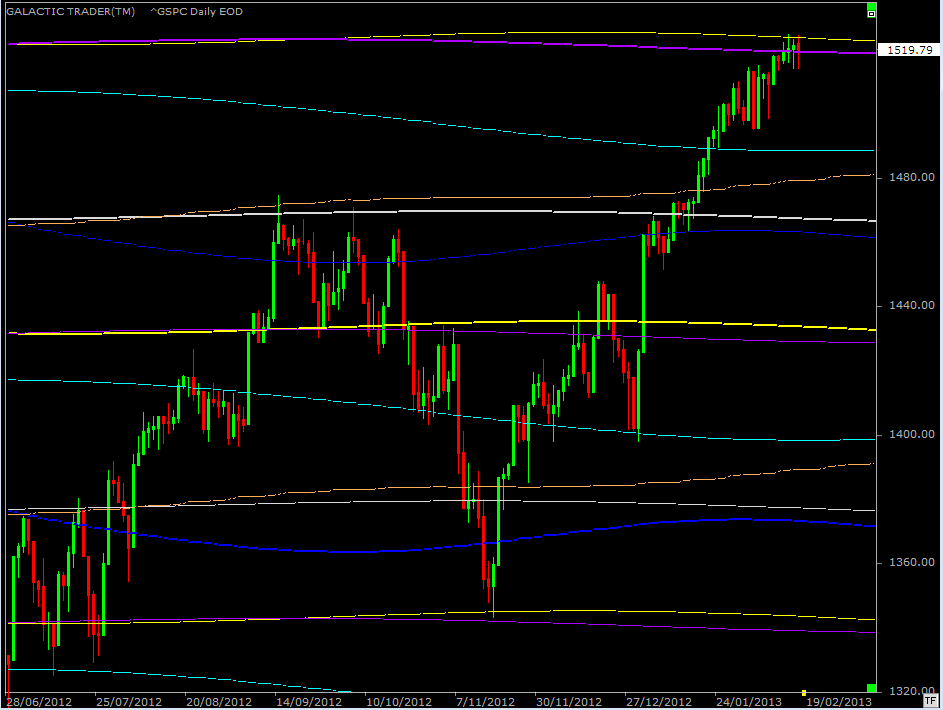
This weekend's edition will be a short one ... and we'll start with the SP500:
And here's Polly's problem. The top purple line in the chart above is a long-range Pluto - the one which acted as a brick wall to the two previous Bull runs. Immediately above it is a yellow Uranus line.
Note where this Santa Claus rally started - similar Uranus/Pluto lines around the 1340 area. The first upleg stalled at another Uranus/Pluto configuration, but caught a Saturn rebound.
So, there is a strong chance this has been a run between Uranus/Pluto zones and Miss Polly is about to go into a swoon. You can see why I think this week, or next, the index has to breakout, or breakdown.
Our next chart is an update of the NDX, Nasdaq 100, chart I showed last weekend, indicating the main tech index could be sent south by contact with a falling Sun line.
Monday's price action set that up, but the pullback stopped at the Uranus line which had been providing Resistance for several weeks.
The NDX ended the week with a close just above Uranus. But the oscillators are heading south and there are downside gaps waiting to be filled. I've inserted white horizontals and price tags on the two main gaps.
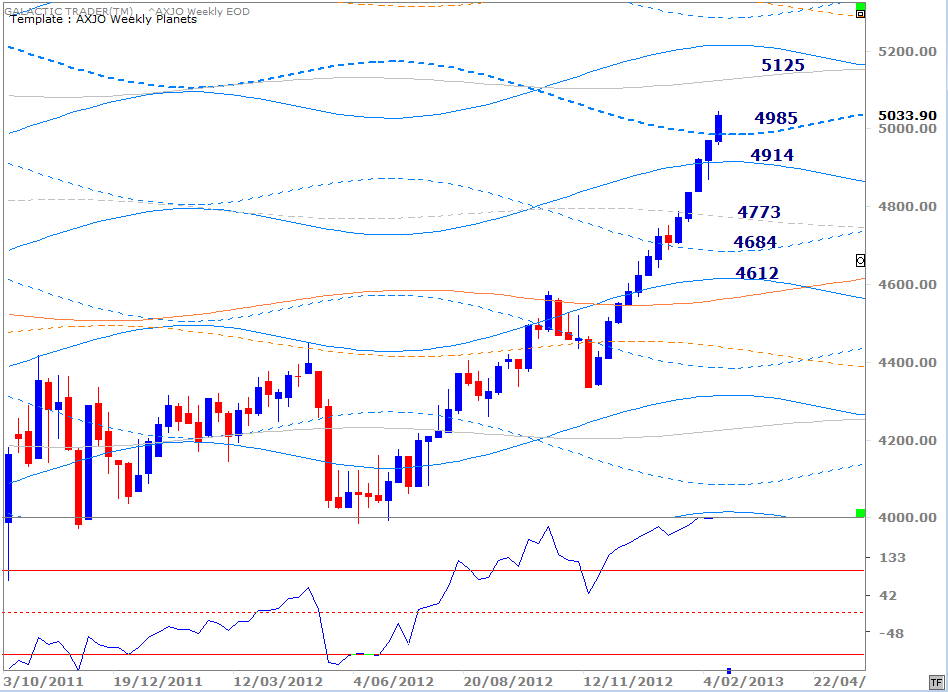
While Wall Street is back close to its old Bull peaks, the ASX 200 made its own milestone last week - closing above the 50% recovery barrier for the first time since the bottom of the Bear plunge in 2009.
And there appears to be more room to run ...
The NDX ended the week with a close just above Uranus. But the oscillators are heading south and there are downside gaps waiting to be filled. I've inserted white horizontals and price tags on the two main gaps.
While Wall Street is back close to its old Bull peaks, the ASX 200 made its own milestone last week - closing above the 50% recovery barrier for the first time since the bottom of the Bear plunge in 2009.
And there appears to be more room to run ...
I'd thought that primary Saturn line at 4985 would provide stronger Resistance; it'll be interesting to see if it converts to Support during the next correction. More next weekend ...
Forecast 2013 is now available for sale and download.
Click the button on the right for more details.
Click the button on the right for more details.

NEW:

Forecast 2013 is now available for sale and download.
Click the button on the right for more details.
Click the button on the right for more details.