2013's first major trend change date
Week beginning January 28, 2013
This week kicks off with a critical reversal date, the first for 2013.

Copyright: Randall Ashbourne - 2011-2013
In a moment, we'll take a look at the track record of both these events, due to occur on Wednesday, NY time.
While many markets have been rising steadily into this timeframe, it would be unusual - statistically - for them to top out going into the Full Moon.
The FM-3Q period, which covers all of the coming week, is normally a relatively strong rally period.
Those of you who have access to Forecast 2013 will know that last year, many of the world's top stock indices put on most of their gains during this 7-day lunar phase.
The SP500 put on 7% during the FM-3Q periods; India's Nifty, Germany's DAX and Hong Kong's Hang Seng rose 19%, 18% and 17% respectively; Singapore rose 12% and the ASX200 put on 10%, which was almost its total gain for 2012.
The Bradley Model roadmap for the year suggests that whatever starts this week won't undergo another major change of direction until the later part of June.
Triggers for the potential change are the Sun making a square aspect with Saturn and Jupiter shifting to Direct from Retrograde.
Triggers for the potential change are the Sun making a square aspect with Saturn and Jupiter shifting to Direct from Retrograde.


Safe trading - RA
(Disclaimer: This article is not advice or a recommendation to trade stocks; it is merely educational material.)
So, expecting a major trend change to develop here does fly in the face of the "normal" statistical tendency for many markets to rise strongly during this lunar phase. Last year, this phase was negative only 3 of the 12 times for the SP500.
Let's take a look at past performance of Jupiter going Direct and the Sun squaring off with Saturn ...
Let's take a look at past performance of Jupiter going Direct and the Sun squaring off with Saturn ...
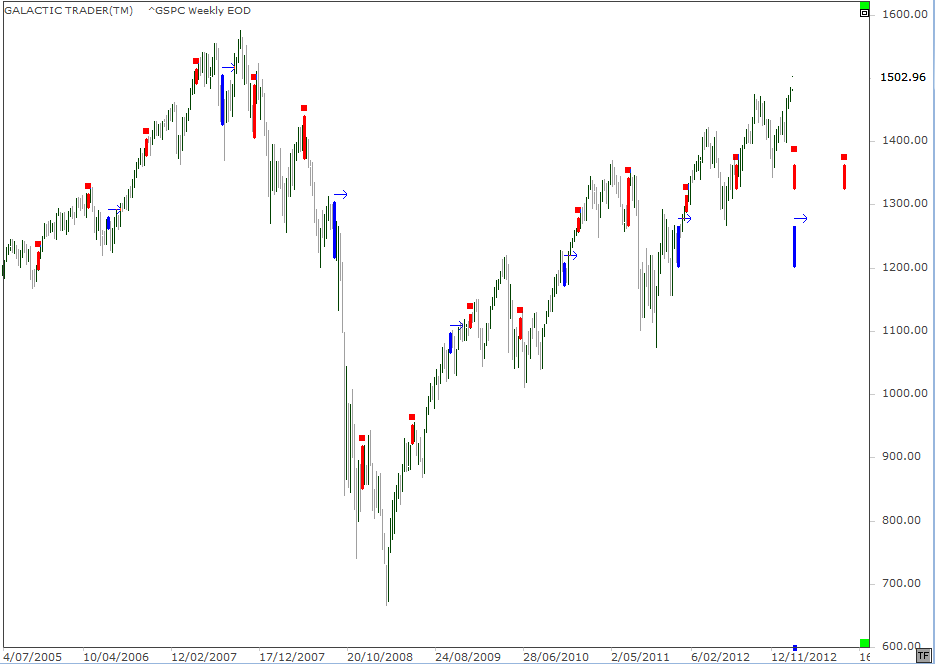
We'll use a weekly chart of Pollyanna, the SP500 - with the arrowed blue bars showing the weeks Jupiter changed to Direct and the red bars the weeks in which the Sun squared Saturn.
Of the past 6 Jupiter signatures, three came in nearby significant lows and the others led to a downturn for at least a few weeks. Of the 14 Sun/Saturn squares, 4 produced intermediate tops.
The combined strength of the two signatures, happening on the same day this week and with some negative reinforcement from Mars making a parallel aspect with Saturn, is enough to cause a trend change.
But, even if it does happen, I have some doubts that it will continue all the way to late June. And that's because my big Canary is still warbling sweetly.
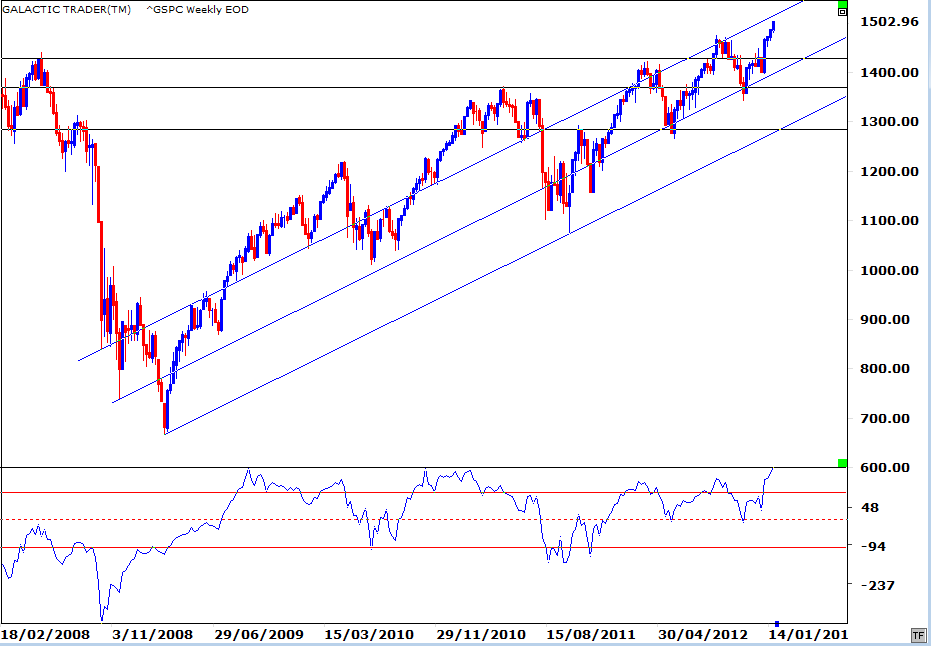
Note that the oscillator has hit a new peak in line with the higher price of the SP500 weekly. In brief, no negative divergence warning.
It means, under normal circumstances, that we have not yet seen the index hit its highs for the year. It is, of course, now within a few dollars of one of the major planetary price levels which should cause a downwards reaction ... and there is resistance overhead from a channel line.
It means, under normal circumstances, that we have not yet seen the index hit its highs for the year. It is, of course, now within a few dollars of one of the major planetary price levels which should cause a downwards reaction ... and there is resistance overhead from a channel line.
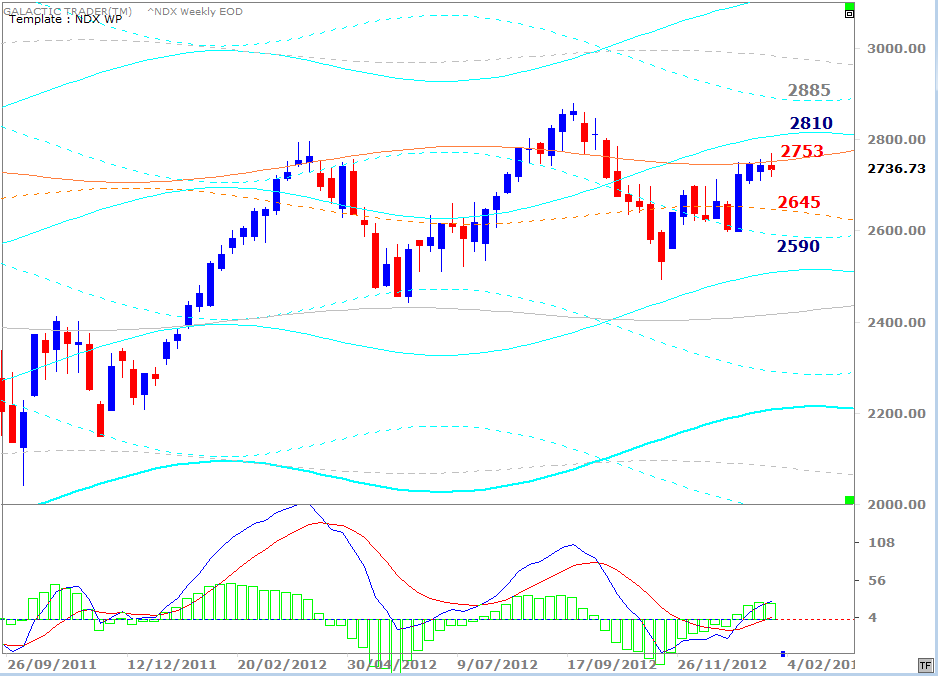
The Nasdaq 100, NDX, still can't close above the Uranus barrier which has blocked its rise for the past month ... still leaving the potential to form the right shoulder of a negative pattern. If you're trading the Nasdaq, it would be worth keeping a close eye on that level, as well as consulting the Moon Trading results on Page 24 of the Forecast.
Across the lakes ...
Across the lakes ...
Forecast 2013 is now available for sale and download.
Click the button on the right for more details.
Click the button on the right for more details.

NEW:

Forecast 2013 is now available for sale and download.
Click the button on the right for more details.
Click the button on the right for more details.
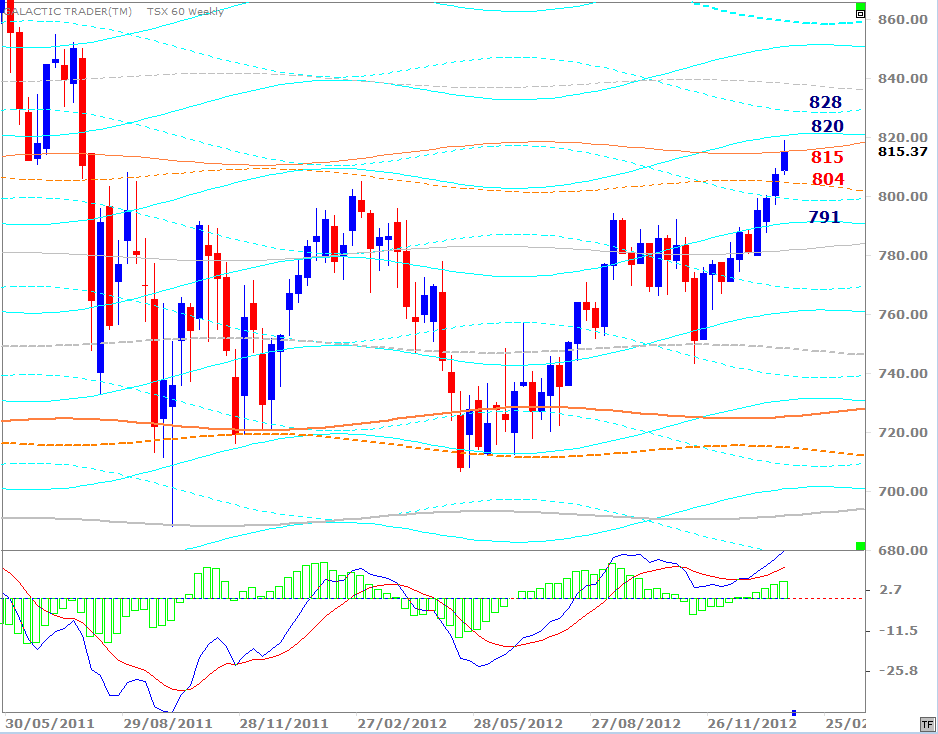
Canada's TSX60 (capped) continues its rise. This appears to be a Uranus-to-Uranus zone bounce and stalling here would not be a surprise. The current height of the histograms is a tad negative, even though the MACD signal lines are strong. As with Pollyanna, though, Toronto probably has higher prices as its target over the course of the year.
London is next ...
London is next ...
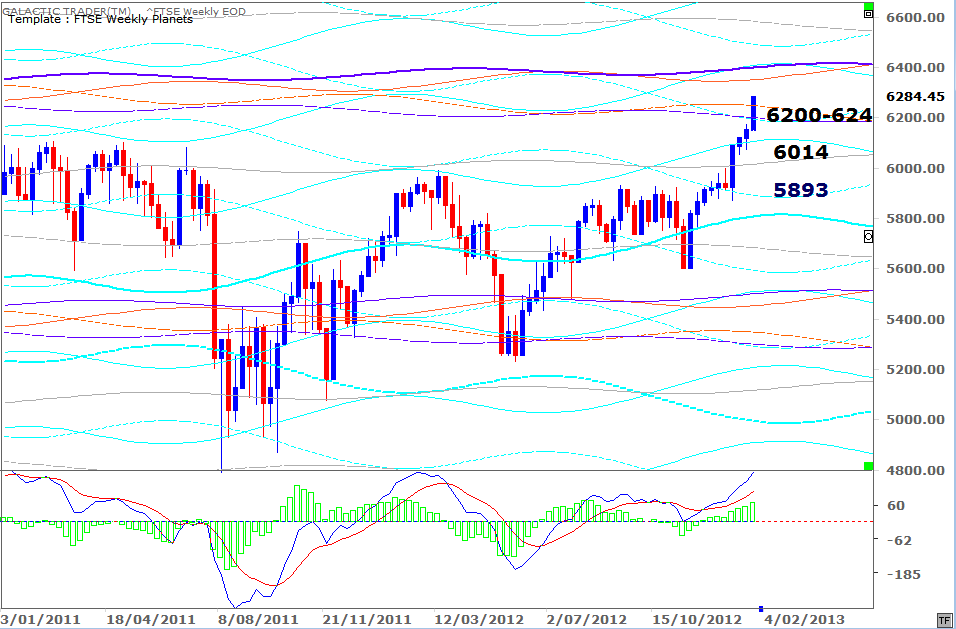
When I last published this chart for the January 14 edition, the FTSE was sitting at 6101 and I said: " ...there's a chance it's on a run between Uranus/Pluto barriers. If so, it's heading to somewhere between the 6200s and 6400s before real trouble starts."
It's now well inside that zone ... and with no warning klaxons going off in the fast MACD.
Mumbai ...
It's now well inside that zone ... and with no warning klaxons going off in the fast MACD.
Mumbai ...
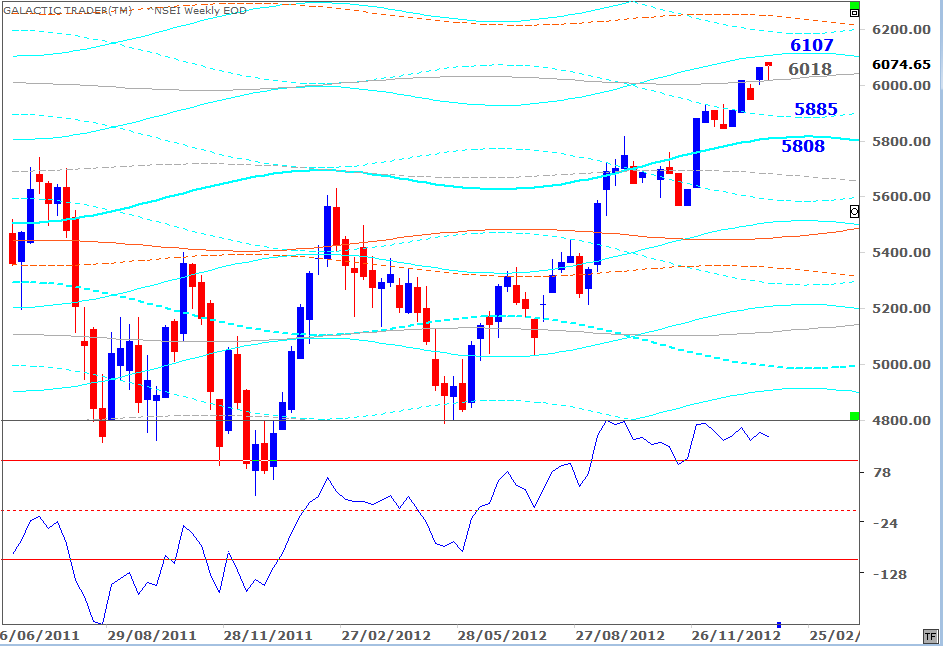
India's Nifty hasn't done much since we last looked at its Weekly Planets chart, still testing the validity of a Neptune level. The oscillator is showing signs of negative divergence, but there is little reason to be unduly concerned while price holds the Neptune line and the Canary maintains itself above the +100 upper red line in the indicator panel.
Singapore ...
Singapore ...
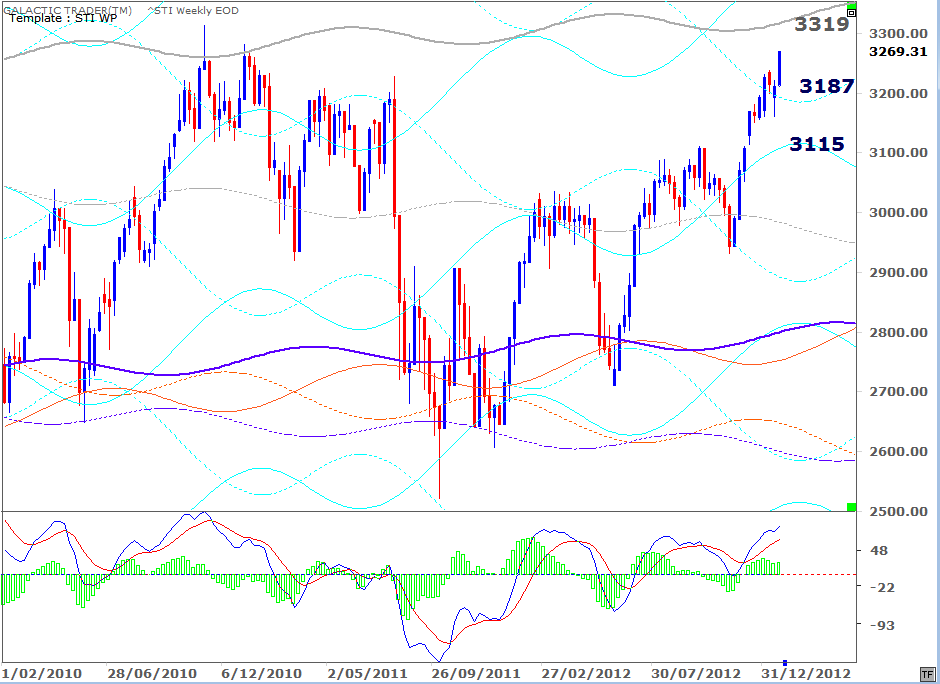
The Straits Times Index still appears to be engaged in a run to Neptune in the low 3300s. The MACD histograms are making progressively lower peaks, though the signal line is strong. This Neptune has stopped the STI twice before and the index is unlikely to breakout strongly above it, without first retesting the support levels of the Saturn lines.
Australia ...
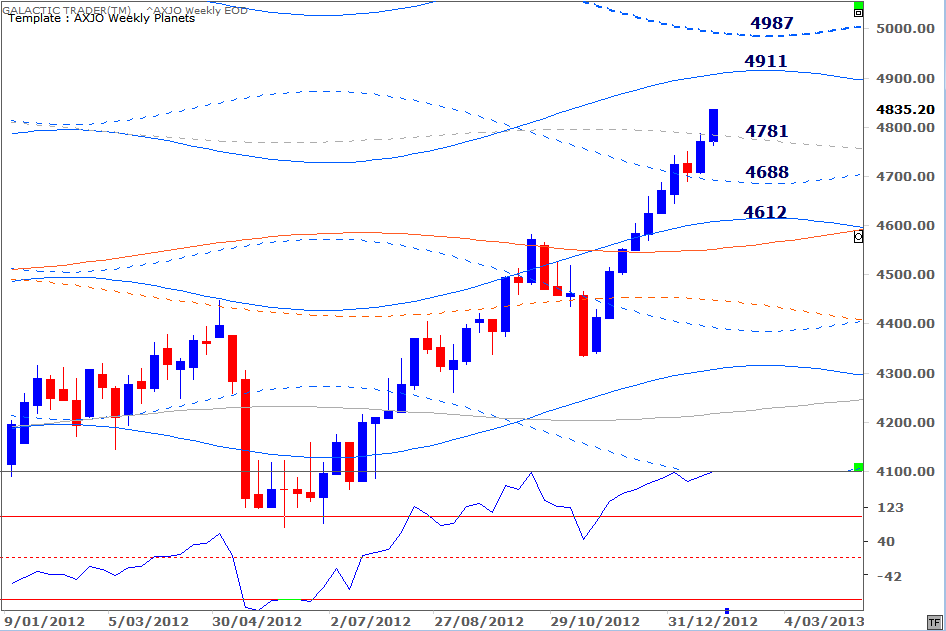
Australia ...
No oscillator divergence; the Canary is happy singing away. Happy Australia Day!