
Trading the mood swings of the monthly Lunar cycle will produce three-to-six times the profit of a simple, buy-and-hold strategy. I know thats a dramatic call, but I intend to prove it.
University studies have been conducted on astrologers assertions that Lunar phases affect public mood and, thereby, also cause an impact on stock prices.
The details and conclusions of the university studies are easily obtainable online by doing a Google search.
Basically, stock prices tend to be higher around the time of the New Moon each month and reach a temporary low point around the time of the Full Moon. Now thats statistically speaking. And there are Lies, Damned Lies - and Statistics!
Many of the Lunar trading articles found easily on the internet tend to suggest the potential gains are relatively minor, or that the phenomenon inverts so often that it cant be used as a reliable trading technique.
Even if we go to the trouble of mapping the Loonytoons on a price chart, a simple eyeball of the chart tends to make us think it works some of the time, but can be downright dangerous to our cash at other times - as with this 2011 chart of the SP500.
Trading the Moods of the Moon
What eyeballing does is give you an impression. It doesnt give you the facts.
Over the past year I decided to test the assertions for myself and log the results in a spreadsheet to test just how profitable it is to trade the mood swings of the Moon. The results were simply mind-blowing.
Not simply because they showed truly massive stock market profits during certain periods, but also because they showed when it was absolutely UNSAFE to risk your money.
What I discovered was that, statistically, the old assertions not only hold up, but when traded consistently over time, produce big profits for small amounts of time exposed to market conditions.
By introducing a simple mechanical filter The Idiot before making a decision to trade, the spreadsheets showed not only which Moon phases could be traded safely, and when, but which trades should NOT be placed under any circumstances.
But the proof of the pudding is in the eating, so lets see what the facts are when we trade The Moods of The Moon during the first 6 months of 2011 on the SP500.
Buying a single share of the index at the closing price of our starting date on the January 4 New Moon and holding until the close of the June 1 Solar Eclipse New Moon, produced a profit of $44.35 - 3.49% (bottom left corner of the table).
However, going Long for one share from each Full Moon close to the next New Moon close, produced more than twice the profit - $90.96. So, we were in the market for half the time and twice the profit (the FM-NM green phase label).
Staying OUT of the market during all New Moon-Full Moon phases would have protected us from losing some of our buy-and-hold gains but delivered much better profits for our Loonytoons strategy by being profitable Short trades. We were in the market ALL the time, but continually reversing positions - to get three times the profit of buy-and-hold.
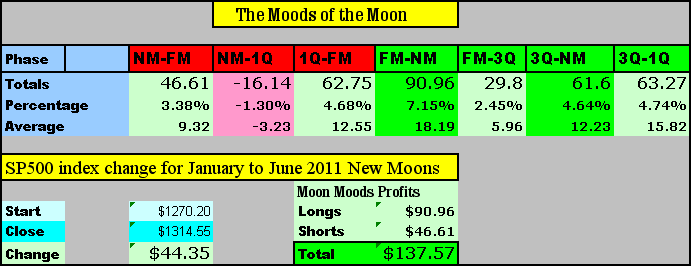
Remember that in the above table, the colour of the phase is the direction of the trade - a green phase label is a Long position, a red phase label is a Short position, or a signal to NOT stay Long during the phase.
The darker green colouring shows the very profitable trades, the light green shows profitable trades. The rose colouring shows that only ONE assumed Short phase would have resulted in a trading loss. But, remember this is overall, taking into account the full 6 month period.
However, we know the overall assertion is holding up - that, as a general rule, The Moods of The Moon can help boost our trading profits, while helping us to protect our capital base against even short term declines.
There is, though, one further step we can take to do even better!
And that is to take advantage of the Quarter Moon dates. So, our trading strategy now becomes to open 1 position at either the New Moon or Full Moon, but to add an extra position at the First Quarter or Third Quarter date.
And the table below shows a significant boost to our potential profits.
However, going Long for one share from each Full Moon close to the next New Moon close, produced more than twice the profit - $90.96. So, we were in the market for half the time and twice the profit (the FM-NM green phase label).
Staying OUT of the market during all New Moon-Full Moon phases would have protected us from losing some of our buy-and-hold gains but delivered much better profits for our Loonytoons strategy by being profitable Short trades. We were in the market ALL the time, but continually reversing positions - to get three times the profit of buy-and-hold.
Remember that in the above table, the colour of the phase is the direction of the trade - a green phase label is a Long position, a red phase label is a Short position, or a signal to NOT stay Long during the phase.
The darker green colouring shows the very profitable trades, the light green shows profitable trades. The rose colouring shows that only ONE assumed Short phase would have resulted in a trading loss. But, remember this is overall, taking into account the full 6 month period.
However, we know the overall assertion is holding up - that, as a general rule, The Moods of The Moon can help boost our trading profits, while helping us to protect our capital base against even short term declines.
There is, though, one further step we can take to do even better!
And that is to take advantage of the Quarter Moon dates. So, our trading strategy now becomes to open 1 position at either the New Moon or Full Moon, but to add an extra position at the First Quarter or Third Quarter date.
And the table below shows a significant boost to our potential profits.
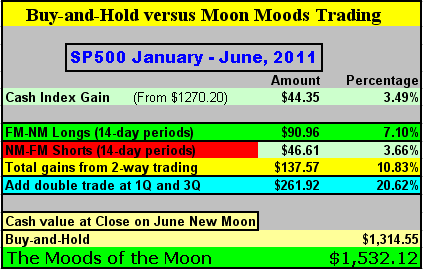
There arent many things we can do with our money able to produce a return of more than 20% in a 6 month period, knowing nothing more than how to look up the Moon phase date and time changes on the internet.
But, I do confess it takes some courage to overcome the eyeball impressions we received from glancing at that first chart of the Moon phases marked onto a price chart.
That is why The Moods of The Moon trading strategy employs The Idiot as a filter for measuring whether long term and intermediate conditions of the market are Bullish or Bearish. Obviously, the results will vary dramatically if we trade against the prevailing trend.
We need to always remember another old adage - the trend is your friend - and to place our trades in the direction most likely to produce profits.
Even when were careful, some trades will result in losses. The discipline we need to learn is that employing the strategy consistently will produce the desired result over time.
But, lets not rely on eyeball impressions and examine instead the breakdown of our Lunar phase trades on the SP500 for the first half of this year.
Copyright: Randall Ashbourne - 2011
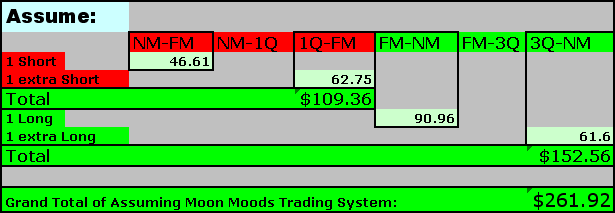
Instead of relying totally on the 14 day Short from NM-FM, we add one extra Short at the 1Q Moon - boosting the overall profit from Short trades from $46.61 to $109.36. And we adopt the same strategy when we reverse to Long trades at the Full Moon - 1 Long at Full Moon and one extra Long at 3Q Moon, boosting our Long profits to $152.56.
Taking advantage of the extra Long or Short position at the closing price on the day of the First Quarter or Third Quarter Moon dramatically increases the profits.
While the buy-and-hold strategy produced a profit of 3.5%, we could have made marginally more money by Shorting the index for a couple of weeks at each New Moon; twice as much money being exposed to the market for only half of each month from Full Moon to New - and almost six times as much money by playing the odds that the statistics will hold true when traded automatically, but consistently, over time.
While the buy-and-hold strategy produced a profit of 3.5%, we could have made marginally more money by Shorting the index for a couple of weeks at each New Moon; twice as much money being exposed to the market for only half of each month from Full Moon to New - and almost six times as much money by playing the odds that the statistics will hold true when traded automatically, but consistently, over time.
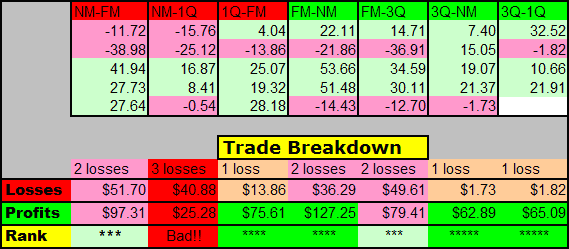
Inserting the results of each individual assumed trade into a spreadsheet allows the creation of a table which can point up any phases where the odds tend not to favour a particular trade - and we can see that Shorting immediately at the New Moon is not such a good idea in the generally positive period after the annual Santa Claus rally and into the Sell in May period.
However, what it does do is to allow us to manage the trades, tailored to the overall conditions. We know from the big picture view, employing The Idiot on monthly and weekly charts, that the overall conditions were still Bullish in this timeframe - and we will learn even more about how to judge those conditions in The Technical Section, later in the book.
So, sensibly, we would not have expected Short trades in this timeframe to produce big profits; its the green Long trades wed have expected to be more profitable. And they were. There were fast, very brief declines in the 7 days between 1Q-FM, but longer rally periods - many of them lasting beyond FM-NM and continuing on to the 1Q mark.
The Moods of the Moon also produced significant profits for Australias ASX 200 index over the same period - in the face of a loss on the cash index itself.
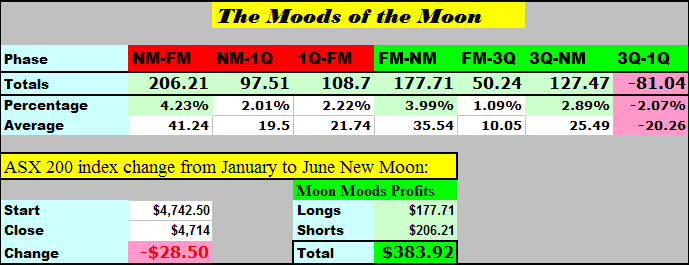
A buy-and-hold strategy on the ASX 200 for the first half of 2011 produced a loss, not a profit.
In contrast, being Long the index only for two weeks each month from Full Moon to New Moon produced a profit of nearly 4%. Playing both sides of the market - Long and Short - was considerably more profitable and produced a profit of $383.92.
Playing by the strategy of The Moods of The Moon Short at New Moon, extra Short at 1Q, reverse to 1 Long at Full Moon, add extra Long at 3Q
Well, it was MUCH more profitable than sitting there praying the ASX 200 would follow the SP500 upwards!
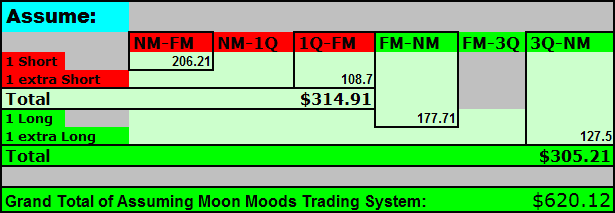
Instead of losing $28.50, the strategy made us $620.12 - a gain of more than 13% in 6 months.
I said at the beginning that trading the mood swings of the Moon would produce three-to-six times the profit of a buy-and-hold strategy - and that I would prove it. The system works, much more profitably than much of the available literature would have us believe.
Of course, there are certain conditions under which placing the assumed trades can result in massive losses.
But, they are secrets only to be revealed in:
The Idiot & The Moon


The Idiot & The Moon
is a
PDF download.
Buy the book - $30 - using the safety of a
PayPal link
is a
PDF download.
Buy the book - $30 - using the safety of a
PayPal link

eBook
now online
now online

