


Probable decline into 2nd half of month
Week beginning September 5, 2011
The next significant turning point in world stock markets is unlikely to come before the third full week of September.
Despite the sharp drops on Friday, I'm inclined to expect markets to struggle down, rather than go into another panic freefall.
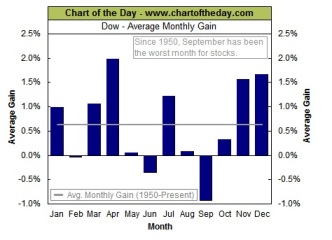
There is one caveat to that thought - September is, historically, Wall Street's worst month.
Despite the sharp drops on Friday, I'm inclined to expect markets to struggle down, rather than go into another panic freefall.
There is one caveat to that thought - September is, historically, Wall Street's worst month.


At this stage I am not seeing anything which dramatically shifts my thinking from the broad roadmap I've been outlining for the past few weekends and, in particular, in the New Bull - Old Bear big picture view which can be reached under the Articles button.
Warm regards .. and Safe trading - RA
(Disclaimer: This article is not advice or a recommendation to trade stocks; it is merely educational material.)
If you're a recent buyer of The Idiot & The Moon, or have just discovered The Eye of Ra, please consult the most recent reports under the Archives button on the top right of this page and the New Bull -Old Bear piece under the Articles button in the navigation bar (above left).
These weekend reports are an educational adjunct, designed to help readers apply the safe-trading techniques outlined in my book - and since many of those readers are from Europe, India and Asia, we will deal only briefly with Wall Street this weekend so there's time for a look at other markets.
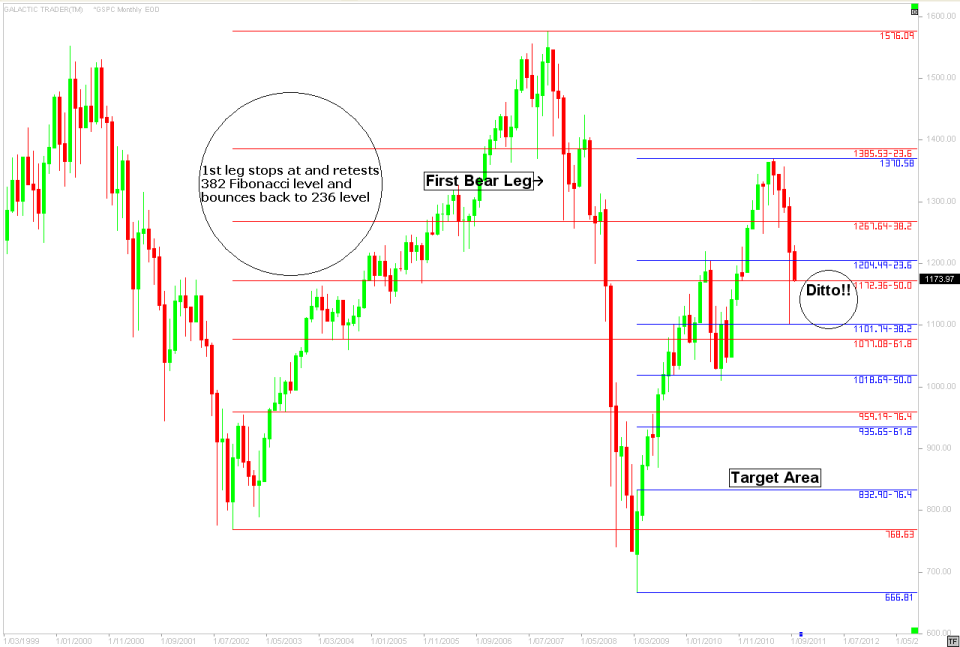
However, we will begin with the SP500 - and continue with the "probability" that we are still within the first downleg of a new Bear market phase and the likelihood this index will spend several months into the end of the year bouncing around, largely within the 236-382 Fibonacci retracement range of the Bullish recovery rally from the early 2009 Low.
These weekend reports are an educational adjunct, designed to help readers apply the safe-trading techniques outlined in my book - and since many of those readers are from Europe, India and Asia, we will deal only briefly with Wall Street this weekend so there's time for a look at other markets.
However, we will begin with the SP500 - and continue with the "probability" that we are still within the first downleg of a new Bear market phase and the likelihood this index will spend several months into the end of the year bouncing around, largely within the 236-382 Fibonacci retracement range of the Bullish recovery rally from the early 2009 Low.
Copyright: Randall Ashbourne - 2011
I am indebted to www.chartoftheday.com for the illustration on the left, showing the "average" monthly performance of the Dow Jones Industrials since 1950.
From Monday, we will be in the 1Q-FM Lunar phase, which tends to produce the sharpest losses when markets have gone into a Bear phase.
I doubt there will be a significant turn until the third week of the month when Venus and Mars both change signs and Pluto resumes Direct motion.
Venus enters its second "home" sign, Libra, on September 15 and Mars moves into the Fire sign, Leo, on September 19.
We have a Harvest Moon Full Moon on September 12 - and 3Q arrives September 20, at the time of the more powerful astrological energy signatures.
This is actually one of the charts from the New Bull - Old Bear article, updated with the current Price action. The red horizontals show how in the first Bear leg going into the 2008-2009 crash, the index dived to the 382, recovered with a little break above the 236 and bounced within the zone for several months before entering the second stage of the crash.
The blue lines apply the same technique to the Bullish run from March 2009. The index spiked down to the 382 level, bounced to slightly above the blue 236 - and plunged again on Friday back inside the 236-382 range. Obviously, so far, it is doing exactly what we expected.
The range is 1204 to 1101 and I still think that's the "likely" range for the bulk of the action - though, at some point, I do expect an attempt to regain the 1250-1270 level.
If and when Pollyanna does go back there, it will set up the next plunge - likely to crash into what is outlined as the "target area" on the chart above. But, I do not expect that plunge to occur until 2012.
If you've been following along for a few weeks, you're already familiar with how we arrived at this probable roadmap. If you're new and want more detail, please spend a little time bringing yourself up to speed in the Archives.
In a moment, we'll turn our attention to the European markets (and look at India and Asia in the coming weeks). But first, a quick look at my home market - the ASX 200.
Last weekend, I said:
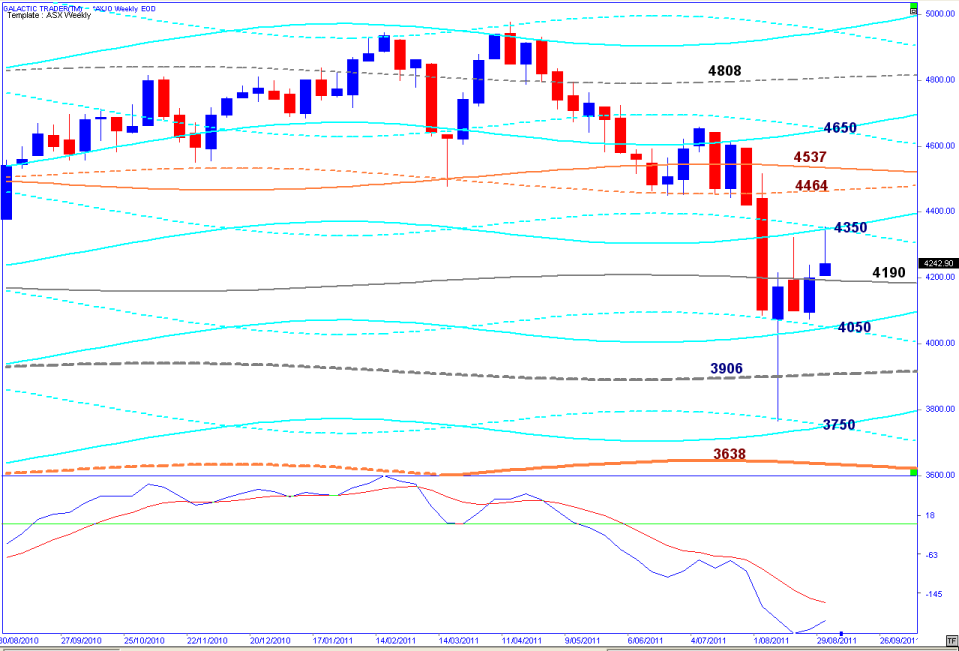
Anyway, while Polly rides a Martian spaceship between Node/Pluto levels over the long-term, Auntie seems to like the company of that miserable grump, Saturn (the cyan lines).
The implications are:
1. IF the downside is over and we're into a cyclical countertrend, she first of all needs to get above 4200 and stay there. She'll get the wobbles and need the smelling salts around 4350 ... but there is potential to get back into the 4400s.
2. IF the downside is NOT over near-term, the length of that tail and the long-term strength of Neptune lines, suggests the next downleg could truncate.
As with the SP500's Fibolin strings, it wouldn't be too unreasonable to assume the ASX200 will ride Saturn's rings and they'll mark the "likely" limits of any range.
The blue lines apply the same technique to the Bullish run from March 2009. The index spiked down to the 382 level, bounced to slightly above the blue 236 - and plunged again on Friday back inside the 236-382 range. Obviously, so far, it is doing exactly what we expected.
The range is 1204 to 1101 and I still think that's the "likely" range for the bulk of the action - though, at some point, I do expect an attempt to regain the 1250-1270 level.
If and when Pollyanna does go back there, it will set up the next plunge - likely to crash into what is outlined as the "target area" on the chart above. But, I do not expect that plunge to occur until 2012.
If you've been following along for a few weeks, you're already familiar with how we arrived at this probable roadmap. If you're new and want more detail, please spend a little time bringing yourself up to speed in the Archives.
In a moment, we'll turn our attention to the European markets (and look at India and Asia in the coming weeks). But first, a quick look at my home market - the ASX 200.
Last weekend, I said:
Anyway, while Polly rides a Martian spaceship between Node/Pluto levels over the long-term, Auntie seems to like the company of that miserable grump, Saturn (the cyan lines).
The implications are:
1. IF the downside is over and we're into a cyclical countertrend, she first of all needs to get above 4200 and stay there. She'll get the wobbles and need the smelling salts around 4350 ... but there is potential to get back into the 4400s.
2. IF the downside is NOT over near-term, the length of that tail and the long-term strength of Neptune lines, suggests the next downleg could truncate.
As with the SP500's Fibolin strings, it wouldn't be too unreasonable to assume the ASX200 will ride Saturn's rings and they'll mark the "likely" limits of any range.
Tsk*tsk ... poor old Auntie did indeed get the wobbles and faint away right on the 4350 Saturn mark, as expected. With no turn expected now until later in the month, as we head into the negative 1Q-FM period, I suspect a return to the 4400s needs to be put on the backburner until later in the year.
As I indicated at the beginning of this report, I'm inclined to expect a struggle down - rather than a crash panic mode. Always a tad hard to predict when Pollyanna goes holidaying in The Hamptons and Chicken Little takes centrestage.
But, but ... remember we discussed the potential for a Mars-Uranus crash cycle a few weeks ago? Well, that aspect has gone bye-bye, so there really ought not to be the same level of fast, shock movement around. And the mood should lift in a few weeks because Venus loves herself in Libra - and Mars much prefers the speculative action of the Fire sign Leo.
I could, of course, be disastrously wrong, but I don't really expect the spike Lows to be seriously tested on this downleg, neither on Pollyanna, nor Auntie. After all, our primary indicator - The Idiot himself - is now on a Sell on both the intermediate and long term charts. And I must consider that as I enter my dotage, either the crystal ball is getting cloudy - or my mind might be! Still, so far it's all following the expected roadmap.
So, enough waffling about America and Australia and ... Hello, Europe! My apologies to all of you for giving les cousins américains my undivided and undeserved attention, nez pah?
First of all, let's take a long-term look at Riot Central.
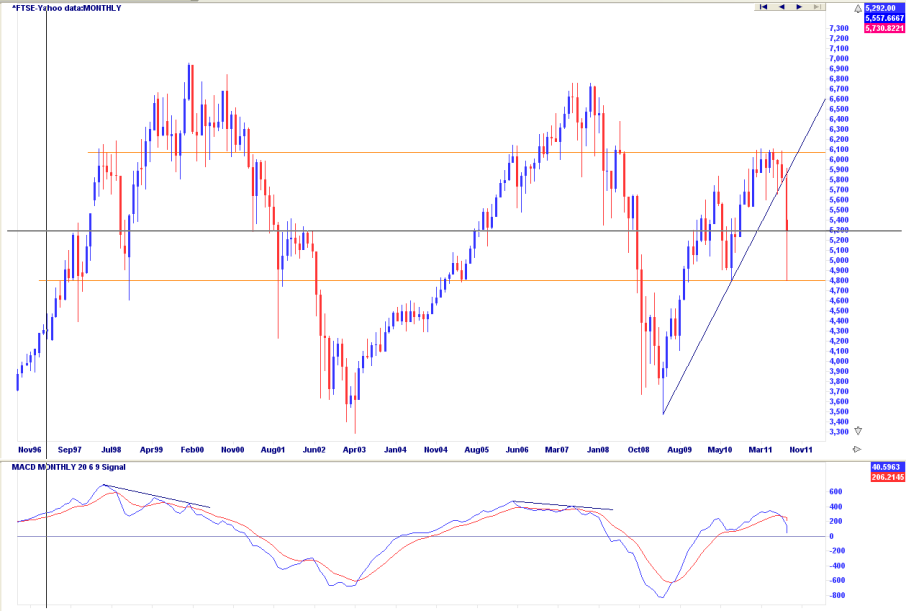
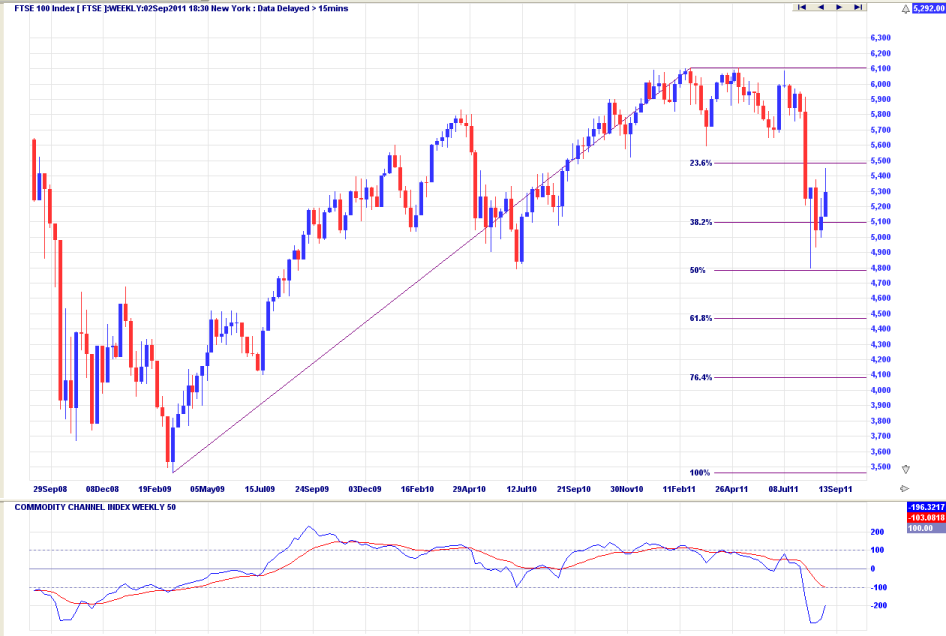
The FTSE's plunge off its too far-too fast rising trendline has been sharp and deep - responding to orange horizontal levels which have been in play since the world's dramatic rally into the 1999-2000 peaks. Price is currently sitting at the level I've placed the black crosshair and it, too, is obviously an important, long-term technical Price level.
One of the reasons I think the recent crash legs need more time to consolidate is the distinct lack of a clear negative divergence signal as that topping pattern developed just below the "irrational exuberance" zone marked by the top orange line.
In broad, easy terms the space between the orange lines marks a "range" not easily broken to the upside or the downside. Which means ... we know what the forest looks like. So where are we within the forest?
And the answer to that is ... nowhere unusual or unexpected. Once again, we see Price responding to an old tune. The touches are not precise - but they're a damn sight more useful for trading purposes than the talking heads on TV. Knowing the historical significance of the orange barriers on the previous chart, we can assume with a reasonable degree of safety that the FTSE will tend to consolidate this drop in a range between 4800 and 5600 - with most of the action bouncing around in the 5000 to 5500 marks.
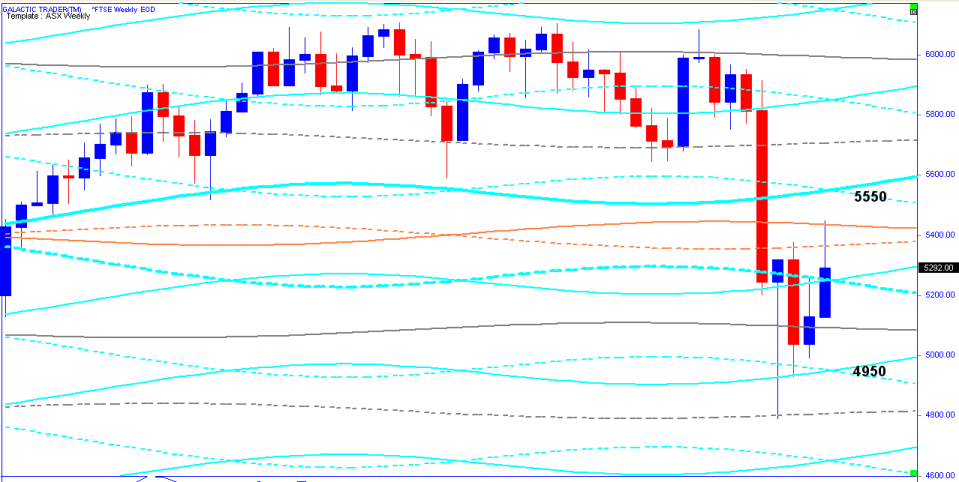
A little chat with the Old Gods broadens the potential range slightly (chart below).
A little chat with the Old Gods broadens the potential range slightly (chart below).
Let's leave London now and pop across to Paris, where the main index continues to suffer.
On now to Germany where the DAX, long-term, has been a much stronger performer after putting in a higher Low in 2009. It's also still responding to the Fibonacci levels delineated by the 2000-2003 market crash - but at a much higher level than the French neighbours.
The 2000-point plunge is very nasty - and very obvious! And I reiterate the point here I made in New Bull - Old Bear ... Can you see that sort of plunging red candle in a Bull market? The presence of these nasty red candles is, as I said, a very clear warning sign that the air is turing toxic very fast.
The 2000-point plunge is very nasty - and very obvious! And I reiterate the point here I made in New Bull - Old Bear ... Can you see that sort of plunging red candle in a Bull market? The presence of these nasty red candles is, as I said, a very clear warning sign that the air is turing toxic very fast.
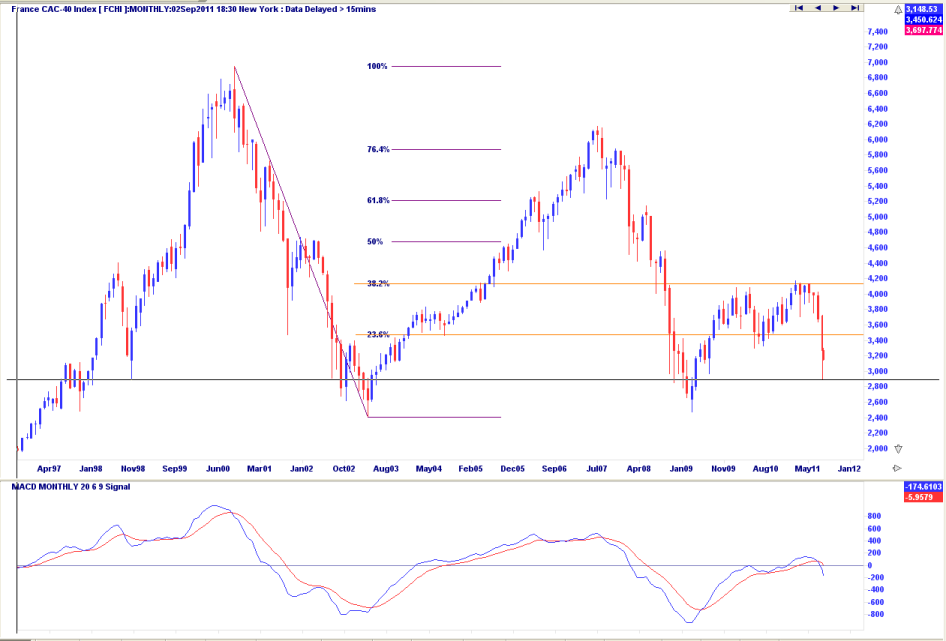
The French forest is obviously ill and remains trapped within the Fibolin strings of the 2000-2003 decline. I've put orange lines at the 238-382 markers - and the black crosshair at the recent spike down.
It's actually difficult to make a prediction about what is "likely" with this index since it recovered so little of the 2007-2009 crash leg ... and lost so much of the 2009-2011 recovery leg in such a short space of Time.
One would not put a lot of money on betting that the CAC40 will not break both the 2003 and 2009 Lows if the crash I anticipate next year takes place. In the meantime, intermediate moves should be constrained within planetary barriers.
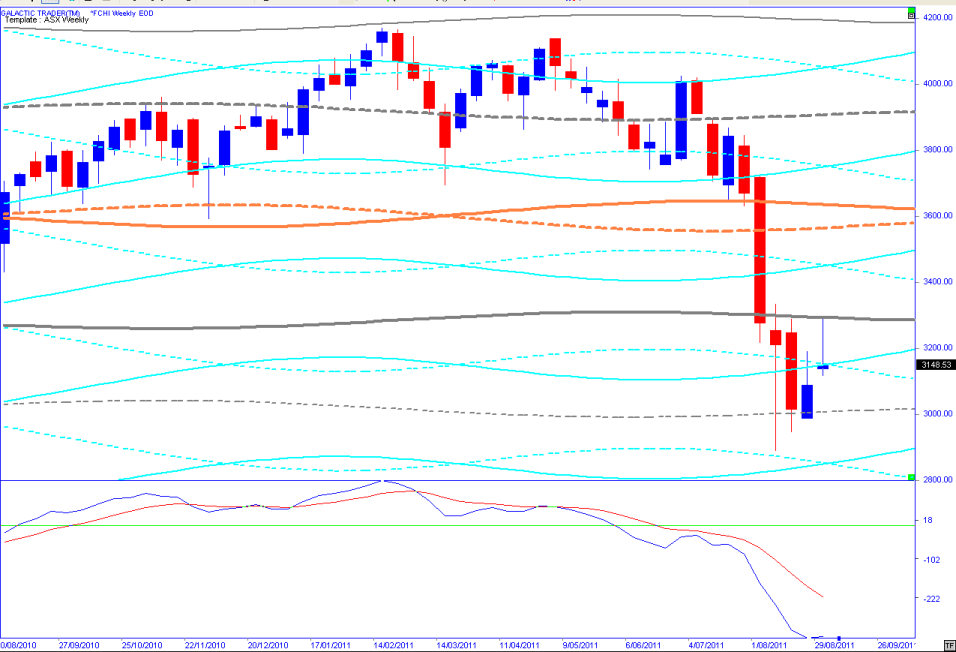
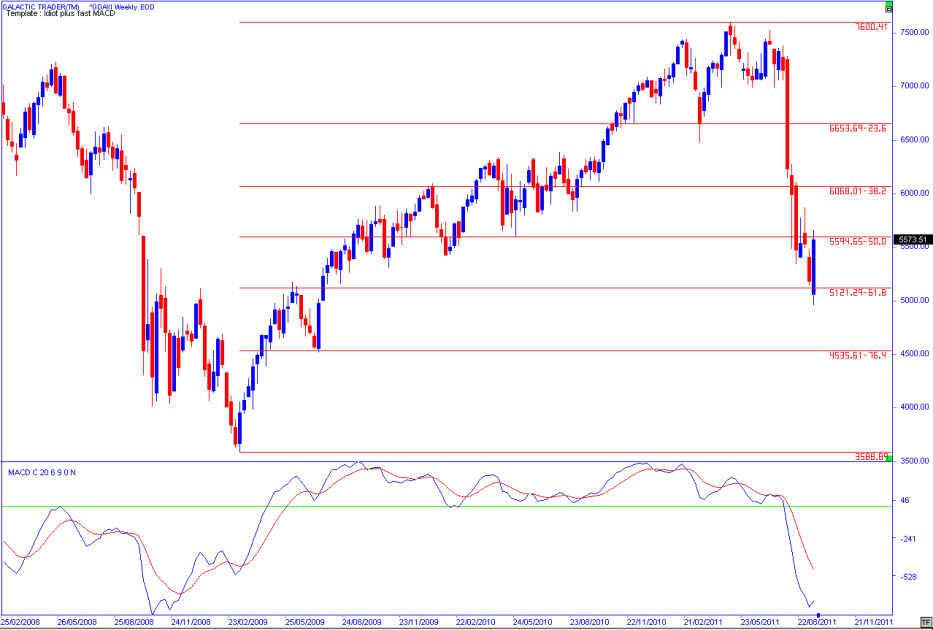
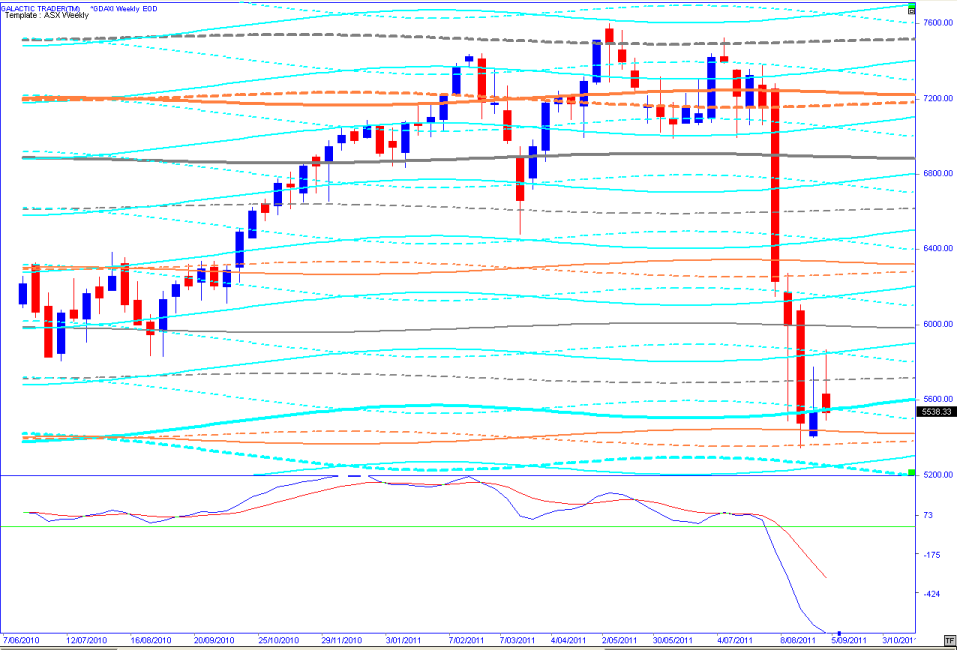
In broad terms, the DAX runs to the same Old Gods charts - at a weekly level - as most other indices in this Price range ... and we would expect the weekly moves to be largely contained within the expected planetary boundaries.
Okay, that's enough for this week, I think. I'm glad we spent some time looking at the major European indices, rather than concentrating, yet again, on Wall Street and the Pollyanna index.
As I indicated earlier, the primary purpose of these weekly reports is to help readers of The Idiot & The Moon apply the techniques from the book to real markets in real time - and it probably won't have escaped your notice that these reports do not actually deal with the main techniques - The Idiot himself or the Bi-BBs.
But you, dear reader, will know the importance of the intermediate and long-term Idiots moving to a Sell and know my advice about the need to adjust one's expectations of what will occur in these trading conditions.
The purpose of this week's report is to remind you that all the techniques, including the Old Gods, can be applied to virtually any market; not to be thrown off your game plan by media hyperbole, but concentrate on reading your charts for yourself; and to use the primary techniques for Entry and Exit levels.
I hope the exercise has been useful. I look forward to chatting, in the next couple of weeks, with my Indian and Asian readers.