Get ready for the rally ... probably!
Week beginning September 26, 2011
Okay ... my crystal ball is clearing following last week's "time of sudden twists".
Not that the volatility and panicky price swings are finished just yet. But, the way things have gone, we should now be getting close to the start of a multi-week, perhaps even multi-month, corrective rally phase.
Not that the volatility and panicky price swings are finished just yet. But, the way things have gone, we should now be getting close to the start of a multi-week, perhaps even multi-month, corrective rally phase.


The mood is about to start changing. As soon as these volatile Uranus/Pluto aspects are out of the way, the groundwork should be laid for a large-scale corrective rally higher.
Warm regards .. and Safe trading - RA
(Disclaimer: This article is not advice or a recommendation to trade stocks; it is merely educational material.)
Copyright: Randall Ashbourne - 2011
In a few minutes we will go over some familiar ground because - so far - the roadmap I laid out a few weeks ago is still unfolding largely as anticipated.
Last weekend, I had to confess turbulence was clouding my crystal ball. I said:
As they go into Libra, the Sun, Mercury and Venus will set off massive astro energy - opposing Uranus, squaring Pluto and moving on to conjunct Saturn. The taste we've had so far ... European sovereign debt, bank rumours, yet another "rogue" trader ... will be just a "taste". Strange, unexpected shocks and surprises are coming!
Well, the vacuous troll, Pollyanna, ran away and Chicken Little came roaring back to have the SP500 dive 9% in 3 days, while the DJIA repeated its early August Low. Some markets broke below the early August nosedive.
If your attention is concentrated totally on daily charts, you're probably going nuts and being driven mad by the strange, the unexpected and the "abnormal" behaviour.
And there may be more this week as the New Moon Sun (and Mercury) oppose Uranus and square Pluto, while Venus heads to a confrontation with Saturn. Venus will win this time. Libra is her sign - and, since Saturn is exalted in Libra, the miserable old grump will have to start behaving himself and acting "nicely".
Is it possible that panic will prevail and markets will continue plunging deeply? Sure! It's possible. But, the probability is starting to ease off. And here's why.
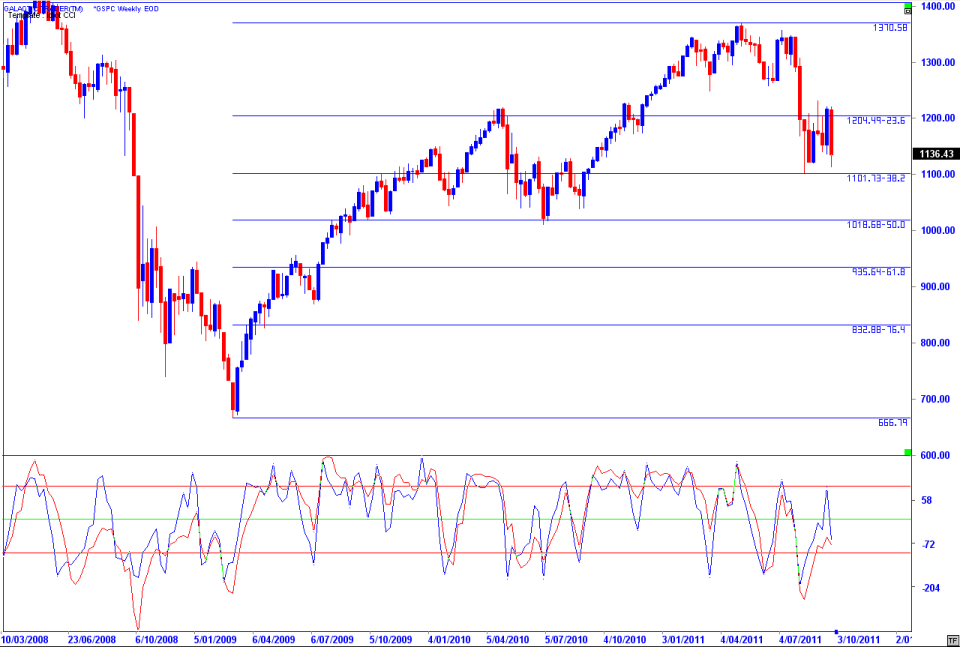
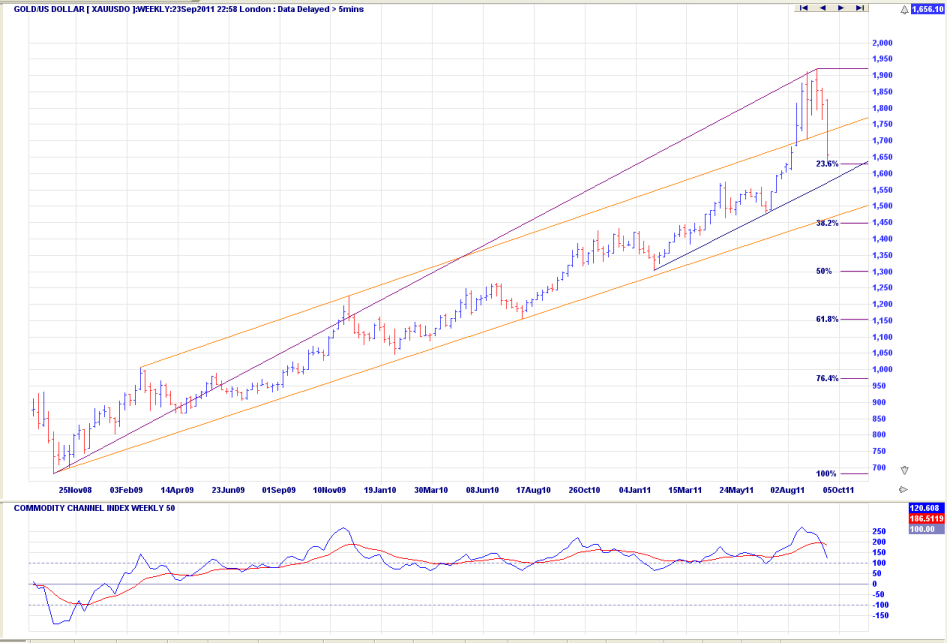
We'll start with the long-range view. Our Canary disagrees with the price of the recent High, having peaked at a reading of 200, while during earlier price peaks it was regularly hitting 250. Nothing to be unduly concerned about, but it is an early sign of building divergence.
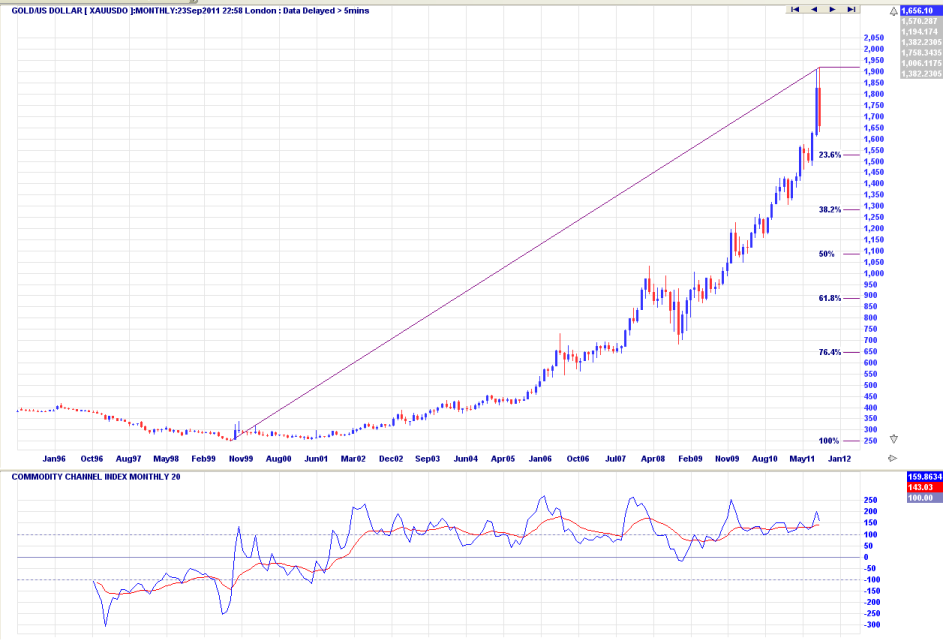
Using another of That Dead Italian Guy's rules on the same chart, we begin to get some idea of why the divergence developed where it did. Instead of using Fibonacci just to see what sort of retracement we're potentially looking at, we'll also employ the Fibo Xt tool to get an idea of where the rally ought to have finished.
Using another of That Dead Italian Guy's rules on the same chart, we begin to get some idea of why the divergence developed where it did. Instead of using Fibonacci just to see what sort of retracement we're potentially looking at, we'll also employ the Fibo Xt tool to get an idea of where the rally ought to have finished.
And, as they say: Lo, and behold! I've altered the color of the Rx mechanism to red and the Xt lines are blue. The price of gold overshot a 100% extension from the 2008 high, but had trouble closing and holding above the level. The 236 retracement and the 618 extension level are very close in price, so we'd expect at least a tempory Low to form around that level, if it gets that low.
Oh! Which reminds me. I did mention sometime during the past few weeks that if markets tanked, gold wouldn't necessarily go in the opposite direction, because in a real panic, the Masters of the Universe also get massive margin calls and have to sell everything. That appears to be what transpired. But, as you can see from the chart above, not really surprising in Fibonacci terms.
Oh! Which reminds me. I did mention sometime during the past few weeks that if markets tanked, gold wouldn't necessarily go in the opposite direction, because in a real panic, the Masters of the Universe also get massive margin calls and have to sell everything. That appears to be what transpired. But, as you can see from the chart above, not really surprising in Fibonacci terms.
You probably think I'm quite mad for my repeated statements that I expected markets to "struggle" down. A 9% plunge in 3 days ain't a struggle, right? But then, y'see, I try not to get caught up these days in the emotional rollercoaster rides.
From MY point of view, it has taken 6 weeks to NOT break the Low of early August. Okay, some markets did ... but I've been concentrating on Pollyanna, the SP500.
AND ... it is still bouncing around in the 236/382 Fibonacci Rx levels ... AND ... it is trying to make a lower Price (at least on a closing line basis) with HIGHER troughs in The Canaries.
So, despite the Awoe! Alas! The sky is falling ... Mummy, mummy, Greece will default and the Fed doesn't love me anymore ... there is nothing actually happening here markedly different from what I said weeks ago (refer to New Bull - Old Bear) was likely to happen.
It might be that I'll have to rip up the roadmap if something dramatic and dire happens immediately ahead. But, for the moment, it seems as if most markets aren't going to do much worse than a relatively marginal break of the early August dive - and that should complete the first major downtrend wave of the resumed Bear market.
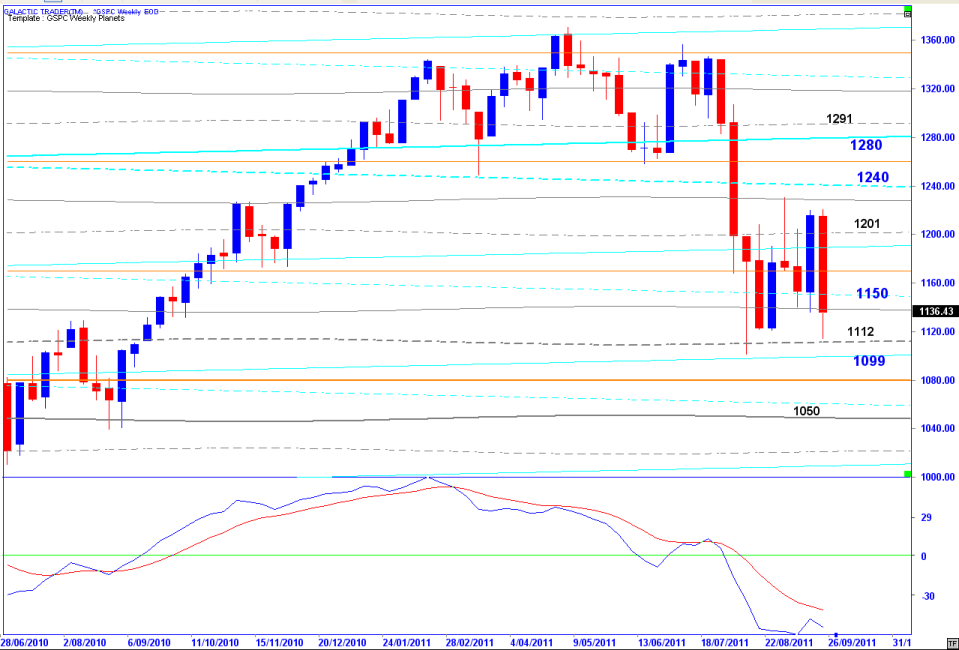
And if it all continues to follow the timeworn script, the next move should be a rally which goes back to at least test the horizontal levels which underscored the multi-month distribution pattern. We've discussed those Price levels during the past few weeks, but let's recap anyway ... and to do that, I'll use my weekly planets chart for Pollyanna.
From MY point of view, it has taken 6 weeks to NOT break the Low of early August. Okay, some markets did ... but I've been concentrating on Pollyanna, the SP500.
AND ... it is still bouncing around in the 236/382 Fibonacci Rx levels ... AND ... it is trying to make a lower Price (at least on a closing line basis) with HIGHER troughs in The Canaries.
So, despite the Awoe! Alas! The sky is falling ... Mummy, mummy, Greece will default and the Fed doesn't love me anymore ... there is nothing actually happening here markedly different from what I said weeks ago (refer to New Bull - Old Bear) was likely to happen.
It might be that I'll have to rip up the roadmap if something dramatic and dire happens immediately ahead. But, for the moment, it seems as if most markets aren't going to do much worse than a relatively marginal break of the early August dive - and that should complete the first major downtrend wave of the resumed Bear market.
And if it all continues to follow the timeworn script, the next move should be a rally which goes back to at least test the horizontal levels which underscored the multi-month distribution pattern. We've discussed those Price levels during the past few weeks, but let's recap anyway ... and to do that, I'll use my weekly planets chart for Pollyanna.
Ideally, the perfect end to this pattern would be if the SP500 makes a marginal new Low and rebounds higher. 1099 or 1080 would be just hunky dory. The bugger of it is that it may not happen, because it's legitimate for this final thrust down to truncate early, especially since other indices have already made the "perfect" pattern.
IF we are now rapidly approaching a rally phase - and, I repeat, that's what's most likely - it could continue all the way into the end of the year, even early January, and the planetary prices suggest anywhere in the range from 1240 to 1280 is likely.
That gets the SP500 back inside the bottom range of the topping/distribution pattern ... and is what should happen after the first leg down in a renewed Bear campaign.
There are two alternative possibilities - a fast and immediate plunge to 1050-ish, or a resumption of the Bull market and new Highs by January. I stress, they're possible ... but not probable.
Exactly how you want to play this market is up to you. My advice would be to NOT bet the farm in either direction, but to take smaller-than-normal positions at the clearly-defined horizontal levels - either Fibonacci or planetary. Yes, it seems dangerous and volatile and mad and unpredictable when Uranus (in Aries!) is being triggered.
And you'll go broke bloody fast if you're placing large stakes in the wrong direction at the wrong time. Remember ... both the long-range and intermediate Idiots are on a Sell signal; NOT a time to be placing large Long bets. These are the conditions The Idiot & The Moon warns we must adjust our profit expectations.
So, I think: We are getting very close now to a tradeable rally which should last a minimum of 7 weeks and should at least try to regain the bottom of the distribution zone. There is a likely roadmap still in play; the astrological high-energy aspects should start to ease off during the coming week and the crazy volatility should start to abate.
But! It probably isn't over quite yet ... and even if the likely rally becomes reality, we ought not to be risking large amounts of our money on the unlikely chance the Bear is dead and the Bull is back. It'll be a sucker's rally!
***
Now, I have a favour to ask. One of our readers has asked me if I've identified the long-range planetary markers for gold. I confess, I normally use only the technical mechanisms in Incredible Charts for gold because I haven't found decades-long data I can easily import into GT4 to create reliable Old Gods charts for either gold or silver.
If anyone knows a site from which I can download many years of gold and silver prices, please email me. Alternatively, if you've created those charts yourself in GT4 and don't mind sharing your research, please send me a JPEG or PNG similar to those I use in this weekly report. The eddress is: randall@theidiotandthemoon.com
***
I probably should stress, however, that The Moods of the Moon and the Old Gods charts, while fascinating, are not the core system of The Idiot & The Moon. The book is designed primarily to teach you how to make safe, regular, profitable trades using some very simple technical rules and techniques - which are also supposed to teach you when to get the hell out of Dodge!
So, we'll take a look at gold using some of the techniques from the book, starting - as we always should - with what the forest itself looks like.
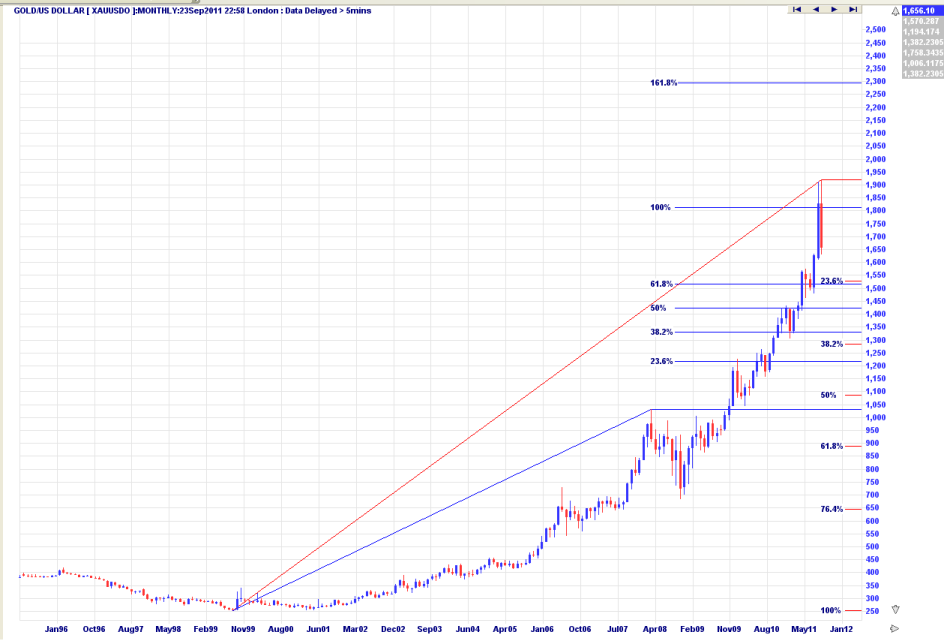
So, having checked out the forest, we can take a look at the intermediate, weekly chart.
Firstly, there were 3 rising trendlines and the last one of them (not shown; use your imagination!) was obviously a blow-off angle. We go into those in one of the chapters in The Technical Section.
Price has dropped back inside a medium-term rising channel, defined in orange ... but hasn't dropped as low yet as the second, rising trendline. AND ... that faster trendline is running at about the angle where a drop to 236 on the monthly would also come into play.
So, there's a rising trendline and two Fibonacci saviours lying not too far below. With the inner Gods - Sun, Mercury, Venus and Mars - all heading towards Sagittarius in the next few months, the gold rush probably isn't over yet.
Oh ... one more thing. There was a small level of divergence at the last price peak in the height of the MACD. But, overall, the peak is in line with earlier price highs and what developed on previous occasions was a continuation pattern. That, too, is dealt with in The Idiot & The Moon, and this is probably a good "live" example to try to follow and implement that section of the book.
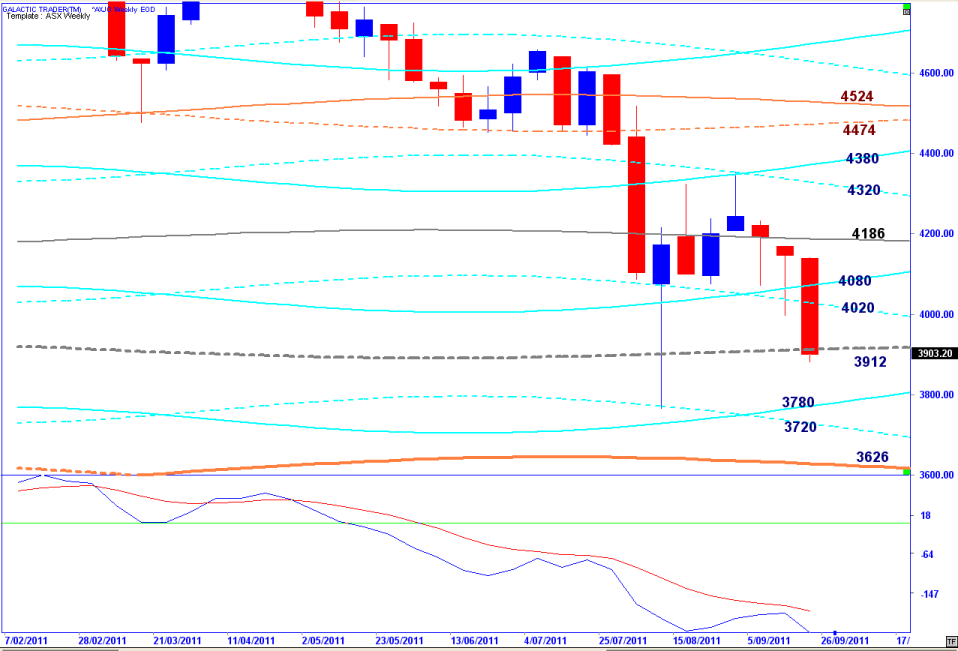
Okay, time now for a quick look at Auntie ASX 200!
Firstly, there were 3 rising trendlines and the last one of them (not shown; use your imagination!) was obviously a blow-off angle. We go into those in one of the chapters in The Technical Section.
Price has dropped back inside a medium-term rising channel, defined in orange ... but hasn't dropped as low yet as the second, rising trendline. AND ... that faster trendline is running at about the angle where a drop to 236 on the monthly would also come into play.
So, there's a rising trendline and two Fibonacci saviours lying not too far below. With the inner Gods - Sun, Mercury, Venus and Mars - all heading towards Sagittarius in the next few months, the gold rush probably isn't over yet.
Oh ... one more thing. There was a small level of divergence at the last price peak in the height of the MACD. But, overall, the peak is in line with earlier price highs and what developed on previous occasions was a continuation pattern. That, too, is dealt with in The Idiot & The Moon, and this is probably a good "live" example to try to follow and implement that section of the book.
Okay, time now for a quick look at Auntie ASX 200!
Not beautiful, with another nasty red weekly candle! It's a lower close than the sharp bounceback in early August. But, I do reiterate the point ... it IS 6 weeks later and she hasn't yet gone as low.
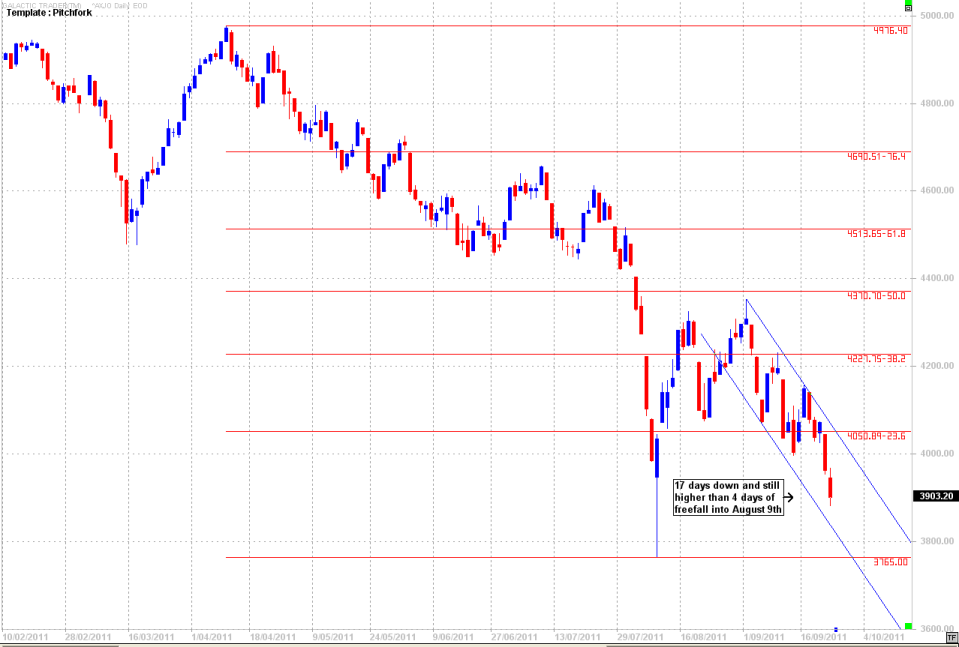
It's not mentioned in the book because I tried to ... well I tried to condense an encylopedia onto the back of a napkin, as one of my early Canadian readers, Hal, described it ... but, there is a technique known as "trading against a spike". It happens in both directions.
Actually, you can see an example of it as a topping pattern in the gold charts earlier. Big spike up and a retest of the spike that failed, leading to a sharp move down.
Now, what we are HOPING to see - to confirm our roadmap - is the exact opposite of that situation in the stock indices; we want to see it trading against the spike ... S-L-O-W-L-Y ... to make a nice, firm bottom!
Because if we do see that, we get a sharp move ... UP!
Here's how it works:
Mad it is you might think I am, talking about expecting to see indices "struggle" down. But, Auntie is a teddibly well-behaved old girl, most of the time ... and this is an example of what I'm talking about.
She's been moving down relentlessly for 17 days and still hasn't exceeded what she lost in 4 days of plunge going into August 9. As you can see from Auntie's weekly planets chart, there are downside levels she might still reach. The panic might still be on. In fact, with Sun and Mercury opposing Uranus, I'm pretty sure Chicken Little hasn't stopped doing his headless chook routine.
But, it does seem as if the downtrend is losing momentum ... when and where it should be losing momentum ... and, as with all moves that trade against a spike successfully, the omens, portents and entrails are suggesting a rally waits in the wings.
Okay, that's all, folks! No Euro markets, no Asian markets this weekend. After all, you're supposed to be learning how to do it all for yourself, without relying on news and expensive advice!
Not of course that this column contains advice! Golly me gosh, no. That would be very naughty. And I'm getting far too old to be naughty. It is, merely, an attempt at educational material. Or, if you prefer, the ramblings of a silly, old bugger. Whatever!