
Reviewing the correction & Asian indices
Week beginning September 2, 2013
And now we enter September which has been, on average, the worst month for Wall Street since the 1950s.

Copyright: Randall Ashbourne - 2011-2013
The most critical dates for the month I expect to be September 6 and 20. In Forecast 2013, I said this about the month:
"September has the potential to bring relief from the volatility, though it probably wont occur until the second half of the month.
While August looks to be a high-stress month, the September transits hold more promise, beginning with the Venus trine to Neptune as the month hits the halfway point.
Both Mars trine Uranus and Venus conjunct Saturn have a spotty record for turning markets during sustained trends, but can produce significant highs or lows during those periods the oscillators have moved into overbought or oversold readings.
The Venus trine to Jupiter has a more reliable record and tends to produce more highs than lows. It will be important here to watch the strength and direction of any market moves leading into the date, since the aspect can mark a turning point."
In a few moments we'll look at a couple of options for where we probably are within the correction. At this stage, I'm still assuming that it is a major correction and not the first leg down of a new Bear.
Before we get to the charts, though, let me outline the astrological weather for the month ... and the most likely dates for trend changes.
Before we get to the charts, though, let me outline the astrological weather for the month ... and the most likely dates for trend changes.


Safe trading - RA
(Disclaimer: This article is not advice or a recommendation to trade stocks; it is merely educational material.)
Well, August has been a high-stress month ... for most markets. The most important aspects for September involve Venus and Mars aspecting Jupiter, Saturn and Uranus.
Sep 01 SUN trine Pluto
Sep 05 New Moon
Sep 09 MARS square SATURN
Sep 14 Venus trine Neptune
Sep 15 Mercury square Pluto, MARS trine URANUS
Sep 16 Mercury trine Uranus
Sep 19 Full Moon, VENUS conjunct SATURN
Sep 20 Mercury square Jupiter, Pluto Direct
Sep 27 Venus trine Jupiter
I indicated last weekend I thought the Wall Street indices had entered what I stressed was a temporary bounceback mode. And it was very temporary, which suggests a stronger bounce might now have started.
I really don't want to delve too deeply into Elliott Wave analysis. But the basics are that corrections tend to trace 3 distinct waves, referred to as an ABC ... where A is down, B is up and C is a downwave which completes the pullback. The difficulty in real time analysis is that each of these waves can break down into their own abc patterns - and since an A wave can be made up of 3 or 5 waves, it's often hard to know exactly where it has finished.
So, we'll take a look at the two most probable options.
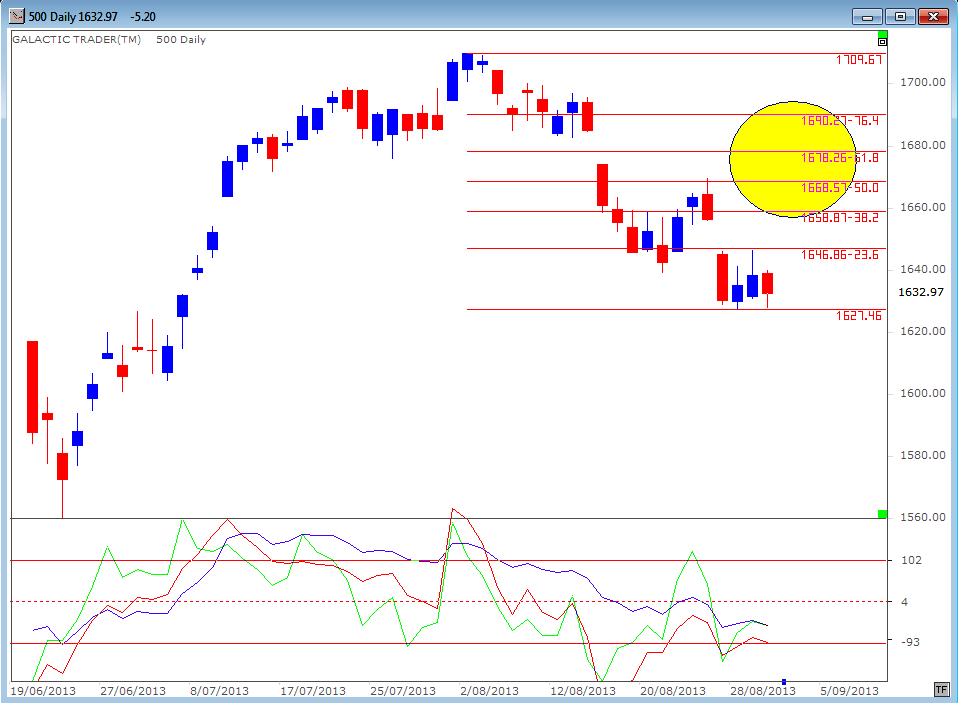
In our first chart this weekend, we'll assume that the A wave down did not complete until last Wednesday - making it a 5-wave A, rather than a 3-wave affair which finished on Wednesday of the previous week.
If the SP500 is now marking out its B wave upwards bounce, the index is likely to climb back to somewhere between 1658 and 1690.
Sep 01 SUN trine Pluto
Sep 05 New Moon
Sep 09 MARS square SATURN
Sep 14 Venus trine Neptune
Sep 15 Mercury square Pluto, MARS trine URANUS
Sep 16 Mercury trine Uranus
Sep 19 Full Moon, VENUS conjunct SATURN
Sep 20 Mercury square Jupiter, Pluto Direct
Sep 27 Venus trine Jupiter
I indicated last weekend I thought the Wall Street indices had entered what I stressed was a temporary bounceback mode. And it was very temporary, which suggests a stronger bounce might now have started.
I really don't want to delve too deeply into Elliott Wave analysis. But the basics are that corrections tend to trace 3 distinct waves, referred to as an ABC ... where A is down, B is up and C is a downwave which completes the pullback. The difficulty in real time analysis is that each of these waves can break down into their own abc patterns - and since an A wave can be made up of 3 or 5 waves, it's often hard to know exactly where it has finished.
So, we'll take a look at the two most probable options.
In our first chart this weekend, we'll assume that the A wave down did not complete until last Wednesday - making it a 5-wave A, rather than a 3-wave affair which finished on Wednesday of the previous week.
If the SP500 is now marking out its B wave upwards bounce, the index is likely to climb back to somewhere between 1658 and 1690.
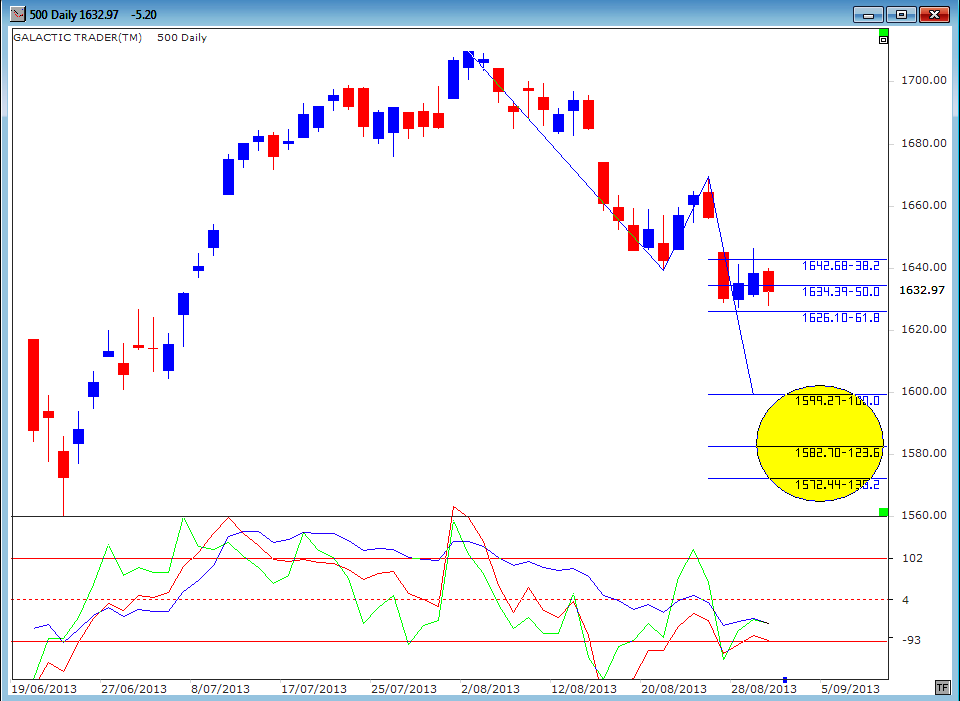
In the next chart, we will look at the alternative scenario ... that the A wave down finished on August 21, that there was a B bounce into last Monday's high, and that the index has been in a C wave down since that high.
If this is the case, there are some loose rules which provide a guide. The minimum "normal" distance for a C wave is a Fibonacci 618 extension of the A wave. More normal still is that C will equal A - giving a target around 1600 for the end of the correction.
There are occasions where C runs longer and/or deeper than the A wave - which gives two targets in the upper 1500s.
Company reporting season has been a relatively benign time for the ASX200. Apart from some individual stock performances, the market isn't stretching itself in rally mode - but nor has it been battered by big declines.
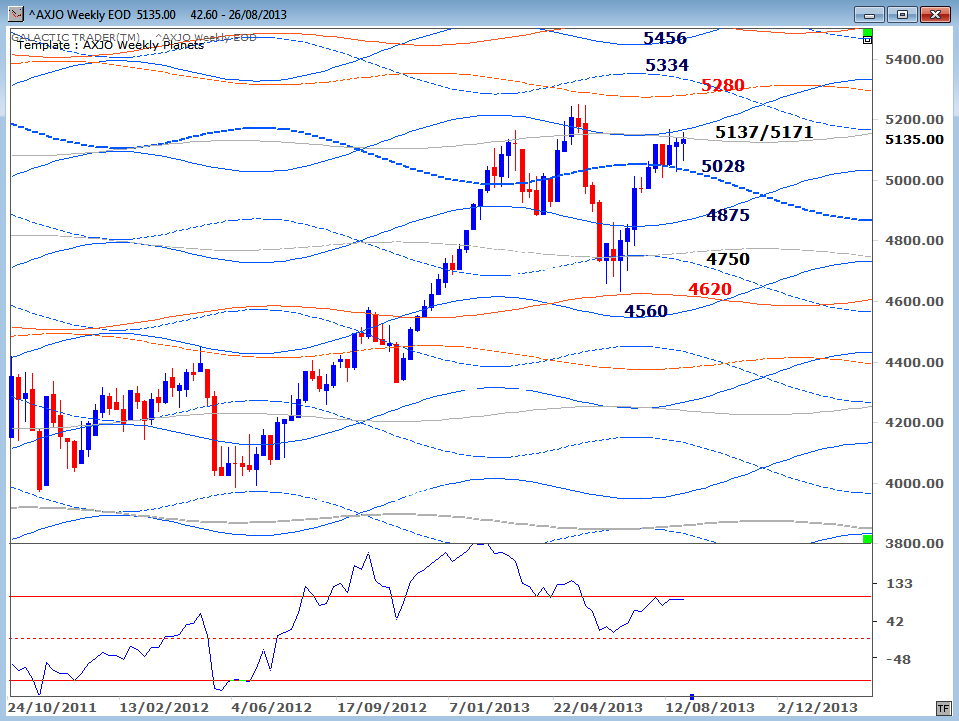
The index continues to move between two important Weekly Planet levels ... major Saturn acting as a downside floor and a lesser Neptune/Saturn zone providing an upside cap to the range. Big Bird is not at all happy and unless the index can breakout above the Neptune/Saturn "ceiling", the danger of an extremely negative Head&Shoulders pattern remains.
However, "predicting" the immediate future of the ASX is made more difficult by the imminent Federal election. To some extent, the index is already pricing in a conservative victory. That doesn't necessarily mean it'll be a case of "buy the rumour, sell the news", though an upset win by the incumbents would probably cause turmoil.
INDIA:
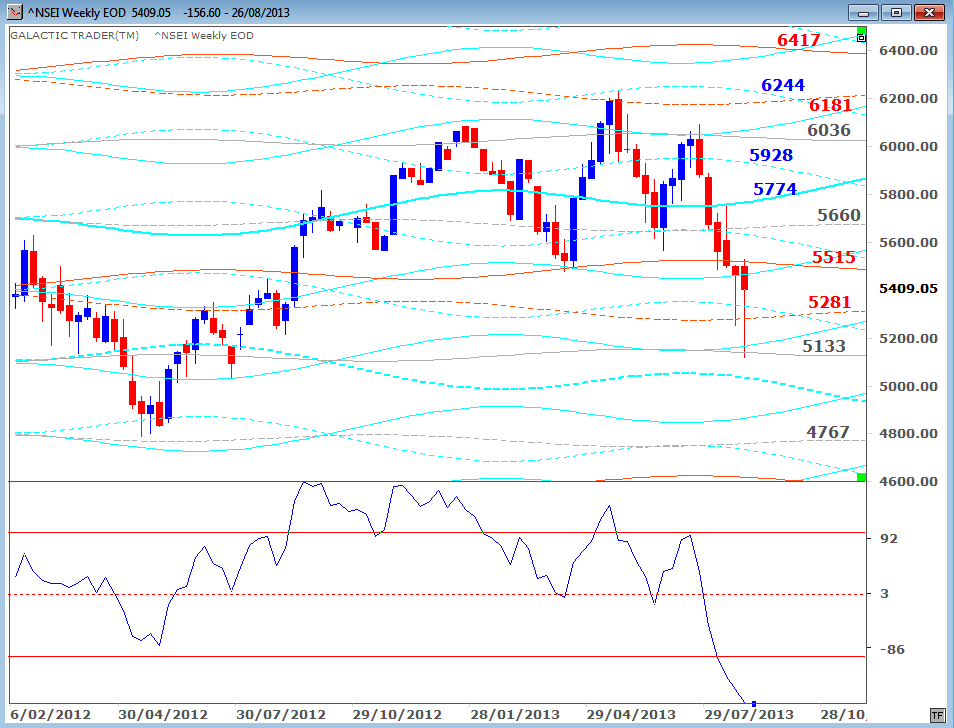
While many of the Western indices have been holding up reasonably well, several of the Asian markets have been taking a Bear-like hammering - including India's Nifty and Sensex indices.
Long tails on the last two weekly bars indicates buyer support is re-emerging at the 5280s Uranus and 5100s Neptune levels on the Nifty's Weekly Planets chart. It's probably an example of the potential facing indices like the ASX200, if it doesn't overcome the Head&Shoulders pattern very quickly.
INDONESIA:
We will know the second scenario is in play if there is a close this week below last Wednesday's low.
There are, unfortunately, other scenarios, too. And that's the problem with Elliott Wave analysis in real time, rather than in retrospect.
With hindsight, it's the perfect theory. In practise, it can be extremely difficult at particular times.
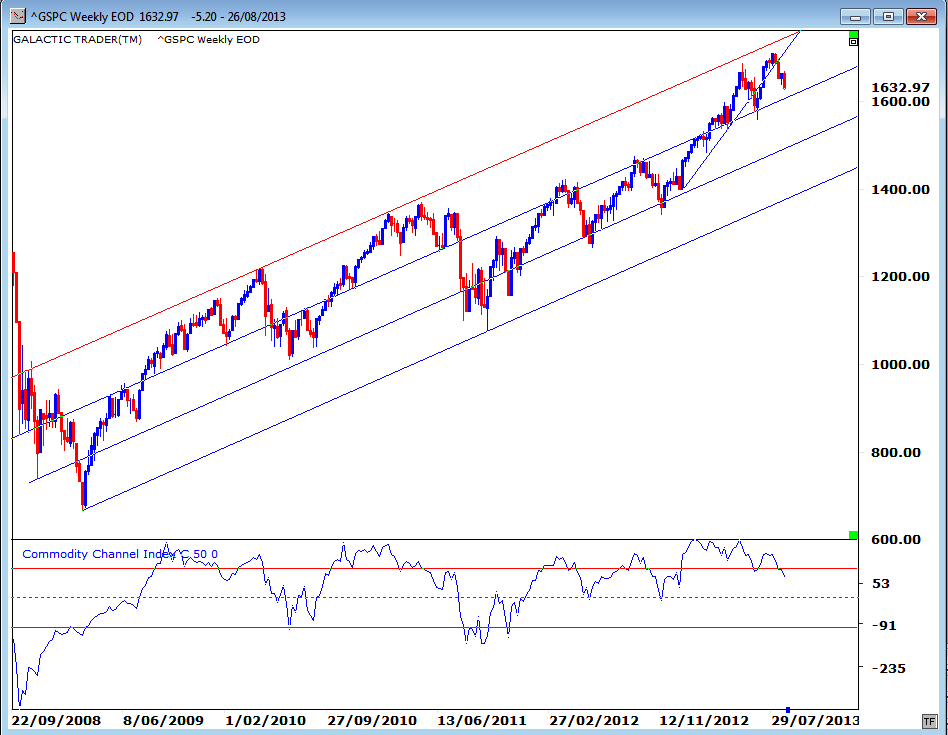
Overall, I have little doubt the correction is not finished. Last weekend, I showed the Dow Jones Industrials to illustrate why; this weekend, we get the same sort of reading from the 500's weekly channel chart.
Big Bird - the 50CCI oscillator - remains distinctly unhappy. As with the Dow, the 500's oscillator is making a deeper plunge than it did during the June correction, indicating the potential for this downturn to go at least as deeply as it did in June.
There are, unfortunately, other scenarios, too. And that's the problem with Elliott Wave analysis in real time, rather than in retrospect.
With hindsight, it's the perfect theory. In practise, it can be extremely difficult at particular times.
Overall, I have little doubt the correction is not finished. Last weekend, I showed the Dow Jones Industrials to illustrate why; this weekend, we get the same sort of reading from the 500's weekly channel chart.
Big Bird - the 50CCI oscillator - remains distinctly unhappy. As with the Dow, the 500's oscillator is making a deeper plunge than it did during the June correction, indicating the potential for this downturn to go at least as deeply as it did in June.
Now, that's "potential", not a guarantee. As I said last weekend, let's not get married to the idea, but continue to watch the charts for clues ... and especially the direction of the index going into the dates marked with a yellow highlight on the list above.
Having largely neglected the rest of the world for the past couple of weeks, it's time to restore some international balance.
AUSTRALIA:
Having largely neglected the rest of the world for the past couple of weeks, it's time to restore some international balance.
AUSTRALIA:
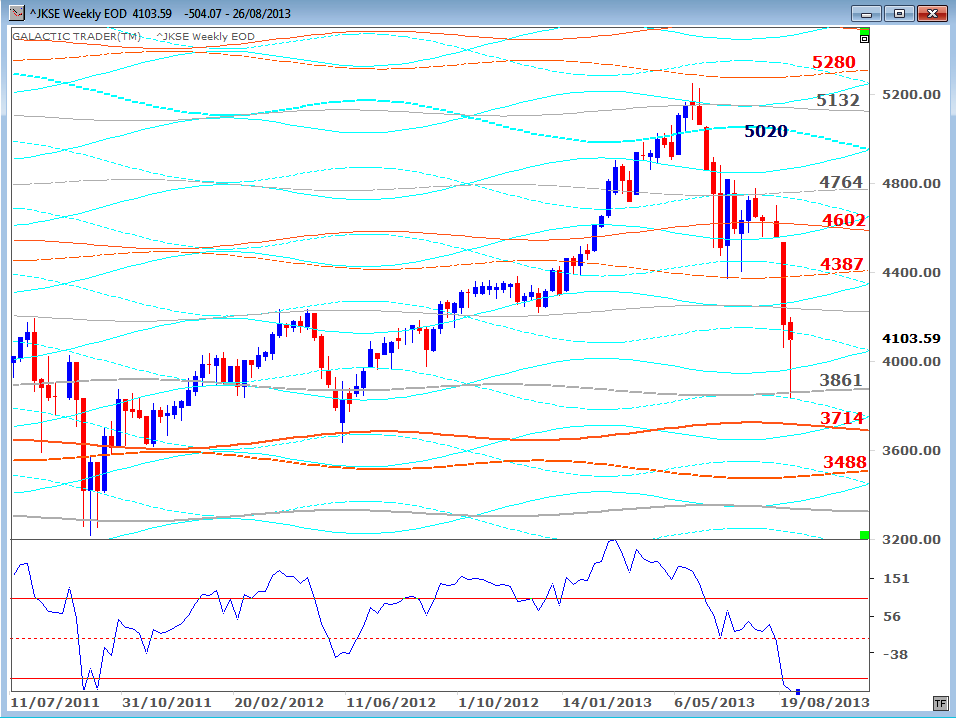
Jakarta may also have hit bounce levels. The oscillator has plunged very deeply, indicating more trouble ahead.
MALAYSIA:
MALAYSIA:
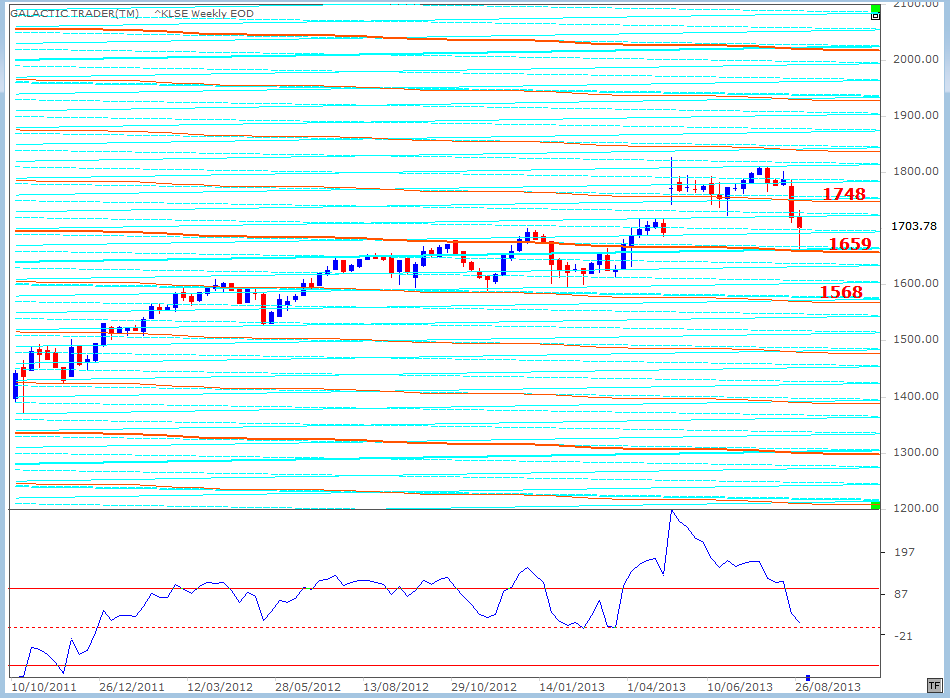
At this stage, Kuala Lumpur is not in the same state as some other parts of the region. The index gapped to new highs earlier in the year when the ruling party beat off a very strong challenge from opposition groups in the national elections.
The price action over the past couple of weeks has simply closed the gap and there are no clearcut alarm bells from the oscillator to suggest Malaysia is in Bear mode.
SINGAPORE:
The price action over the past couple of weeks has simply closed the gap and there are no clearcut alarm bells from the oscillator to suggest Malaysia is in Bear mode.
SINGAPORE:
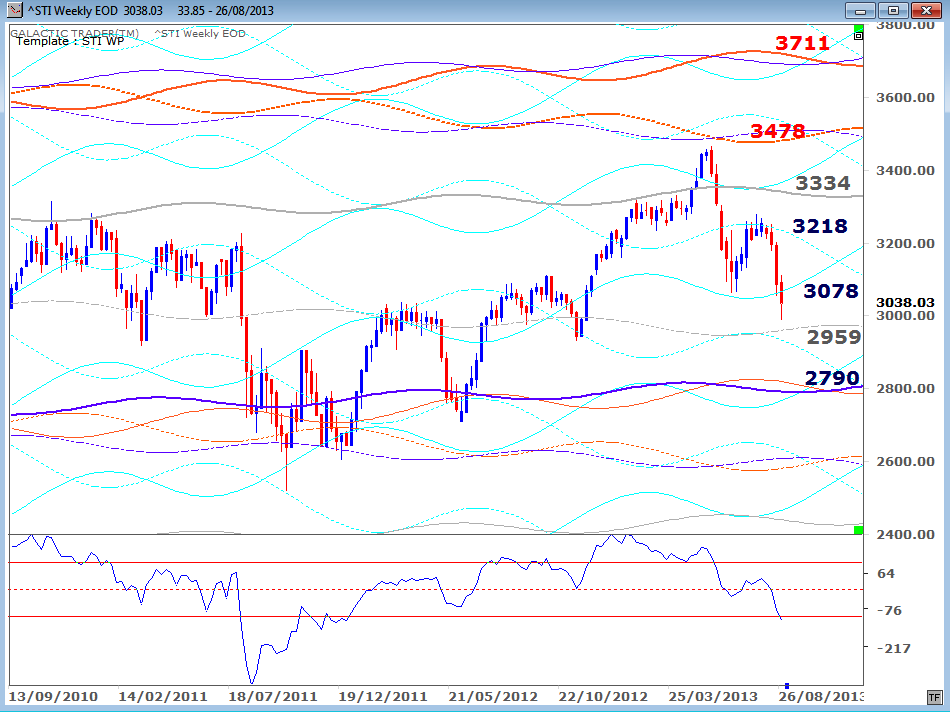
The Straits Times Index has probably seen the worst of its drop. This is an example of the ABC style of correction I was talking about earlier ... the A wave plunge, the B bounce, and the index now getting close to completing what should be the C wave.
So far, the C wave has stalled at the level where it is 61.8% of the length of the A wave drop. It may be over, but probably not.
HONG KONG:
So far, the C wave has stalled at the level where it is 61.8% of the length of the A wave drop. It may be over, but probably not.
HONG KONG:
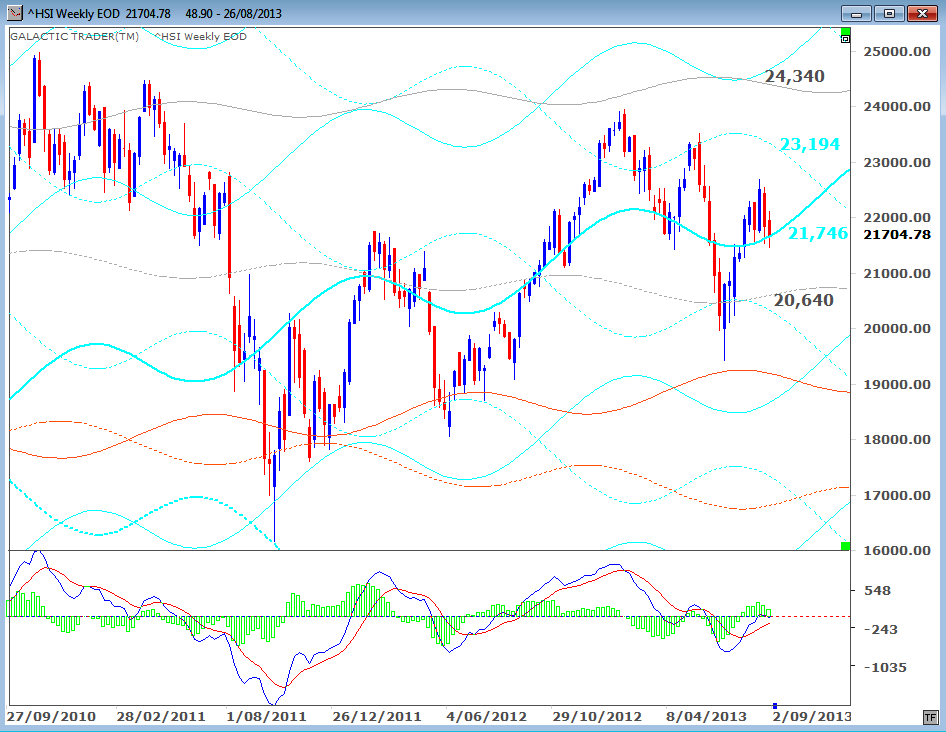
The Hang Seng seems to be in a stronger position in the near-term. However, for the moment we still have lower Highs and deeper Lows - so an abundance of caution remains necessary. You can see the decline from the February peak into the June lows appears to be an ABC 3 wave pattern.
But. Arghhhh! There is the possibility that it's not a complete ABC correction, but merely an abc correction which completes a 3-wave A ... and the index is topping out its B bounce.
Yes, yes, yes! It IS confusing ... and complicated ... and fraught with difficulty. This is why you and I don't talk about Elliott Waves very often!
And why I introduced the three-timeframe Idiot system so that we don't have to drive ourselves nuts with this stuff!
Next weekend, I'll try to look at the European indices again and bring those charts up-to-date for you.
Until then ...