Turbulence clouds the crystal ball
Week beginning September 19, 2011
For the past few months we have been following a broad, general roadmap, but now face a time of sudden twists.
When I launched both the book and this website in June, I warned the probable map was for a return of the Bear market and in The Eye of Ra for the week beginning July 25, warned the Bull recovery run was about to fail.
When I launched both the book and this website in June, I warned the probable map was for a return of the Bear market and in The Eye of Ra for the week beginning July 25, warned the Bull recovery run was about to fail.


Which is why, here at The Idiot & The Moon, we employ technical tools - in conjunction with The Moods of The Moon and the planetary prices dictated by the Old Gods.
Warm regards .. and Safe trading - RA
(Disclaimer: This article is not advice or a recommendation to trade stocks; it is merely educational material.)
Copyright: Randall Ashbourne - 2011
This weekend, we will start being joined by a new group of readers coming in from promotion of the book by Galactic Trader software, so I will reiterate some of the ground we've discussed in the past few months.
As regulars will know, I've been putting the case that Wall Street's SP500 would have a tendency to bounce around within the range marked primarily by the 236 and 382 Fibonacci retracement levels ... and , so far, that is exactly what is happening, with Pollyanna last week reclaiming the territory just above the 236 level at 1204.
For the past couple of weekends, I've been predicting a trend change starting last week or this coming week - and with Pollyanna it started with a bounce from a Low last Monday.
Now I have to confess that my crystal ball, at least in astrological terms, is quite cloudy for the next few weeks because there are a number of major aspects which have the potential to herald the totally unexpected - and those aspects are reinforced by Pluto going Direct and Mars moving into the Fire sign, Leo.
As they go into Libra, the Sun, Mercury and Venus will set off massive astro energy - opposing Uranus, squaring Pluto and moving on to conjunct Saturn. The taste we've had so far ... European sovereign debt, bank rumours, yet another "rogue" trader ... will be just a "taste". Strange, unexpected shocks and surprises are coming!
Astrology can tell us when to expect sudden market shifts, but it's not actually very good at telling us the direction of the moves ... because sometimes markets rise into negative aspects and fall into positive ones!
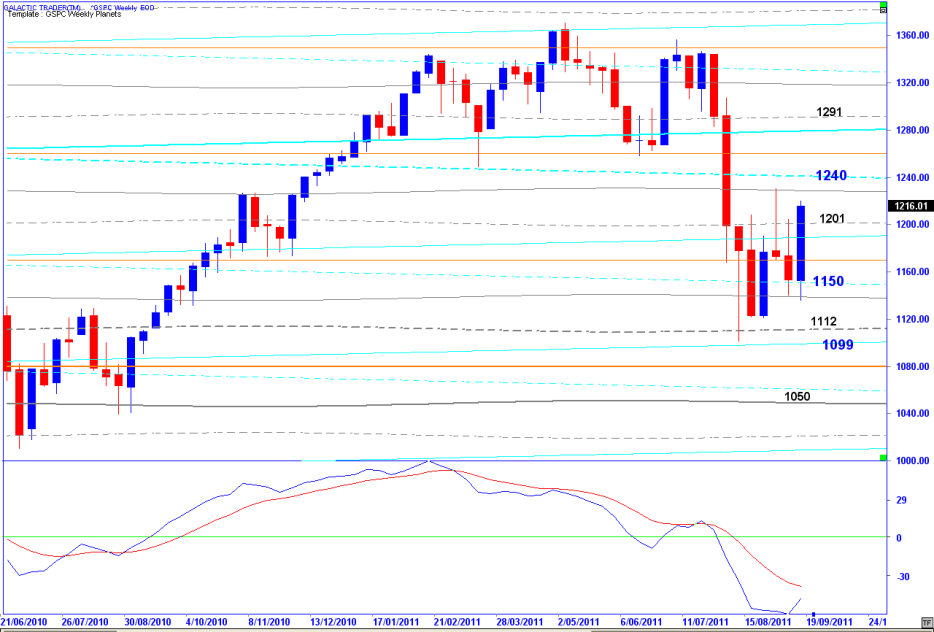
Prediction can be particularly difficult when Uranus is fired up, so let's start this weekend by reviewing the technical position. As is usual, we'll begin with Pollyanna, the SP500 - whose long-term and intermediate Idiots are still on a Sell signal, but the daily has moved to a Buy.
Prediction can be particularly difficult when Uranus is fired up, so let's start this weekend by reviewing the technical position. As is usual, we'll begin with Pollyanna, the SP500 - whose long-term and intermediate Idiots are still on a Sell signal, but the daily has moved to a Buy.
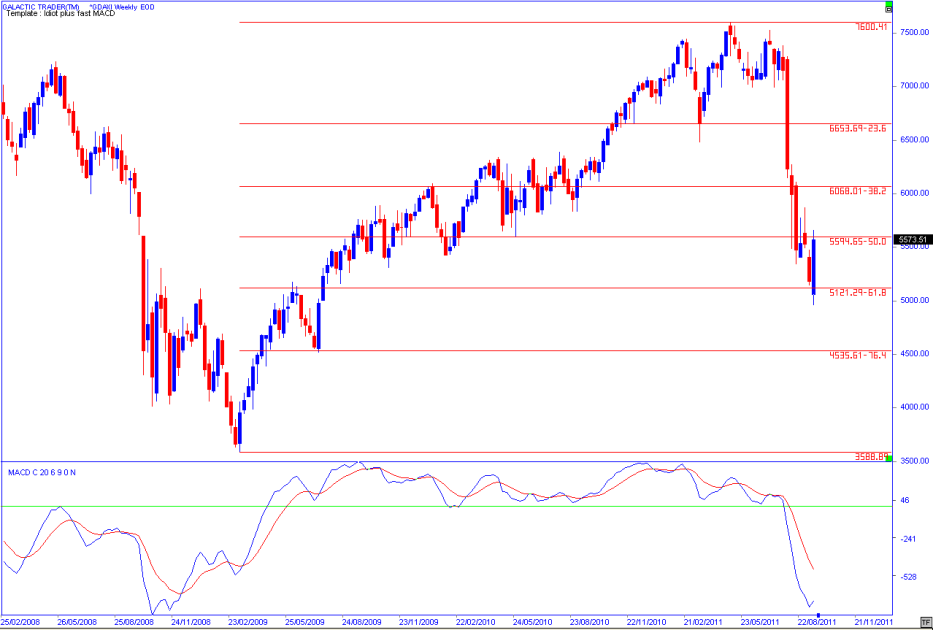
We have a significant disconnect between some of the major world indices. The pattern made by the DAX suggests that the intermediate-term countertrend higher, likely to last from 7 to 12 weeks, is only just starting.
It's a little difficult to believe that's the case with Wall Street. I think the safest strategy for dealing with all markets in these times is to pay close attention to how Prices react as they hit purely horizontal markers - either Fibonacci lines, or the weekly and long-range planetary lines.
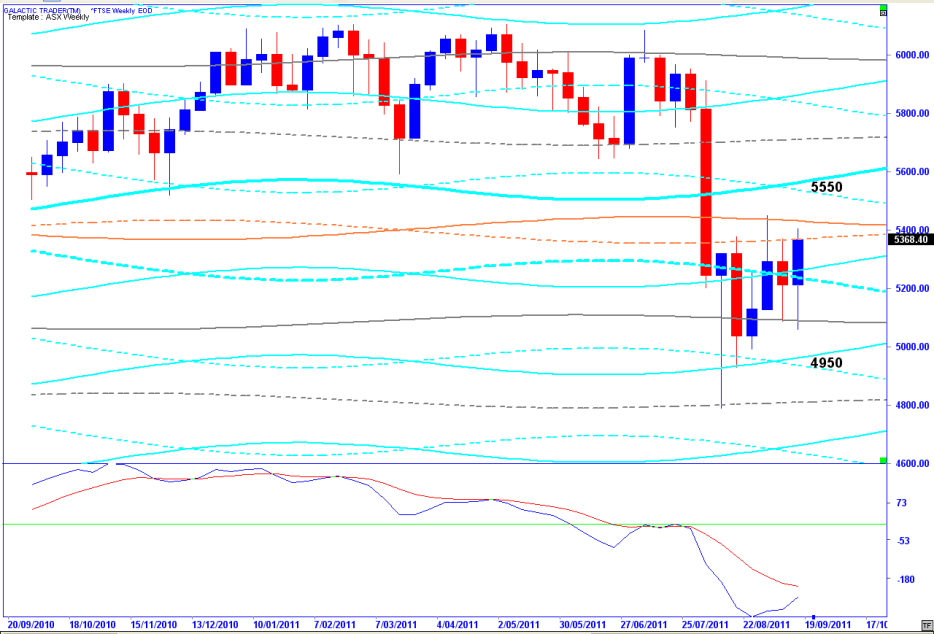
As we can see from the weekly chart for the FTSE, below, the planetary markers at least give solid and safe targets.
It's a little difficult to believe that's the case with Wall Street. I think the safest strategy for dealing with all markets in these times is to pay close attention to how Prices react as they hit purely horizontal markers - either Fibonacci lines, or the weekly and long-range planetary lines.
As we can see from the weekly chart for the FTSE, below, the planetary markers at least give solid and safe targets.
The light blue lines above belong to Saturn and those prices marked need to be adjusted for a range about 16 points either side of the stated price, as the lines are diverging.
Now, to the ASX 200 ...
Now, to the ASX 200 ...
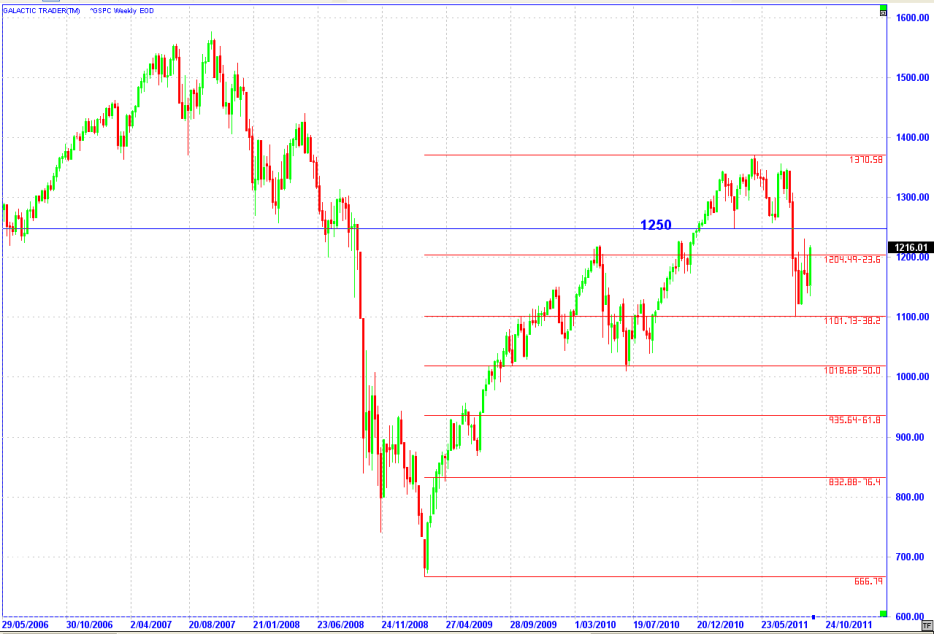
Pollyanna closed the week with her head back above the 236 Fibonacci level in what might be an attempt to challenge the distribution zone above 1250 - and convince the Bullish-minded that this correction was just a hiccup within an ongoing Bull run.
I've mentioned in previous posts the importance of 1250 as being "the last Low before the High". As a technical level, the way the index handles that Price level will be very important. The problem I have in being absolutely certain it will be rejected strongly and immediately if it's touched, is because of the Uranus energy.
It's so volatile, "normal" range targets - to the upside or downside - can be breached in a flash. However, what will NOT be breached in a flash, even by the weirdo Aqueerian, are the multi-decade Price barriers imposed by the Old Gods.
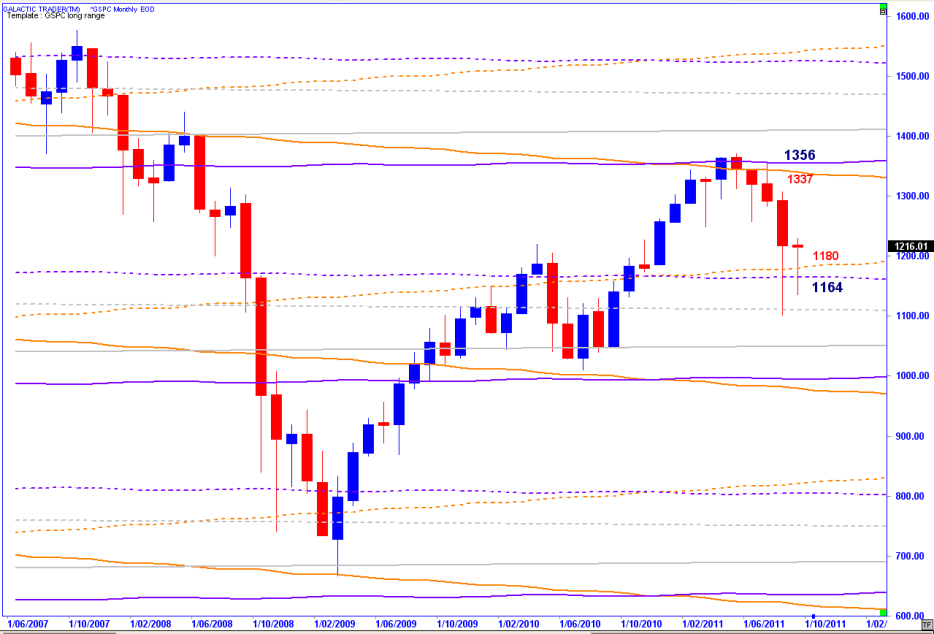
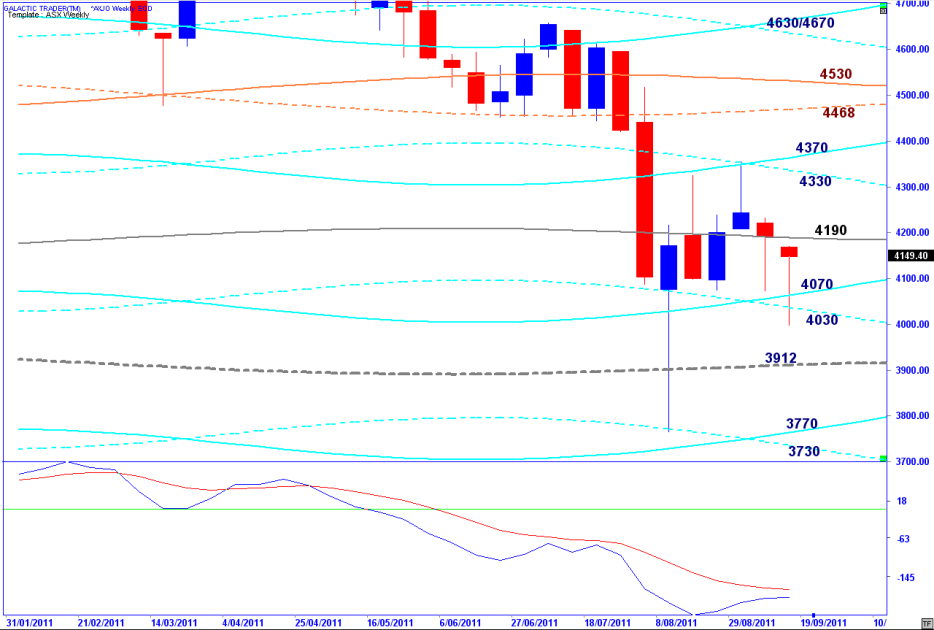
I include this chart just so we can see the maximum upside thrust available ... if I am wrong about being within a temporary correction of a newly-developing Bear market.
Now, those upside targets are "possible"; I just don't think they're probable. To find the more likely upside targets - and to remind us of the downside levels - we need to turn our attention to Pollyanna's weekly planets chart, below.
Now, those upside targets are "possible"; I just don't think they're probable. To find the more likely upside targets - and to remind us of the downside levels - we need to turn our attention to Pollyanna's weekly planets chart, below.
Though I indicated I thought that markets were more likely to "struggle down", rather than going into another panic leg, I confess I believed the most likely pattern would go a little deeper than the truncated leg we saw in most markets. Some did - like Germany's DAX.
Auntie adopted the halfway measure between Pollyanna and the DAX. It went to its lowest point since the August 9 spike, but didn't record a new Low. I'd been expecting this deep retest in the ASX to launch an intermediate-term countertrend.
Purely from a technical viewpoint, this is exactly what I'd expect to see to launch a 7 to 12 week rally. And if you notice the MACD turns in all of the charts so far, they do lend some support to that view. It is only the extreme nature of the astrological energy about to unfold that gives me cause for concern.
However, worrying about whether one has the interpretation of the astrological events right probably makes as much sense as paying too much attention to the news. One has to make a decision about whether to actually trade, or just sit around talking about it.
So, the best strategy during these times, if one is going to trade, is probably to watch the horizontal levels and grab profits fast. And that's not out-of-keeping with what one ought to do anyway once the long-term and intermediate Idiots have warned that a grizzly is sniffing around the tents.
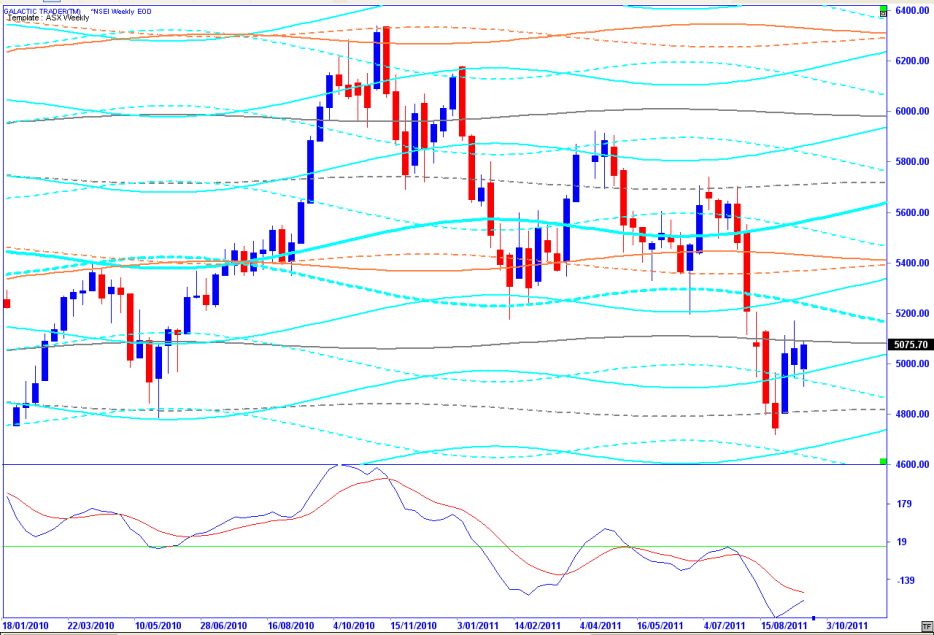
Let's take a quick look at India's Nifty before having a look at Singapore and Hong Kong, as I've been promising.
Purely from a technical viewpoint, this is exactly what I'd expect to see to launch a 7 to 12 week rally. And if you notice the MACD turns in all of the charts so far, they do lend some support to that view. It is only the extreme nature of the astrological energy about to unfold that gives me cause for concern.
However, worrying about whether one has the interpretation of the astrological events right probably makes as much sense as paying too much attention to the news. One has to make a decision about whether to actually trade, or just sit around talking about it.
So, the best strategy during these times, if one is going to trade, is probably to watch the horizontal levels and grab profits fast. And that's not out-of-keeping with what one ought to do anyway once the long-term and intermediate Idiots have warned that a grizzly is sniffing around the tents.
Let's take a quick look at India's Nifty before having a look at Singapore and Hong Kong, as I've been promising.
If we look at the left side of this chart, we can get some idea of the Nifty's general behavior if it can break above the Neptune line that has been holding back the recent advance.
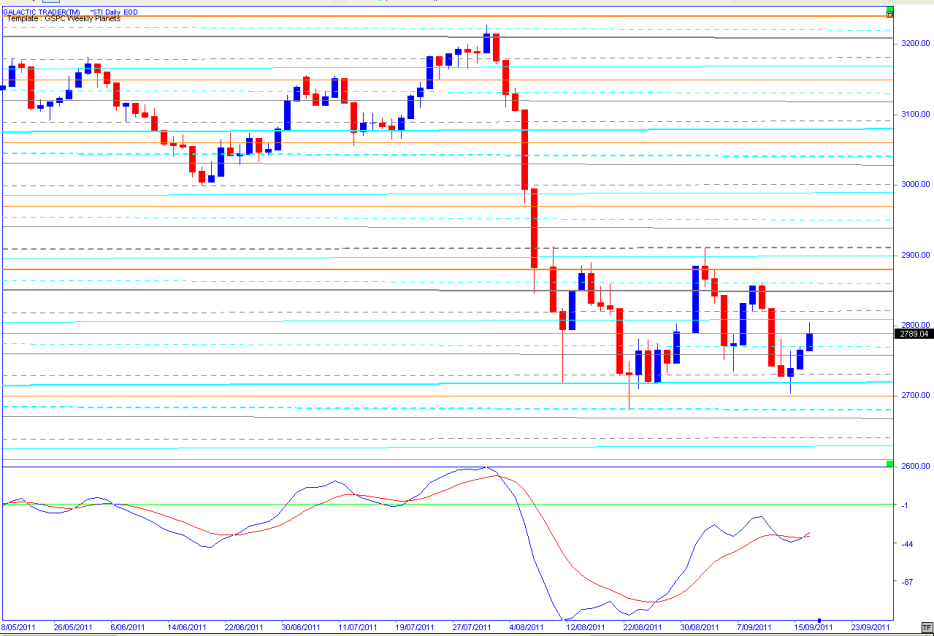
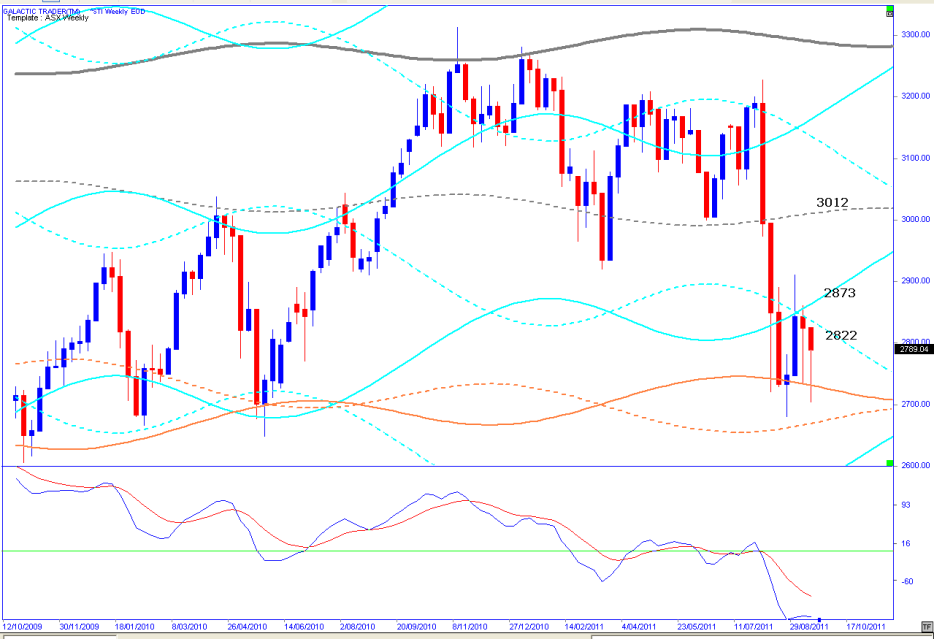
Now, let's look at Singapore and the first chart uses daily Price bars set against the weekly planets chart originally designed to help trade Pollyanna.
Now, let's look at Singapore and the first chart uses daily Price bars set against the weekly planets chart originally designed to help trade Pollyanna.
From a technical viewpoint, we can see that a significant amount of positive divergence developed in the MACD as the Straits Times Index made its low last week - another pointer that a really significant countertrend should now be getting underway.
If the STI can break above Saturn's grip, the target may be around 10% higher than last week's close (below).
If the STI can break above Saturn's grip, the target may be around 10% higher than last week's close (below).
Next we turn our attention to the Hang Seng - and dispense with the Old Gods to consult, instead, with That Dead Italian Guy.
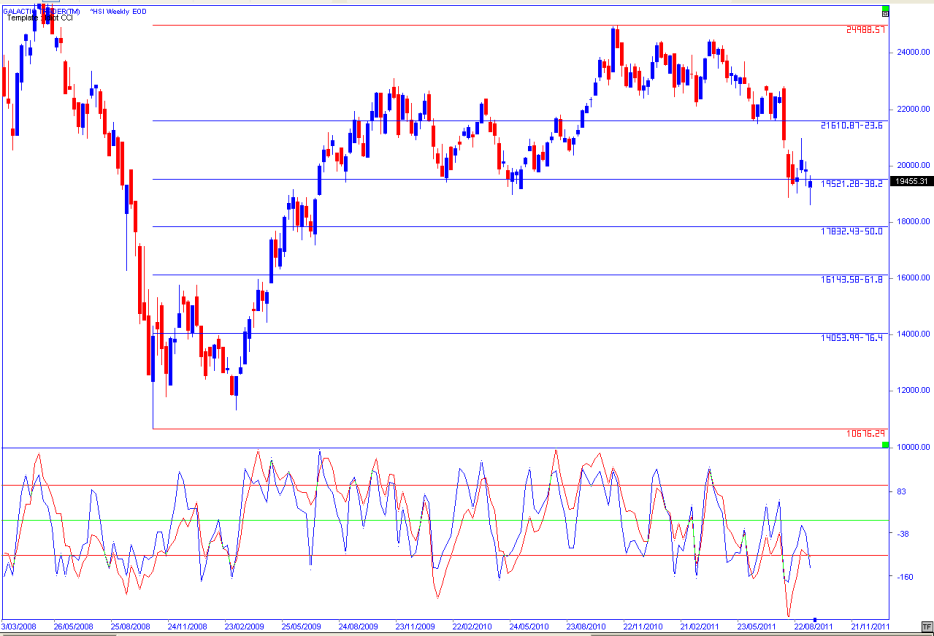
Like Germany, Hong Kong was one of the markets which actually went to a lower Low last week. There is a degree of probably temporary positive divergence in The Canaries, indicating that with a likely completed downtrend leg in place, the index could make a run north to the 236 level.
Overall then ... we have a confused picture of world markets with some holding their ground and others making new Lows. In reality, it tends to confirm the view that stock markets are, indeed, heading for a new Bear leg down in the months ahead. We may have some temporary Bullish moves immediately ahead - if we read the sudden turns as a form of Bullish divergence.
By and large, Pollyanna is - so far - doing exactly what I've been saying she was "likely" to do. The Hang Seng and the DAX are warning that Polly is a vacuous frootloop and that, eventually, reality will set in and Chicken Little will come roaring back.
The volatility and wide-range moves are likely to continue ... and the pace of the turns is likely to pick up even faster. However! The turns are likely to come at fairly predictable horizontal levels - the ones which work week-after-week and decade-after-decade, regardless of the "news" of the day.
If you don't like roller coasters, the next few weeks are likely to be challenging. More than ever, shut out the "noise", keep a close eye on your own charts and grab your profits while they're there!