Nearing the end of the 1st Bear wave
Week beginning September 12, 2011
Stock markets continue to jerk around like a break dancer on Angel Dust.
Still, there's nothing unusual in what's going on and markets remain on track for a probable near-term bottom I doubt will be much deeper than we've seen already.
Still, there's nothing unusual in what's going on and markets remain on track for a probable near-term bottom I doubt will be much deeper than we've seen already.


I'm still not seeing anything which shifts my view of what's happening and while that broad roadmap remains in play, I see no need to to befuddle my brain - or your's - with media hyperbole.
Warm regards .. and Safe trading - RA
(Disclaimer: This article is not advice or a recommendation to trade stocks; it is merely educational material.)
Copyright: Randall Ashbourne - 2011
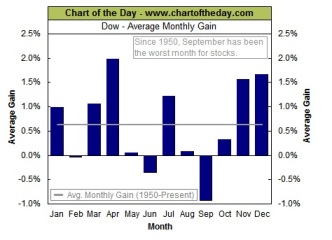
I'll leave the www.chartoftheday.com graphic up for this weekend just to remind us that September can be nasty.
However, as I indicated last weekend, there are reasons to expect a trend change coming during this week or, perhaps, in the following week.
I detailed why last weekend and at this stage I'm not going to buy into the distractions.
In a moment we'll look at some potential Price levels where this decline should stall as markets prepare for a turn higher to correct the first Bear wave that has been underway since April.
Once again, if you haven't read my big picture view, New Bull or Old Bear, please access it under the Articles button in the navigation bar.
We'll begin with a now familiar chart - the expected roadmap for Wall Street's SP500. Last weekend, Price was perched right on the red Fibonacci level - the 50% mark. And while it might all seem volatile and dangerous if we have a myopic focus on intraday squiggles, the reality is Pollyanna finished the week a whole $19.74 different from the previous weekend.
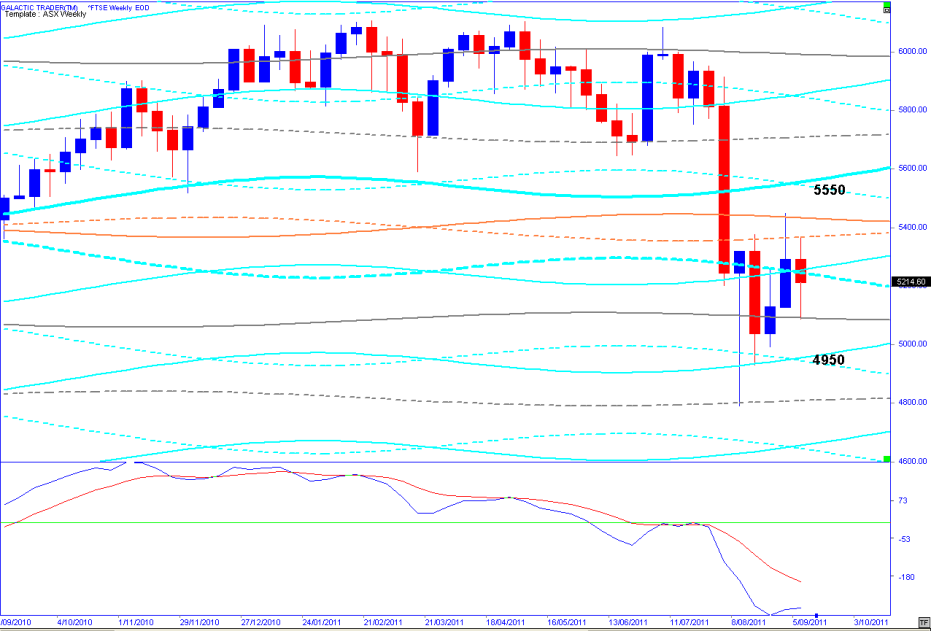
And yet again we see the Price action for the week was contained within planetary barriers. I used several charts last weekend to indicate what I believed to be the "likely" action for the FTSE - a range. To me, nothing has changed, other than the MACD is trying to turn higher, lending some preliminary credence to my expectations of a larger rally getting near.
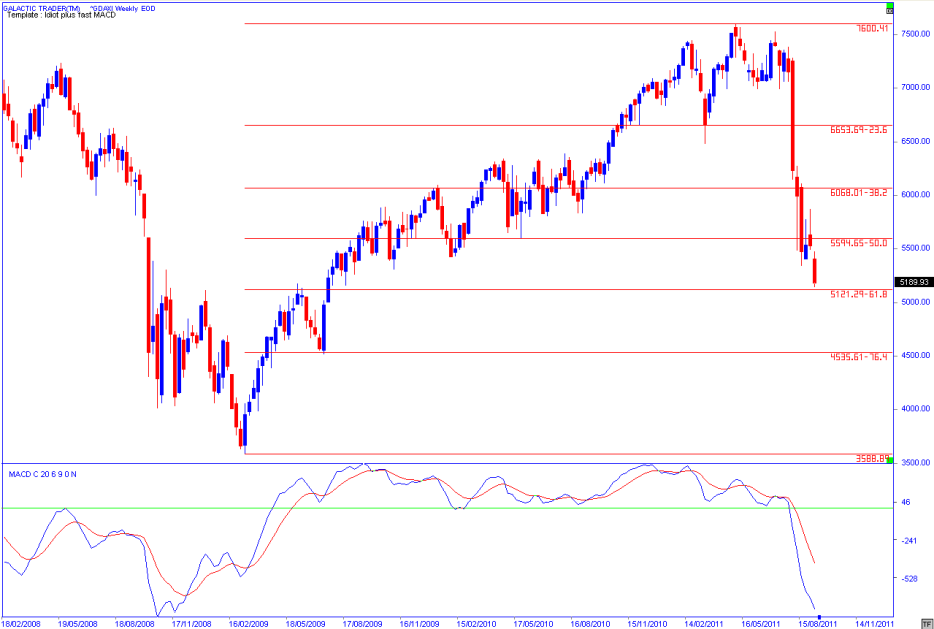
Let's take a quick look at Germany because it has already made the pattern I suspect will develop this week in most of the other indices.
Let's take a quick look at Germany because it has already made the pattern I suspect will develop this week in most of the other indices.
At this stage, the DAX has made a lower Low ... but it's not horrendously, dramatically lower and is the sort of pattern that ought to show up in the other indices; IF I am correct that this downwave should terminate this month and we'll then get a longish rally back upwards to challenge that congestion of the topping zone.
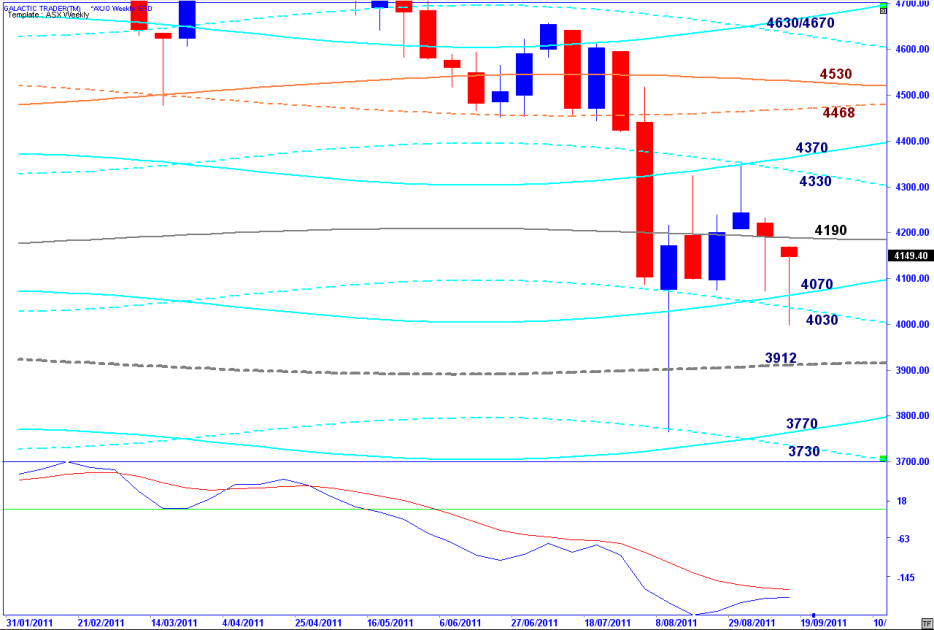
A quick look at the ASX is next.
A quick look at the ASX is next.
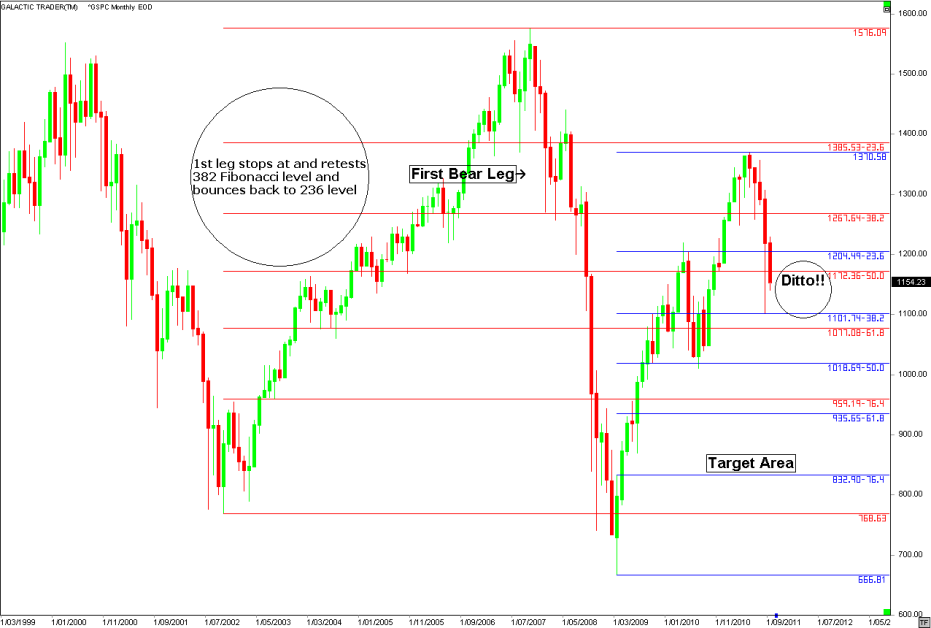
In fact, so far this is just bouncing around within that blue 236/382 layer - which is exactly what we expected. I want to stress again, by the way, that I don't expect that target area marked on the chart to be hit until next year.
I think there needs to be much more mucking about. My view is the Bear should terminate October/November of 2012 - but many other very sensible and experienced market watchers are looking at 2013 and 2014.
I think there needs to be much more mucking about. My view is the Bear should terminate October/November of 2012 - but many other very sensible and experienced market watchers are looking at 2013 and 2014.
When this current wave down is finished, I'd expect a multi-week, maybe multi-month, corrective wave upwards to try to challenge the 1250 area. In fact, it's likely Price will rise above that level as the crooks attempt to convince the suckers that the Bull is back so they can unload whatever stock they couldn't shift during that distribution period above the lower red line.
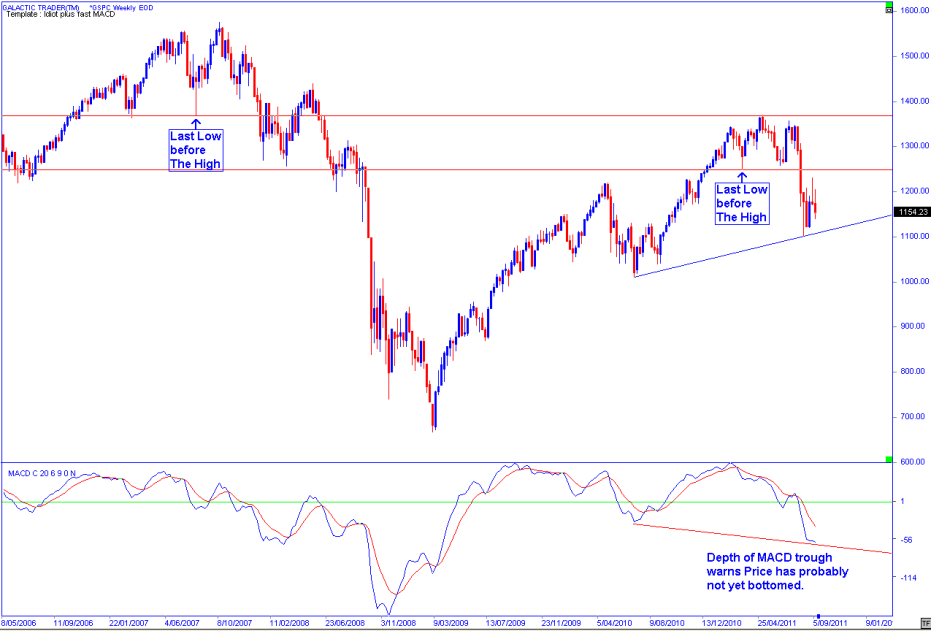
However, before that rally starts, the market needs to make a firmer bottom to launch from - and while the MACD signal is trying to turn, the depth to which it has plunged warns a lower Low is still on the cards in the near-term.
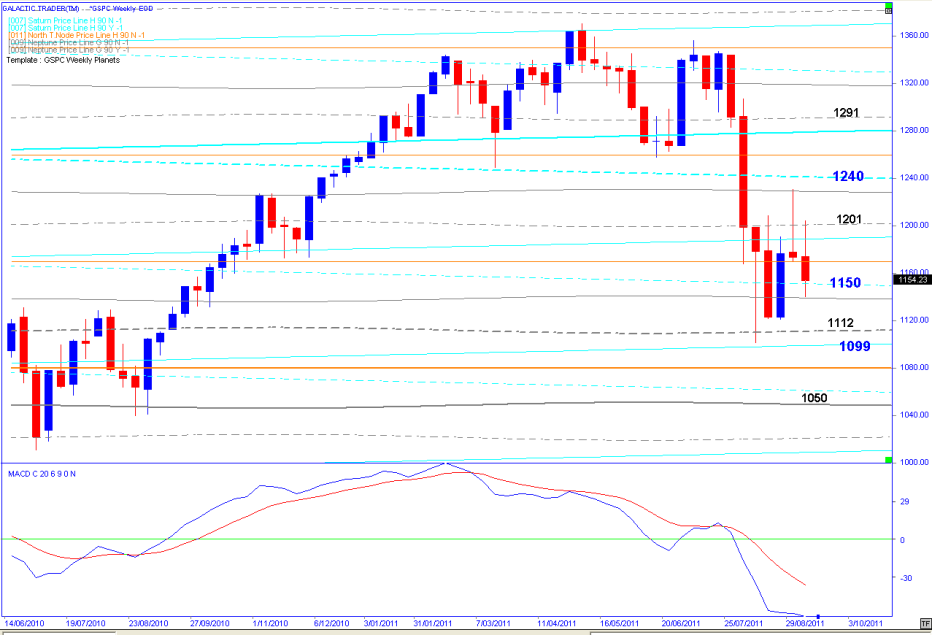
To get a fix on where that bottom might arise, we'll have a look at our Pollyanna's Weekly Planets chart, below.
However, before that rally starts, the market needs to make a firmer bottom to launch from - and while the MACD signal is trying to turn, the depth to which it has plunged warns a lower Low is still on the cards in the near-term.
To get a fix on where that bottom might arise, we'll have a look at our Pollyanna's Weekly Planets chart, below.
I indicated last weekend I thought markets were more likely to struggle down into the expected trend change timeframe, in perhaps the 3rd full week of the month, rather than go into another panic. Now, I'll allow you the action early last week seemed like more panic - especially on the DAX.
The planets chart above puts the moves into a proper context. I still think because of the size and depth of the panic move a few weeks ago, that this is not going to renew an all-out plunge and that if there is a new Low, it won't be much deeper than we've already seen.
There are strong Neptune lines in play at 1112 and 1050 - and a very strong Node line at 1080. IF the Node gets broken, I think it's likely to be recovered very quickly.
Let's take a very quick look at the FTSE.
Nothing terribly awry here, either. Now, it is possible the old bat could swoon again and trade against that spike down - similar to the DAX last week. I do wonder, though, about whether it's likely.
And the reason for that thought is this chart: -
And the reason for that thought is this chart: -
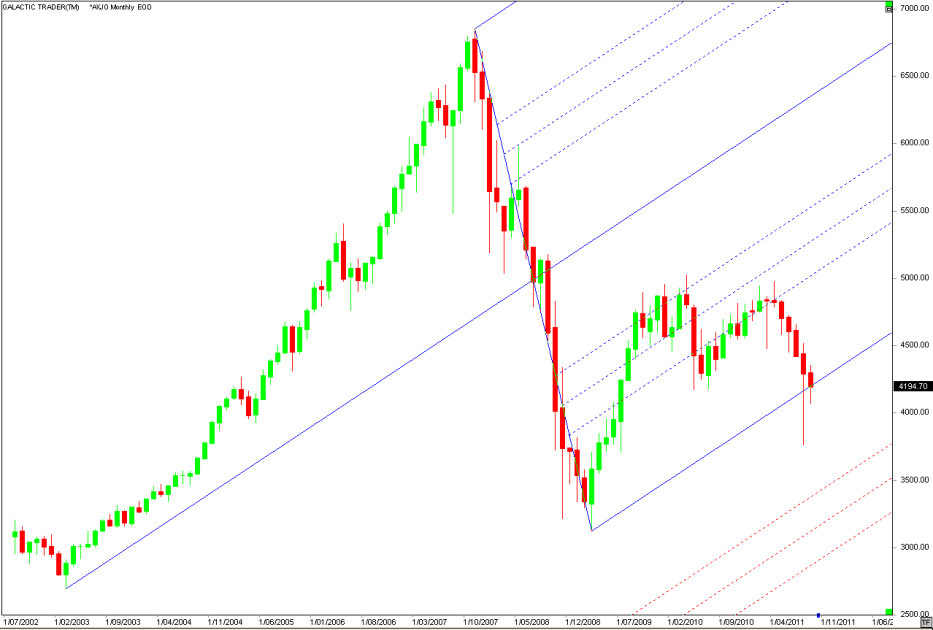
I seriously doubt Auntie is going to give up the Support of the bottom tyne of that long-range pitchfork without a real fight. It's easy to see by the way she clung to the Fibonacci levels within the angle of this fork that it's a legitimate tool - and that if she managed to cling so tenaciously to the internal levels, she's unlikely to fail more than temporarily at one of its hard edges.
Now, to India: -
Now, to India: -
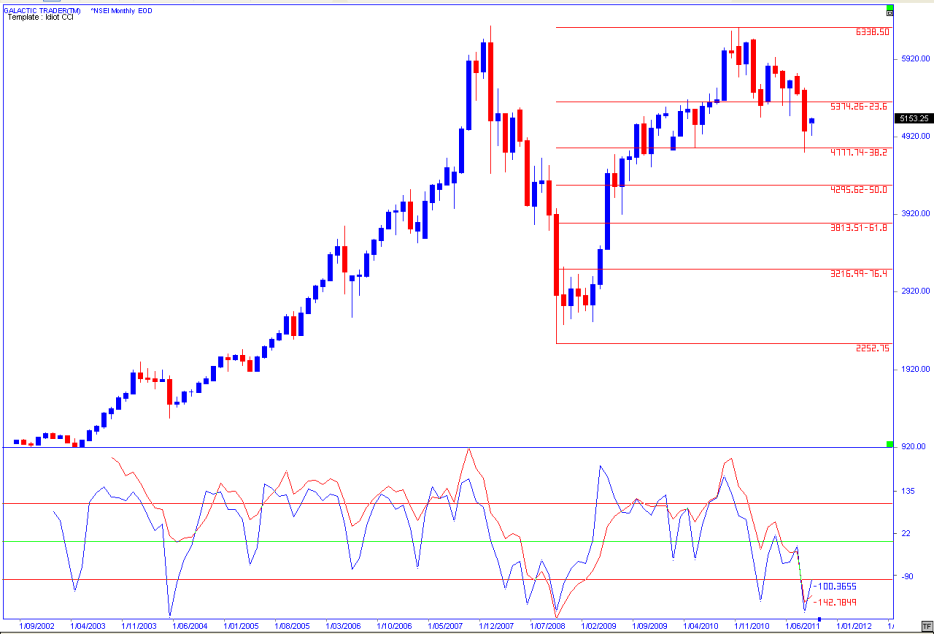
The chart above is the multi-year monthly for the Nifty50 index - and, at this stage, it looks as if it's going to do what I think Wall Street's Pollyanna is in the process of doing ... bouncing around within the 236/382 range.
But, it also looks as if the Indian market is not going to escape unscathed as we go into 2012. The Canaries have plunged as deeply as they did during the collapse in 2008, suggesting Price has a long way to fall yet.
We also see one of the other Bear market markers - the regular presence of deep red candlesticks, which appear very rarely when a market is in a sustained Bull market.
The "likely" range is 4700 to 5400 ... and in future weeks I'll do some research to try to discover the Nifty's long-range planetary markers to give you a better idea of the level the index is likely to drop to if India joins the Western markets in another Bear leg down, once the upwards corrective wave peters out.
In the meantime, though, because of its pricing levels, it tends to respond during weekly moves to the same planetary barriers as other indices in this general range.
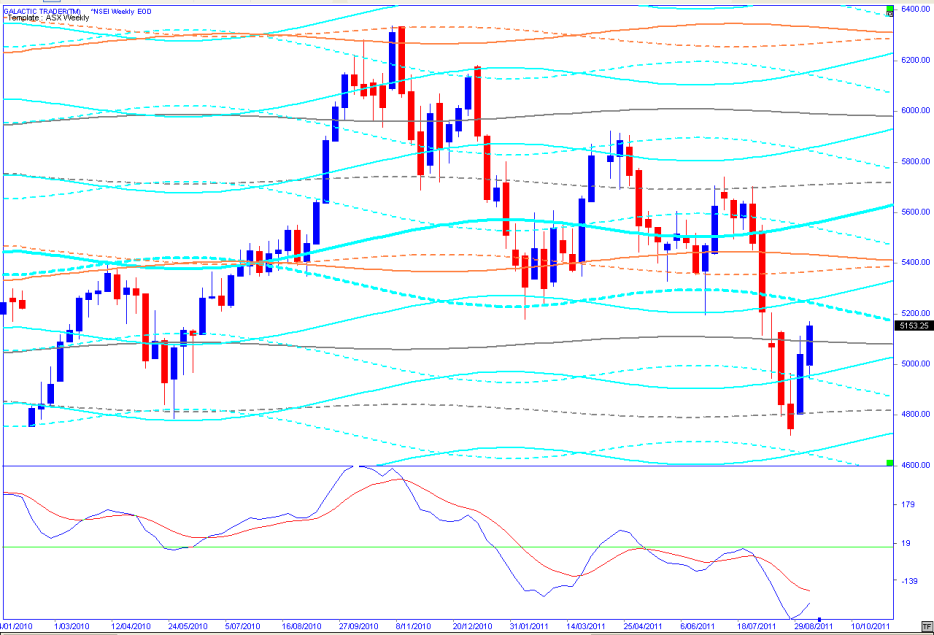
I'm not quite sure what to make of the wave structure on the Nifty; it's possible its near-term decline may be over. In "normal" circumstances, however, we'd be more certain if there were another Low with continuing divergence showing in the MACD.
And, unfortunately, Yahoo always runs late with Price bars for India and China - and I think the end-of-week data should be showing a decline on Friday down to the 5050 area.
The daily chart, in the absence of Friday's bar is, however, interesting.
And, unfortunately, Yahoo always runs late with Price bars for India and China - and I think the end-of-week data should be showing a decline on Friday down to the 5050 area.
The daily chart, in the absence of Friday's bar is, however, interesting.
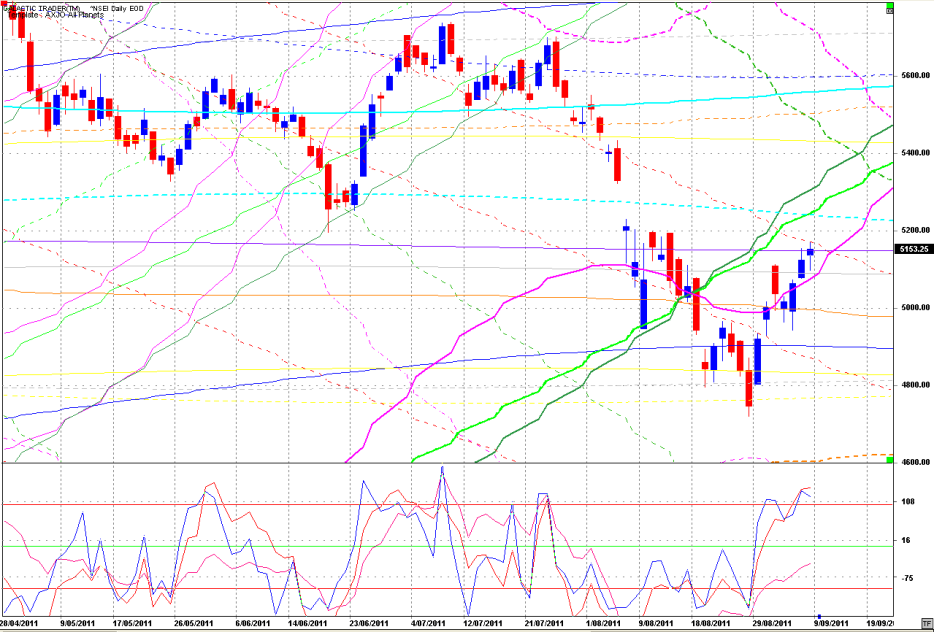
And what makes it interesting is not so much the use of one of my daily planetary price charts - but the significant jump in The Canaries, suggesting that a rally actually is underway.
The target would seem to be in the 5400s, which lines up rather neatly with a 236 recovery and the Uranus targets (orange lines) on the weekly planets chart.
I had hoped to start covering some of the Asian markets this weekend, but I'm running out of time. I may need to remake part of the website so I can do an update during the week, rather than trying to cram all of this into one weekend report. I'll try my best to look at least at Singapore and Hong Kong next weekend.