Gold ... Gone in 60 seconds
Week beginning October 7, 2013
Actually, it took a little longer than 60 seconds ... but not much longer.

Copyright: Randall Ashbourne - 2011-2013
I'll show you the chart of what happened in a moment. I suppose there are a couple of options for why it happened.
Maybe a real, living version of Uncle Scrooge woke up suddenly, off his Prozac, and had a panic attack.
Perhaps, after the last concerted attack on the gold price, the guardians of gold deposits realised they're still hundreds of tonnes short of "finding" Germany's gold.
You know, the stuff that's supposed to be stored in Fort Knox, but which Germany was told it can't actually have back for another 7 years.
Whatever the reason, it does highlight that trading gold continues to be highly dangerous in the current climate.
One doesn't wish to become too embroiled in conspiracy theories. But seriously, who dumps that much gold at 2am unless they really want to dramatically drive down the price?
In the early hours of the morning early last week, with most of Europe and the Americas asleep and with Asia just starting to stir, a mysterious "someone" dumped 800,000 ounces of gold contracts.
In the following few minutes, with human traders asleep and only the big boyz' computers keeping watch, the price of gold slumped.
In the following few minutes, with human traders asleep and only the big boyz' computers keeping watch, the price of gold slumped.


Safe trading - RA
(Disclaimer: This article is not advice or a recommendation to trade stocks; it is merely educational material.)
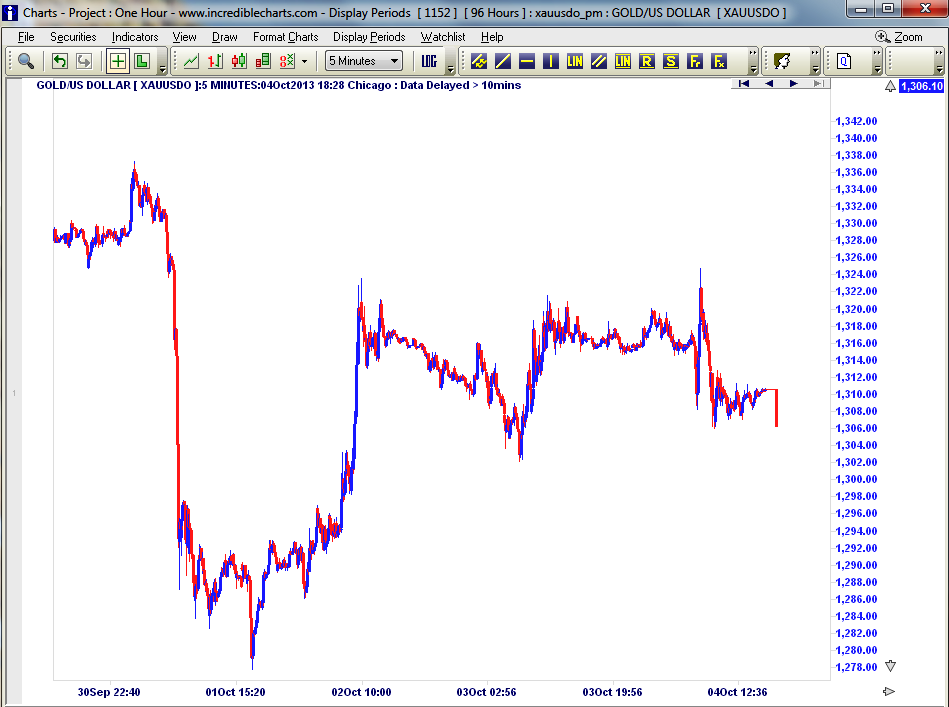
Here's a 5-minute chart of greenback gold, showing what happened. In mere minutes, gold tumbled from the 1330s to the 1280s. A lot of traders woke up that morning to find their Long gold positions had been wiped out as the plunge targeted - and triggered - their loss stops.
Unfortunately, even breaking out above that near-term downtrend angle still leaves a lot of other, overhead resistance - as we can see from the next chart.
The bounceback has been reasonably strong, which is little comfort to those who had their profits stolen by the predawn attack, but the simple fact of the charts is that it continues to leave gold in a dangerous position.
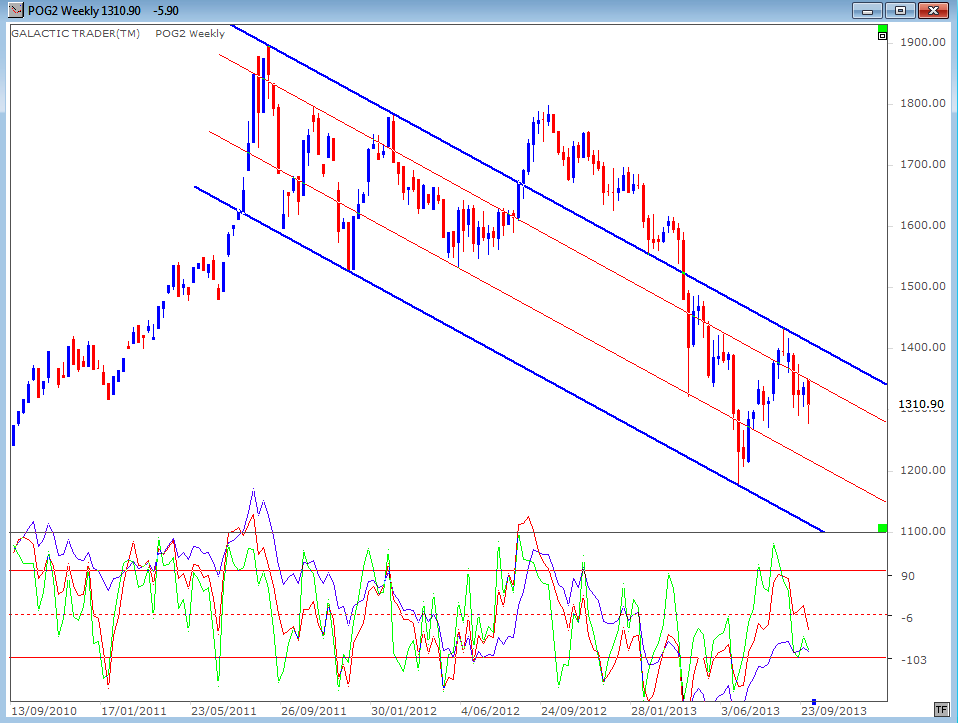
Greenback gold remains locked in the mid-range of a downtrend channel, as we can see from the weekly chart below. The state of the 3 Canaries in the oscillator panel continues to improve.
But the gold market remains dangerous - and the swings are even wilder on individual gold mining shares.
Greenback gold remains locked in the mid-range of a downtrend channel, as we can see from the weekly chart below. The state of the 3 Canaries in the oscillator panel continues to improve.
But the gold market remains dangerous - and the swings are even wilder on individual gold mining shares.
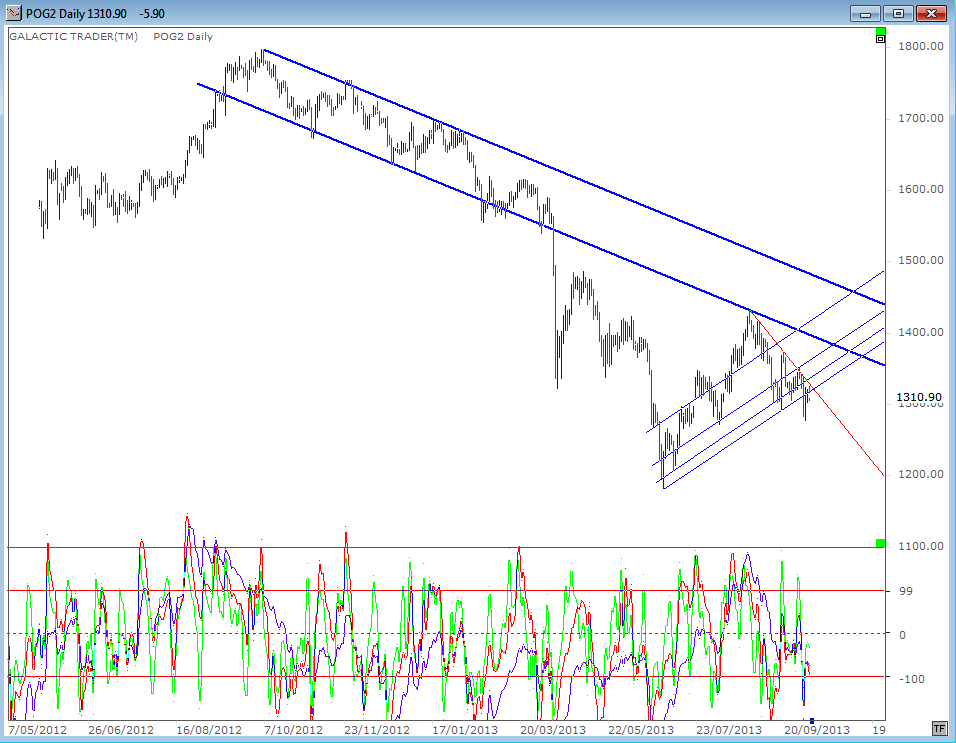
The daily chart is below and we can see the attack forced gold out of its short-term, rising trend channel, leaving the red line, near-term downtrend angle intact.
The reality is simple. Gold is still in a downtrend; attempts to "get in early" for the next rally phase leave ordinary traders vulnerable to being forced out of their positions at a loss while the big boyz' computers manipulate out-of-hours trading.
In terms of stock markets ...
We now have a small bounce into the New Moon and a potential, month-long Bradley Model trend change date last Friday or on Monday.
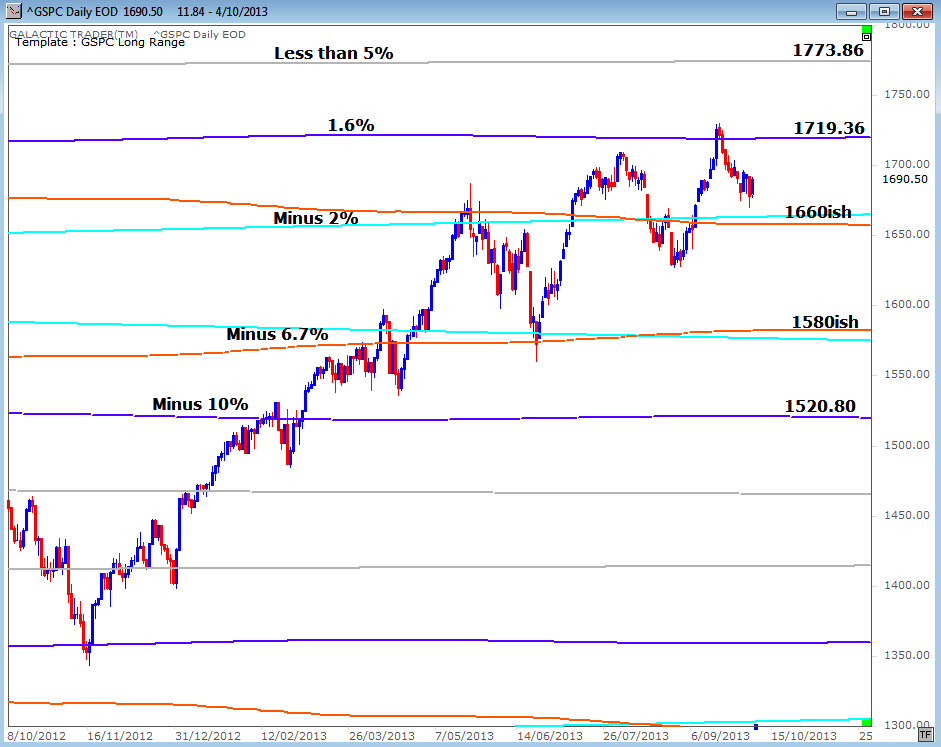
Obsessed with the daily squiggles, it's easy to lose touch with what is really going on. In late July, I ventured the opinion that markets were probably within a long-range topping process and that there was little upside left - and a lot of potential downside.
Let's revisit that chart to see what has happened since. Not much! I said at the time this chart was published: "But, the maximum reach for the final minor wave up in this rising leg is probably only 1.6% away. The peak of the entire post-2009 rally may be only 4.7% away."
In terms of stock markets ...
We now have a small bounce into the New Moon and a potential, month-long Bradley Model trend change date last Friday or on Monday.
Obsessed with the daily squiggles, it's easy to lose touch with what is really going on. In late July, I ventured the opinion that markets were probably within a long-range topping process and that there was little upside left - and a lot of potential downside.
Let's revisit that chart to see what has happened since. Not much! I said at the time this chart was published: "But, the maximum reach for the final minor wave up in this rising leg is probably only 1.6% away. The peak of the entire post-2009 rally may be only 4.7% away."
These are long-range planetary price lines for Pollyanna, the SP500. The 1719 Pluto level was broken only briefly and marginally. You'll note this rally began last year with a downside break, of similar brief time and magnitude, of the Pluto level near 1360.
We've been discussing the strong build-up of negative divergence on weekly charts. So, at this stage, I still lean towards more chance of further downside in the next few weeks.
I'll try, next weekend, to update some Weekly Planets charts for European and Asian indices.
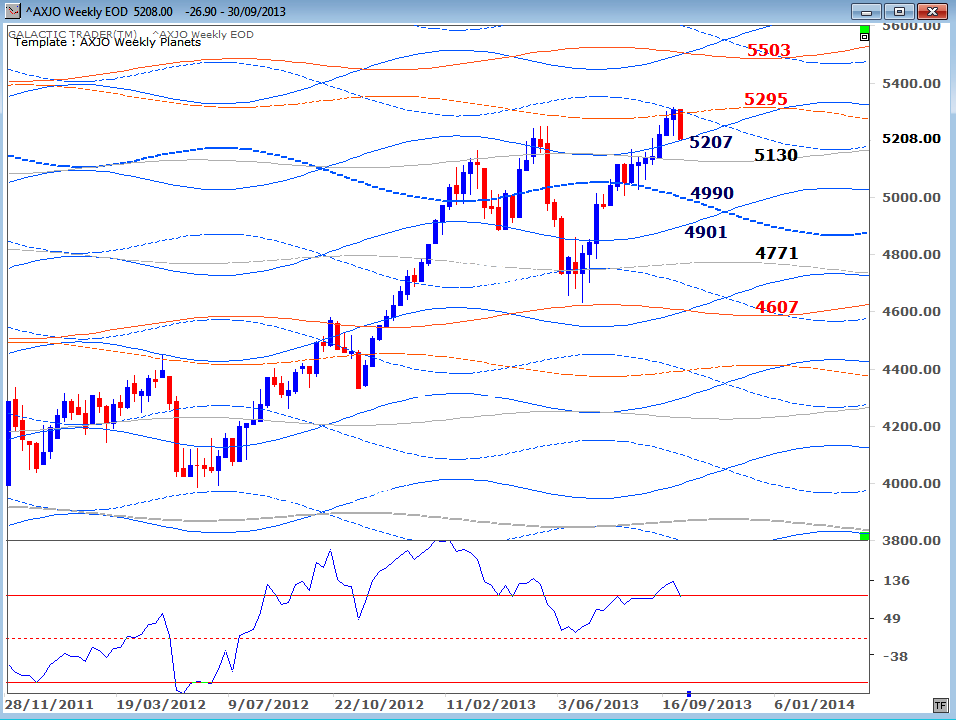
The ASX200 continues to hit the targets quite precisely
We've been discussing the strong build-up of negative divergence on weekly charts. So, at this stage, I still lean towards more chance of further downside in the next few weeks.
I'll try, next weekend, to update some Weekly Planets charts for European and Asian indices.
The ASX200 continues to hit the targets quite precisely