I may be wrong, but I'm not confused
Week beginning October 3, 2011
Volatile markets tend to jerk people around - emotionally, psychologically and financially.
And last week was volatile. The ASX 200 dropped 1%, jumped 3.6% and closed the week 2.6% higher while the SP500 went on a New Moon rip to 1195 before diving again ... to finish the week a whopping $5 different from the previous week's close.
And last week was volatile. The ASX 200 dropped 1%, jumped 3.6% and closed the week 2.6% higher while the SP500 went on a New Moon rip to 1195 before diving again ... to finish the week a whopping $5 different from the previous week's close.


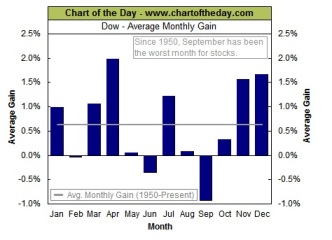
So, for starters, let's remind ourselves of the chart above - courtesy of www.chartoftheday.com. On a statistical basis, September is the worst-performing month of the year for stock markets ... and tends to be followed by "the Santa Claus rally" into January.
Warm regards .. and Safe trading - RA
(Disclaimer: This article is not advice or a recommendation to trade stocks; it is merely educational material.)
Copyright: Randall Ashbourne - 2011
As we enter a new month and the 4th quarter of 2011, I want to go over some old ground, because nothing - nada, zilch, zip - has changed since mid-August in my view of where we are within the bigger picture.
That's when I posted the New Bull or Old Bear piece under the Articles button and painted a view of what was likely following the early August nosedive.
At the end of August, the heading on The Eye of Ra report was: Probability No 1 ... We are now in a range, with the intro: The probability is that markets are now embarked on a range-trading period designed to eat Time rather than Price ... and if the past is any guide, it could continue for months.
And here we are, several weeks later, STILL locked in the range. Many people are getting confused and befuddled by the daily jerks and wonder how I can be predicting a final rally.
At the moment, because we have probably started another large-scale Bear move, some analysts are anticipating an October crash. Now, that's possible. Personally, I don't think it's probable. Last weekend, I spent some time going through a technical condition known as "trading against a spike" as further evidence for why I believed:
"Not that the volatility and panicky price swings are finished just yet. But, the way things have gone, we should now be getting close to the start of a multi-week, perhaps even multi-month, corrective rally phase."
With last week and the end-of-quarter now gone, it's clear the volatility and panicky price swings were not finished just yet. But, I think we're now even closer to the start of what ought to be a significant rally.
And I stress: It is likely to be the final rally before a very steep decline next year. I received an email last week from one reader who believed my expectation of a rally "doesn't make sense". So, just in case anyone else has failed to understand the rationale, I'll recap the big picture and present the evidence for why I think a rally is more probable than another panic ... in the near-term only!
And we will begin the analysis with one of the charts I used for the New Bull or Old Bear article. If you haven't read it, please do so because one of the primary lessons of The Idiot & The Moon is that one needs to be certain of what the forest looks like before getting besotted with the veins on one leaf of a single tree.
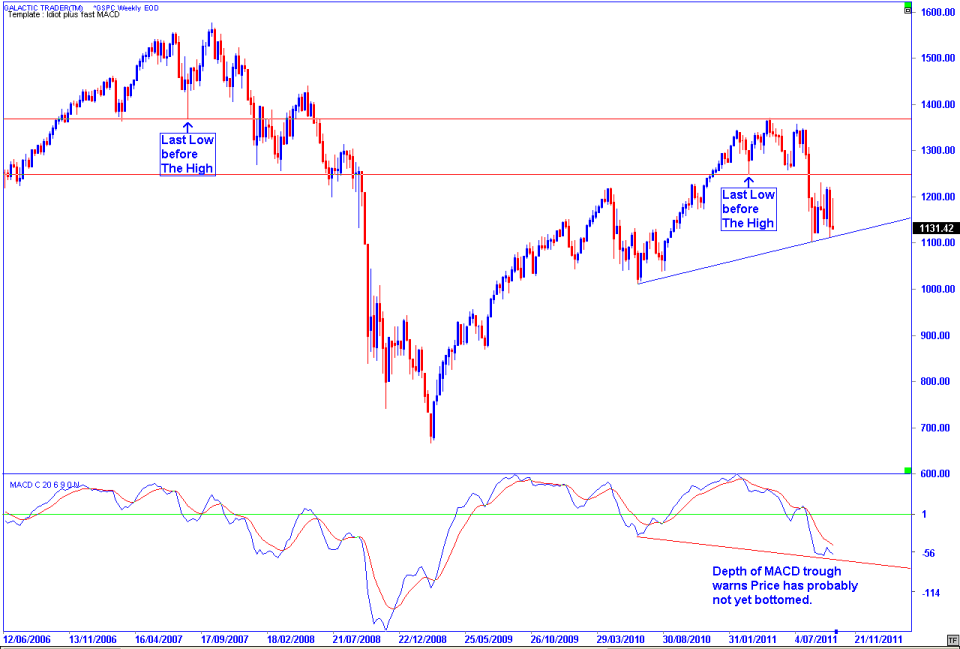
I indicated back then that I thought we were nearing the end of the first Bear wave, but also made the point on this chart that the depth of the MACD trough warned that Price had probably not yet bottomed.
And I cannot guarantee that's still not the case! There is a very small divergence trying to manifest in the MACD and Price itself has not broken below the trendline. There is still a chance, and a relatively strong chance, that the SP500 could yet drop into the Full Moon for a final exhaustion of this first Bear wave, before (probably) rebounding to make a run at regaining the "last low before the high".
Overall, though, I still think we're in the same sort of chart pattern we were in as the 2008/2009 Bear started to bite.
In the simplest of terms, The Idiot is on a Sell signal across all three timeframes on the SP500. If you want to trade safely and always protect your capital, you should have been out of Long positions ages ago - especially since the July 25 Eye of Ra carried the heading: Potential end to the Bull run this week ... that is, before markets crashed.
I do not expect, at this stage, that the Sell signal on the monthly Idiot will be undone before late next year or some time in 2013.
However, the point I have been trying to make since the first nosedive into August and have reiterated in this weekend report, is that Bear markets tend to follow a timeworn script ... and the script calls for Chicken Little to exit the stage and Pollyanna to come back for a final goo-goo, gushing display of mindless optimism.
And The Spooky Stuff says that reappearance could arrive early in the coming week when a Mars square to Jupiter ignites a particular set of astrolological symbols.
Mars is "drive", Jupiter is "expansion", the square aspect is high-energy. In the current conditions, it could manifest as a drive to dive. Or it could be a rebound that runs longer and stronger than most expect. To be honest, I simply don't know. What I do know is that when Mars ignites Jupiter, large price swings occur.
The Moods of The Moon says: We jumped into a New Moon high (last Tuesday on Wall Street) and are following the statistical pattern, dramatically enhanced when The Idiot has moved to Bear mode, of a drop into the Full Moon on October 11.
So, the safe bet ... the statistical bet ... is for another sudden drop. If it happens, I really expect no worse than a marginal new low.
Personally, I'm not at all sure that drop is going to happen. I'd be more certain of an optimistic turnaround from Mars/Jupiter if the divergence in the MACD were as clear-cut as it seems to be in The Canaries, especially since the latter tends to give early signals.
What I am fairly certain of is that October is far more likely to finish higher than September closed - and that may also be the case for November and December. Many of the world indices, including those in Europe, appear to have made their bottoms for this first Bear wave.
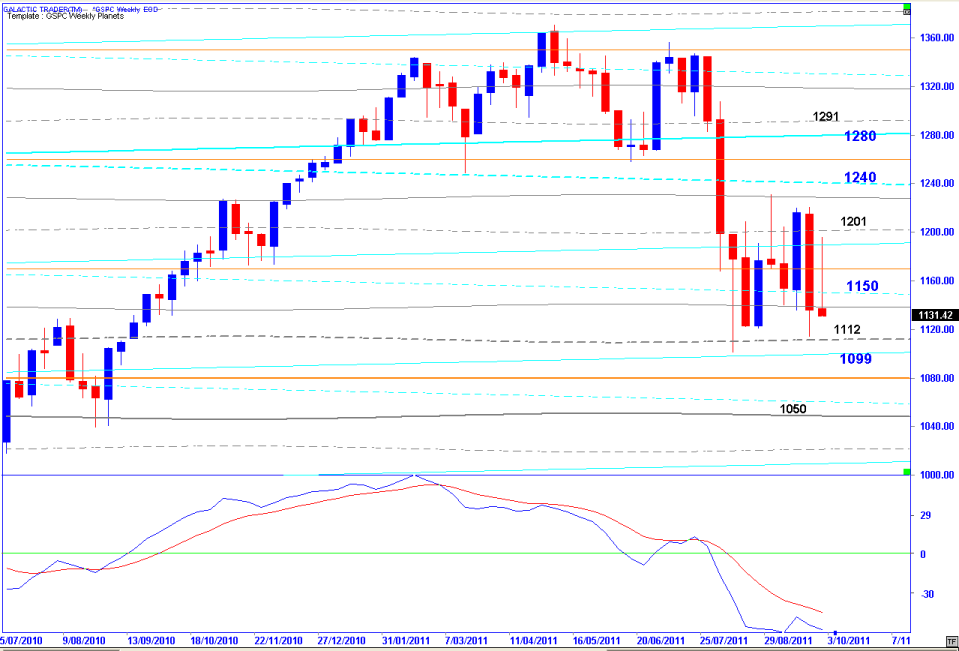
I think the next Bear wave will be particularly nasty and its target zone is marked on the first chart in this weekend's report. Below is my Weekly Planets Chart for Pollyanna. I've been indicating my personal thoughts that the 1112 should hold - and if it's broken, the most likely targets are 1099 or 1050.
And I cannot guarantee that's still not the case! There is a very small divergence trying to manifest in the MACD and Price itself has not broken below the trendline. There is still a chance, and a relatively strong chance, that the SP500 could yet drop into the Full Moon for a final exhaustion of this first Bear wave, before (probably) rebounding to make a run at regaining the "last low before the high".
Overall, though, I still think we're in the same sort of chart pattern we were in as the 2008/2009 Bear started to bite.
In the simplest of terms, The Idiot is on a Sell signal across all three timeframes on the SP500. If you want to trade safely and always protect your capital, you should have been out of Long positions ages ago - especially since the July 25 Eye of Ra carried the heading: Potential end to the Bull run this week ... that is, before markets crashed.
I do not expect, at this stage, that the Sell signal on the monthly Idiot will be undone before late next year or some time in 2013.
However, the point I have been trying to make since the first nosedive into August and have reiterated in this weekend report, is that Bear markets tend to follow a timeworn script ... and the script calls for Chicken Little to exit the stage and Pollyanna to come back for a final goo-goo, gushing display of mindless optimism.
And The Spooky Stuff says that reappearance could arrive early in the coming week when a Mars square to Jupiter ignites a particular set of astrolological symbols.
Mars is "drive", Jupiter is "expansion", the square aspect is high-energy. In the current conditions, it could manifest as a drive to dive. Or it could be a rebound that runs longer and stronger than most expect. To be honest, I simply don't know. What I do know is that when Mars ignites Jupiter, large price swings occur.
The Moods of The Moon says: We jumped into a New Moon high (last Tuesday on Wall Street) and are following the statistical pattern, dramatically enhanced when The Idiot has moved to Bear mode, of a drop into the Full Moon on October 11.
So, the safe bet ... the statistical bet ... is for another sudden drop. If it happens, I really expect no worse than a marginal new low.
Personally, I'm not at all sure that drop is going to happen. I'd be more certain of an optimistic turnaround from Mars/Jupiter if the divergence in the MACD were as clear-cut as it seems to be in The Canaries, especially since the latter tends to give early signals.
What I am fairly certain of is that October is far more likely to finish higher than September closed - and that may also be the case for November and December. Many of the world indices, including those in Europe, appear to have made their bottoms for this first Bear wave.
I think the next Bear wave will be particularly nasty and its target zone is marked on the first chart in this weekend's report. Below is my Weekly Planets Chart for Pollyanna. I've been indicating my personal thoughts that the 1112 should hold - and if it's broken, the most likely targets are 1099 or 1050.
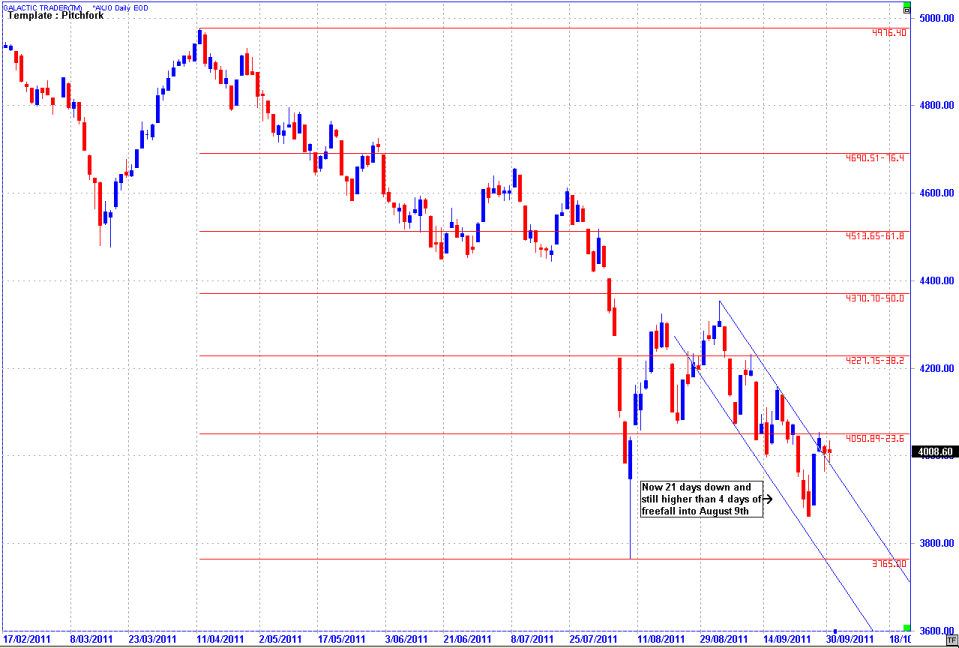
One of the reasons I'm just a tad unconvinced that Wall Street isn't playing a game with us is last week's relative outperformance by the ASX 200.
I used this chart last week to illustrate the technique of trading against a spike - and, at that stage, it was 17 days down to NOT hit the low caused by the spike.
I used this chart last week to illustrate the technique of trading against a spike - and, at that stage, it was 17 days down to NOT hit the low caused by the spike.
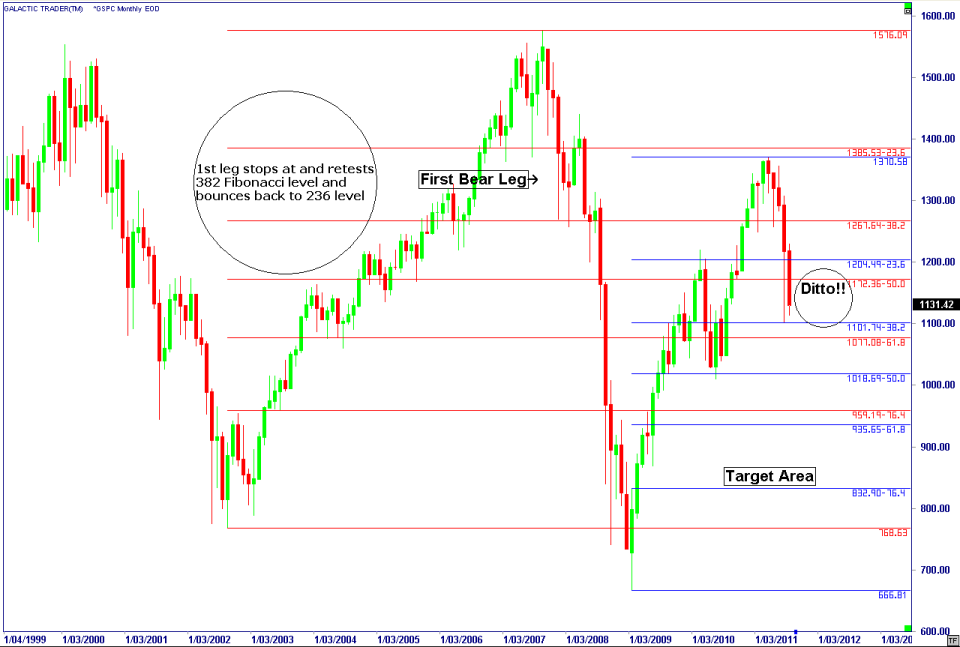
This is the multi-year view of the SP500 and I believe we have now embarked on a new Bear market whose next target is the 800 levels.
But, I have been predicting since August that what should happen, even if the Bear scenario is correct, is for a lengthy range-trading Time phase within the Price levels marked by the 236 and 382 Fibonacci retracement levels. The first drop into the 2009 Bear bottom did exactly that ... the red Fibo zone. The current market appears to be repeating the performance within the blue Fibo zone.
In accordance with the statistical tendency of markets, as shown in The Chart of the Day graphic above, September was a bad month. However, in terms of what my analysis has been saying was "likely", it was an "inside" month that has "struggled" down to trade against the early August spike.
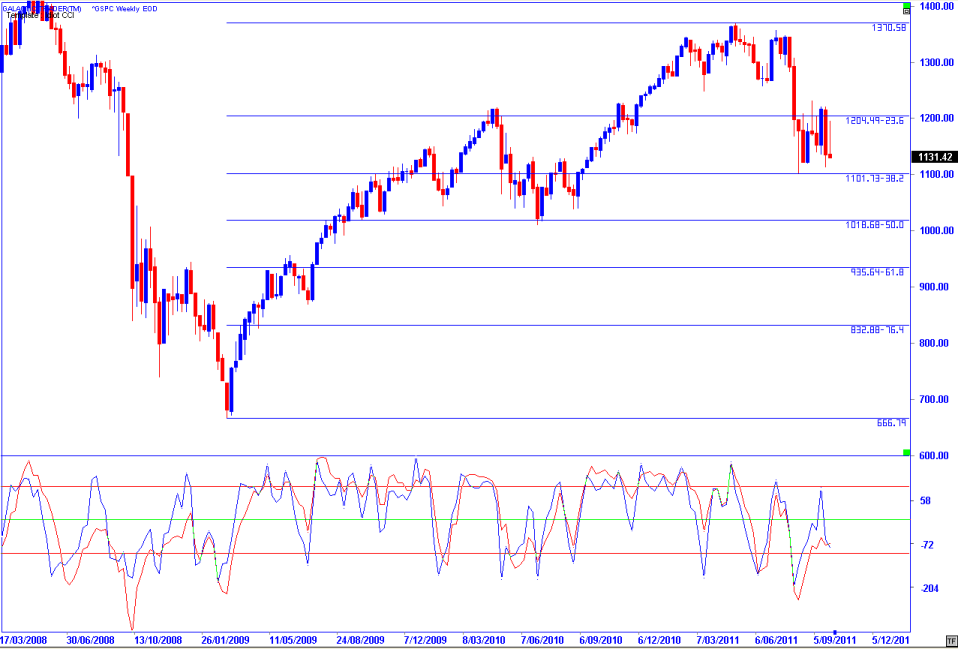
We can see that even more clearly using a weekly chart.
But, I have been predicting since August that what should happen, even if the Bear scenario is correct, is for a lengthy range-trading Time phase within the Price levels marked by the 236 and 382 Fibonacci retracement levels. The first drop into the 2009 Bear bottom did exactly that ... the red Fibo zone. The current market appears to be repeating the performance within the blue Fibo zone.
In accordance with the statistical tendency of markets, as shown in The Chart of the Day graphic above, September was a bad month. However, in terms of what my analysis has been saying was "likely", it was an "inside" month that has "struggled" down to trade against the early August spike.
We can see that even more clearly using a weekly chart.
It's now 7 weeks later and the SP500 still has not gone as low as it did during the first Bear plunge.
"The probability is that markets are now embarked on a range-trading period designed to eat Time rather than Price ... and if the past is any guide, it could continue for months."
That's what I said weeks ago should happen and if you're not caught up and jerked around by the wild, daily ranges, it's exactly what is happening. Virtually ALL of the price action for the past 2 months has been constrained by the 236/382 Fibonacci levels.
While the monthly chart has closed lower - right in line with the statistical average for September - the weekly just recorded an inside bar and the oscillator is trying to put in a display of positive divergence by recording a higher trough above the oversold line.
I'll repeat what I said in the heading to this weeks' report: I may be wrong, but I'm not confused! Yes, it is possible that markets will plunge in an October crash. I could be entirely wrong that the worst that's likely to happen is a marginal new low in the SP500.
But! While markets continue to behave in the manner I said was "likely", I'm not about to do the stupid Pollyanna/Chicken Little routine, reacting to every gyration and mood swing caused by the goo-goo/awoe!alas! crowd.
Let's turn our attention now to a chart I used for the September 12 report.
Now, it's quite true that Auntie ASX will have to react on Monday to Friday's plunge on Wall Street. However, this is my home market and, over the years, I've observed Auntie has a tendency to act ahead of Wall Street. When this market wants to go somewhere, it has a habit of moving relentlessly, regardless of Pollyanna's feints and faints.
It is very unlike Auntie to hold up going into a weekend if the old bat thinks Pollyanna is making a real move down, rather than just playing computer games to shaft the Bulls while preparing to shaft the Bears immediately ahead.
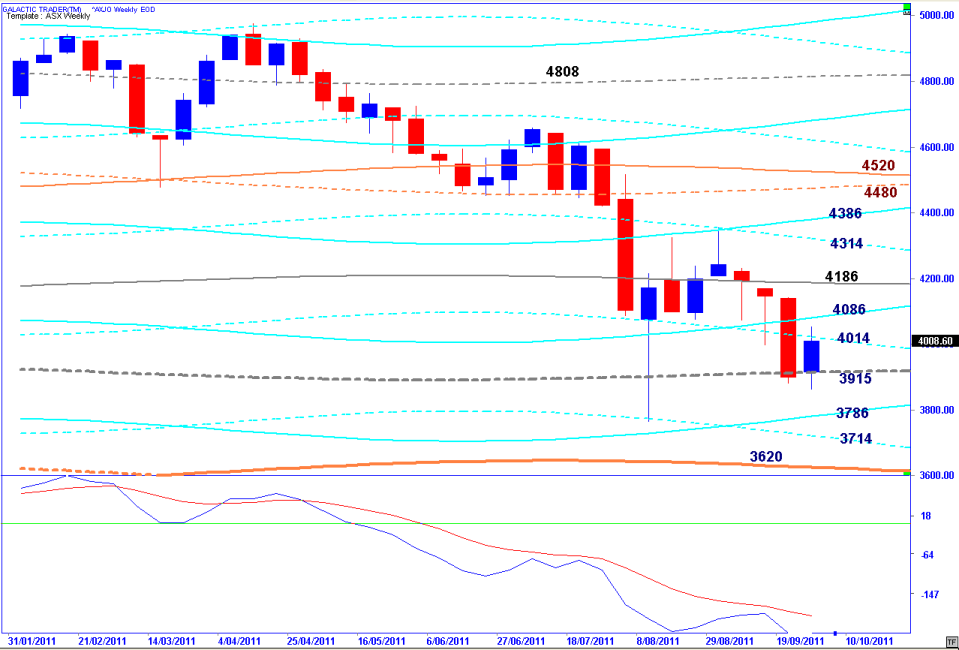
It is relatively obvious from the second chart in this report - the two months of sideways ranging on Pollyanna - that the first stage of the downtrend has been losing momentum. And it is really obvious from the chart of Auntie immediately above. Markets at least appear to have moved out of panic mode - despite the news reactions and the daily volatility.
It is very unlike Auntie to hold up going into a weekend if the old bat thinks Pollyanna is making a real move down, rather than just playing computer games to shaft the Bulls while preparing to shaft the Bears immediately ahead.
It is relatively obvious from the second chart in this report - the two months of sideways ranging on Pollyanna - that the first stage of the downtrend has been losing momentum. And it is really obvious from the chart of Auntie immediately above. Markets at least appear to have moved out of panic mode - despite the news reactions and the daily volatility.
Auntie's Weekly Planets chart is above. It wasn't quite an inside week since the old bat had a bad day last Monday. If you've read the Old Gods chapter of The Idiot & The Moon, you'll recognise the significance of that 3915 level and why the old bat will fight to hold it ... and she's making a valiant effort so far.
Anyway, that brings us to the end of another Eye of Ra. I know that to regular readers it may seem like I've been going over the same ground for several weeks. Eh! I have. Markets just aren't as exciting, as wild, as unpredictable as they seem if you spend your life glued to the gossip of talking heads on TV and the squiggling worms of intraday charts.
As y'know from the book, I don't find getting lost in the ups and downs of the news cycle useful, engaging, or even all that interesting. And I certainly don't find it a reliable source of knowledge!
I'm sorry I can't give you a guarantee about what will happen with Mars square Jupiter. I think it's probably more likely to be drive, rather than dive ... even though that opinion is completely contradicted by what the statistics say should happen NM-FM in an Idiot Bear phase.
I am, though, pretty sure we've moved out of panic mode and that the intermediate-term is moving higher. And I'm also pretty sure, on the evidence to hand so far, that stock markets have peaked and that, overall, the Bear is back in town.