Bounceback facing a hurdle this week
Week beginning October 24, 2011
Gushing with Pollyanna goo-goo/ga-ga enthusiasm, the SP500 bounced to a new breakaway High on Friday.
Since Chicken Little was kicked offstage 14 trading days ago, Pollyanna has sashayed her way back to reclaim a little more than 50% of what we suspect was merely the first Bear leg downturn from May 2 to October 4.
Since Chicken Little was kicked offstage 14 trading days ago, Pollyanna has sashayed her way back to reclaim a little more than 50% of what we suspect was merely the first Bear leg downturn from May 2 to October 4.


Warm regards .. and Safe trading - RA
(Disclaimer: This article is not advice or a recommendation to trade stocks; it is merely educational material.)
Copyright: Randall Ashbourne - 2011
And the entire melodrama - literally a form of Greek tragedy - has continued to follow that timeworn, old script I outlined in August.
So, my Virgo Moon, Miss Prissy, feels it necessary to remonstrate with you once again. I know, I know. She's a nagging bitch. Hey! At least you don't have to live with her! Nevertheless, Miss Prissy wants to remind you that too much TV talk show is not information, knowledge, or wisdom and that if you're being jerked around, then you're just not paying attention to your charts.
The bounceback is now getting close to the Price territory we had mapped out as a likely target zone - and has recovered the lost ground very quickly.
Since we are now on short countdown to the statistical high period of a New Moon - and with a Sun opposition to Jupiter and a Jupiter trine to Pluto - the rally is now coming up against its first real hurdle.
You know my view. This should be a rally of cyclical length and I do not expect Chicken Little to come roaring back with the next leg of the Bear wave downwards until there has been at least one or two attempts at Price making its way back inside the lower levels of the previous congestion.
So far, it's all still running to script.
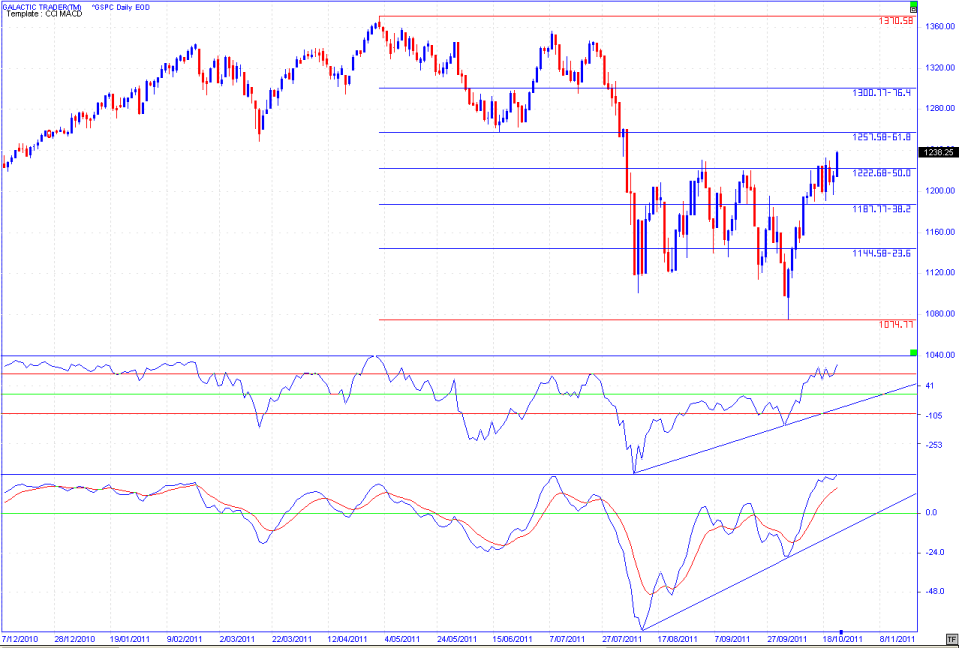
Let's start the analysis this weekend with something unusual - a look at the daily chart, rather than one of the normal, forest maps.
Last weekend, I said: "I actually don't think there's much danger. I expect the coming week to be relatively quiet in terms of Price moves ... simply to consolidate the strong gains made since the thrust from the bottom."
And that's what Miss Prissy means when she advises against getting caught up in the intraday squiggles and the breathless news "analysis" from the bimbos and himbos.
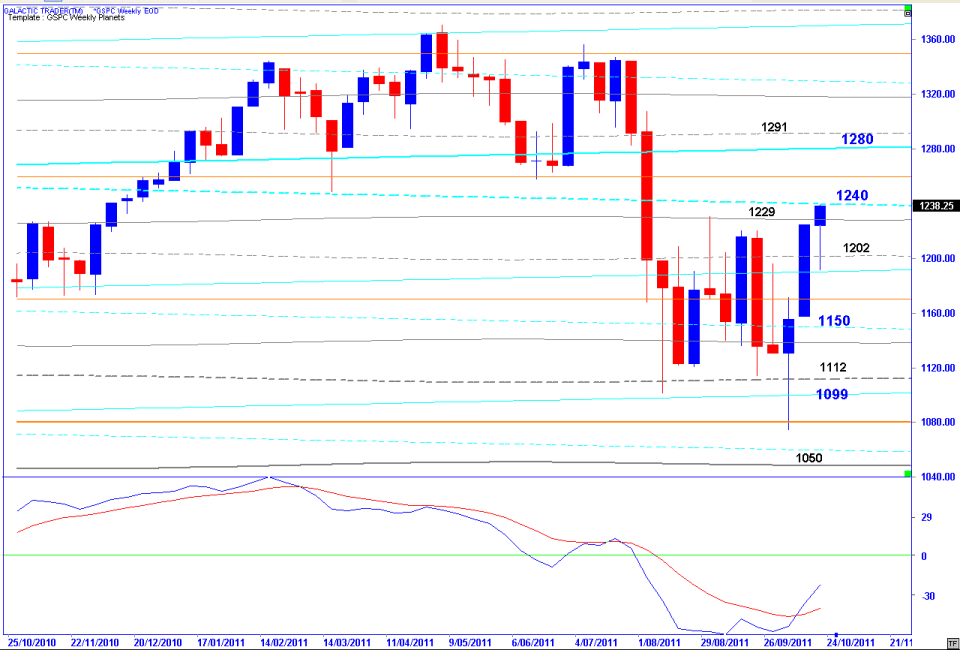
Polly's Weekly Planets chart above defines why they're the probable Price levels. Having run so far, so fast, I doubt there's much left in the Price range to the upside for this leg of the rally. But then, as I said earlier, I also suspect this is only the first wave of a pattern which will probably trace out a 3-legged rise.
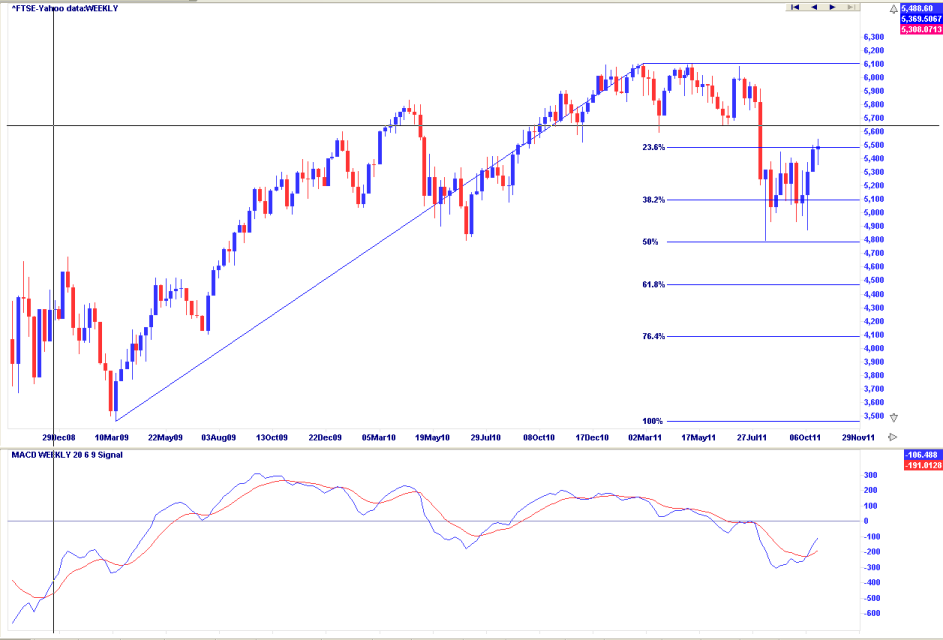
Last weekend, we looked at the FTSE and the DAX from opposite ends of the technical spectrum and it's worth taking another look at those two charts, especially given I indicated I didn't think there was much danger and expected a consolidation of the rally, rather than anything more dramatic.
Last weekend, we looked at the FTSE and the DAX from opposite ends of the technical spectrum and it's worth taking another look at those two charts, especially given I indicated I didn't think there was much danger and expected a consolidation of the rally, rather than anything more dramatic.
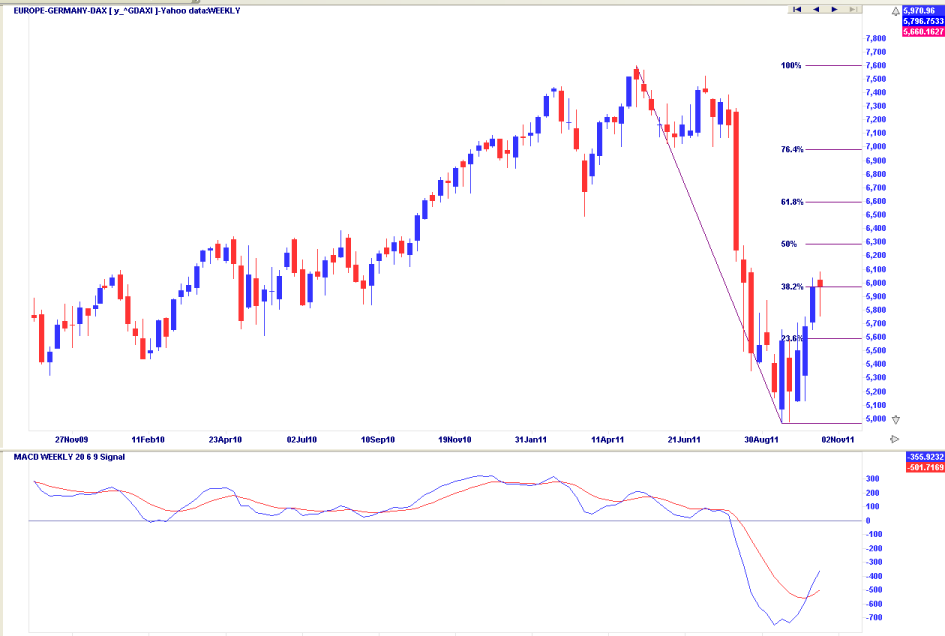
Which is pretty much what happened on both indices in the charts of FTSE (above) and the DAX (below).
It's possible the FTSE could run north to the area marked by the black crosshair before turning for the middle, downward leg of the rally. Again, we have some indication from the oscillator that this is a stronger, longer recovery phase than we've seen since midway through 2010.
The MACD signal is showing a clean pair of heels, something it didn't do during the downtrend ... and it's also a clean upside break in the DAX chart.
The Idiot & The Moon was written in two distinct sections - the first three chapters dealing with safe, reliable and simple systems for trading profitably ... and The Technical Section for those who want to understand more of the inner workings of markets.
Of course, we have to apply the lessons from that section. The current set-up warns against betting on the Bear prematurely. All the signs are pointing towards more upside before the Bear comes back ... and both Support and Resistance are being found precisely where the book teaches you to look for them.
Auntie's Weekly Planets chart is below, with Price targets valid for the coming week - and a likely rise, rather than fall, into the New Moon and Sun-Jupiter aspects.
Now, while it might have seemed like a wild ride if you were following the news, the reality by the end of the week was pretty damn boring - a bit of down, up, down, up, to end the week a whole $13.67 different. What it did was exactly what was expected: "consolidate the strong gains made since the thrust from the bottom".
I would suspect this current rally is merely the first wave of what will turn into a more complicated pattern - but which basically boils down to A-leg up, B-leg down, C-leg up ... and then ... CRASH! I suspect that because I think markets need more Time to correct the first downfall.
Pollyanna peaked on May 2 and declined into October 4. A 180-day Plus downtrend should take considerably more Time than a couple of weeks to "correct", even if the Price jump has been strong.
Also, please make note of the very strong positive divergence signals in our favorite oscillators at the bottom a couple of weeks ago. How to read positive and negative divergence signals - and continuation patterns - are dealt with in The Technical Section of The Idiot & The Moon.
Your homework for this weekend then, is to re-read that section of the book so you can understand the basics and apply the knowledge to the current market situation. If you do that, you will understand that the current state of the oscillators, while looking more than a tad overbought, have reached so high that they are hinting very, very strongly that the rally ain't over.
It may be facing a hurdle in the very near-term, but it probably isn't finished.
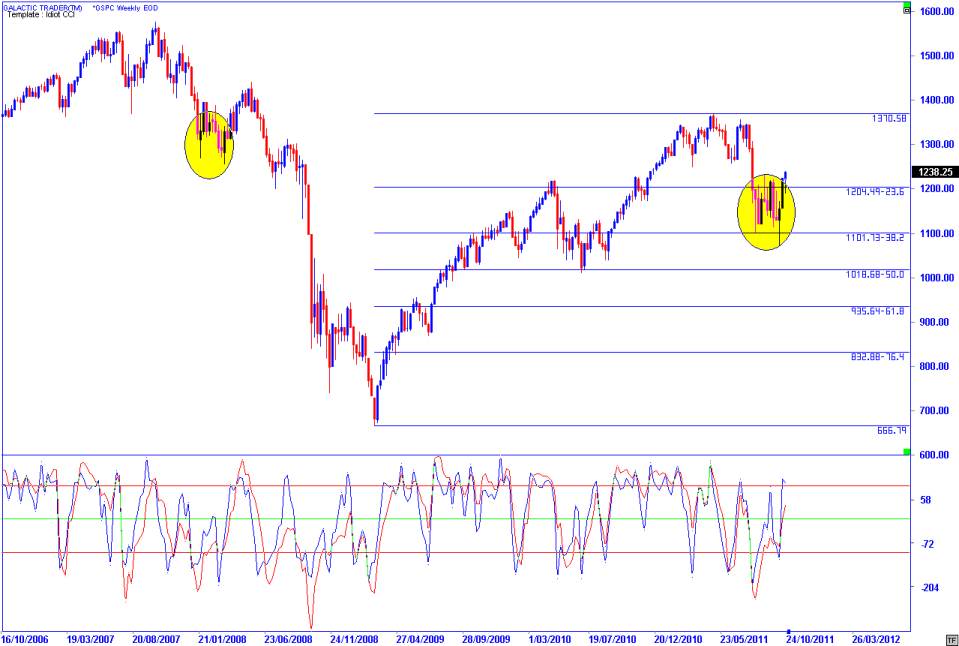
Now, let's get roolly, trooly boring and turn our attention to a familiar chart. Well, it's familiar to regular readers. If you're joining us for the first time, please have a trawl through the Archives (click on The Eye of Ra graphic in the top-right of this column) and read New Bull or Old Bear, which you'll find under the Articles button in the navigation bar.
I would suspect this current rally is merely the first wave of what will turn into a more complicated pattern - but which basically boils down to A-leg up, B-leg down, C-leg up ... and then ... CRASH! I suspect that because I think markets need more Time to correct the first downfall.
Pollyanna peaked on May 2 and declined into October 4. A 180-day Plus downtrend should take considerably more Time than a couple of weeks to "correct", even if the Price jump has been strong.
Also, please make note of the very strong positive divergence signals in our favorite oscillators at the bottom a couple of weeks ago. How to read positive and negative divergence signals - and continuation patterns - are dealt with in The Technical Section of The Idiot & The Moon.
Your homework for this weekend then, is to re-read that section of the book so you can understand the basics and apply the knowledge to the current market situation. If you do that, you will understand that the current state of the oscillators, while looking more than a tad overbought, have reached so high that they are hinting very, very strongly that the rally ain't over.
It may be facing a hurdle in the very near-term, but it probably isn't finished.
Now, let's get roolly, trooly boring and turn our attention to a familiar chart. Well, it's familiar to regular readers. If you're joining us for the first time, please have a trawl through the Archives (click on The Eye of Ra graphic in the top-right of this column) and read New Bull or Old Bear, which you'll find under the Articles button in the navigation bar.
There's not really much further to say. At this stage, we still appear to be repeating a similar pattern to the first Bear wave from 2007 to 2009. And, while it ain't broke we won't try to fix it.
If the pattern continues - which we'd expect given the Time requirement and the divergence in the oscillators on the daily chart - it's all still on track to probably top out within the 1240-1280 range we've been discussing, with some potential to reach 1291 or the low 1300s.
If the pattern continues - which we'd expect given the Time requirement and the divergence in the oscillators on the daily chart - it's all still on track to probably top out within the 1240-1280 range we've been discussing, with some potential to reach 1291 or the low 1300s.
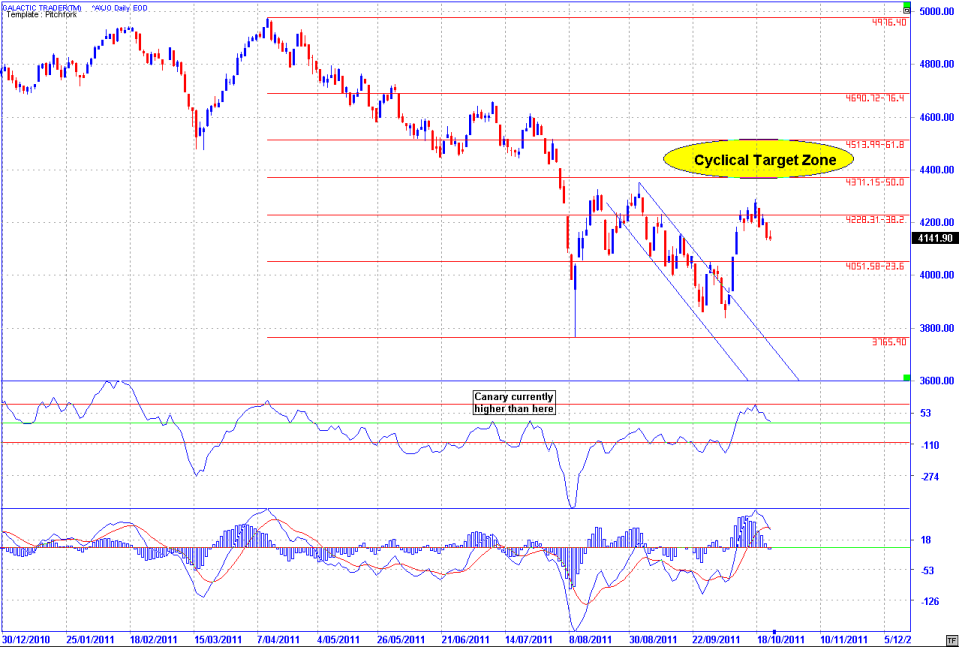
Obviously, Auntie (the ASX200) doesn't have Pollyanna's flair for the dramatique ... but, at this stage, I'm still expecting her to make a run for the high 4400s in the final stages of the rally (ie: after the B downwave, which could be a complex and confusing pattern).
I'll explain why the technical omens, portents and entrails suggest that in the chart below.
I'll explain why the technical omens, portents and entrails suggest that in the chart below.
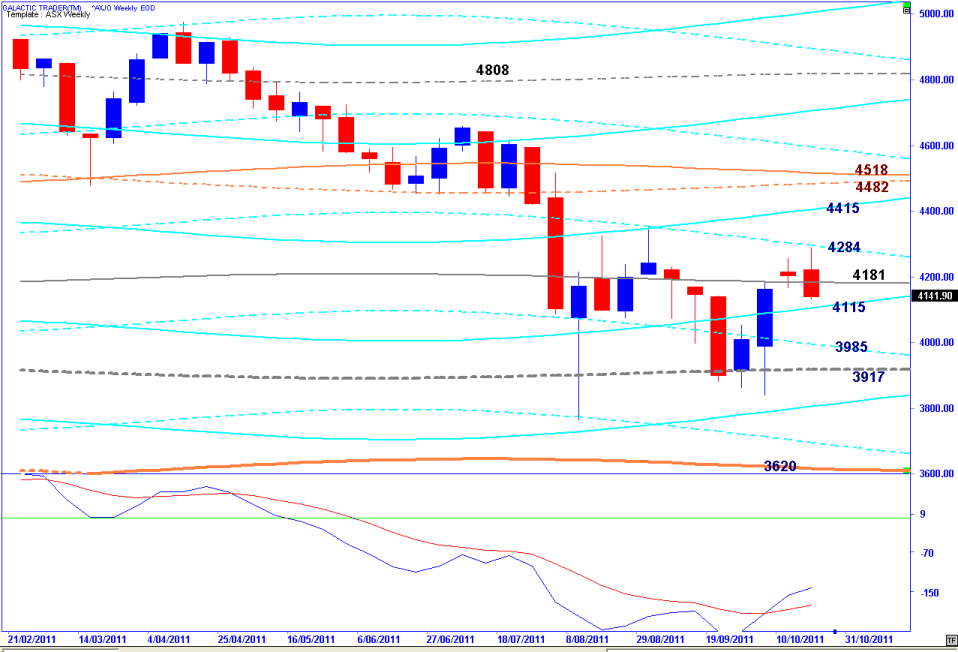
This is a similar chart to the first one we used this weekend for The Vacuous Troll. Significant positive divergence in the oscillators as Auntie was making what I referred to as the "struggle down", trading against the August spike Low.
Now, both the Canary and the MACD have gone high enough to give a fairly reliable signal that the rally is only midway through. For the past couple of weekends, I've urged you to re-read the chapters on Fibonacci Retracements and Extensions and Price & Time.
It would be worthwhile your revisiting the chapters dealing with The Canaries and how to read divergence signals so you can learn how those lessons apply in real time to real markets.
Until next weekend!