

Fleshing out the 2 main scenarios
Week beginning October 20, 2014
Stock markets began bouncing late last week, but it is likely only a relief rally which will be relatively short-lived.
Copyright: Randall Ashbourne - 2011-2014
It's the presence of Venus which will make this eclipse particularly powerful. Scorpio rules debt, taxes and most especially really BIG money. Venus rules material wealth and, according to traditional astrology, tends not to act benignly when travelling through Scorpio.
The other significant aspect is that next weekend Mercury will finish its current retrograde phase.
I indicated last weekend that Mercury Rx can manifest as a head fake. However, I also outlined the two main scenarios now facing markets ... either the Bull is dead and we are now in a new, long-running Bear ... or, this is a major correction likely to run for weeks or months before this post 2009 Bull phase puts on another major rally leg.
We have a couple of key astrological aspects taking place during the coming week.
The most powerful of these is the solar eclipse New Moon due to occur on Thursday evening in Euro-America and early Friday morning in Asia.
It will take place in Scorpio just after both the Sun and Venus enter the sign.
The most powerful of these is the solar eclipse New Moon due to occur on Thursday evening in Euro-America and early Friday morning in Asia.
It will take place in Scorpio just after both the Sun and Venus enter the sign.


Safe trading - RA
(Disclaimer: This article is not advice or a recommendation to trade stocks; it is merely educational material.)
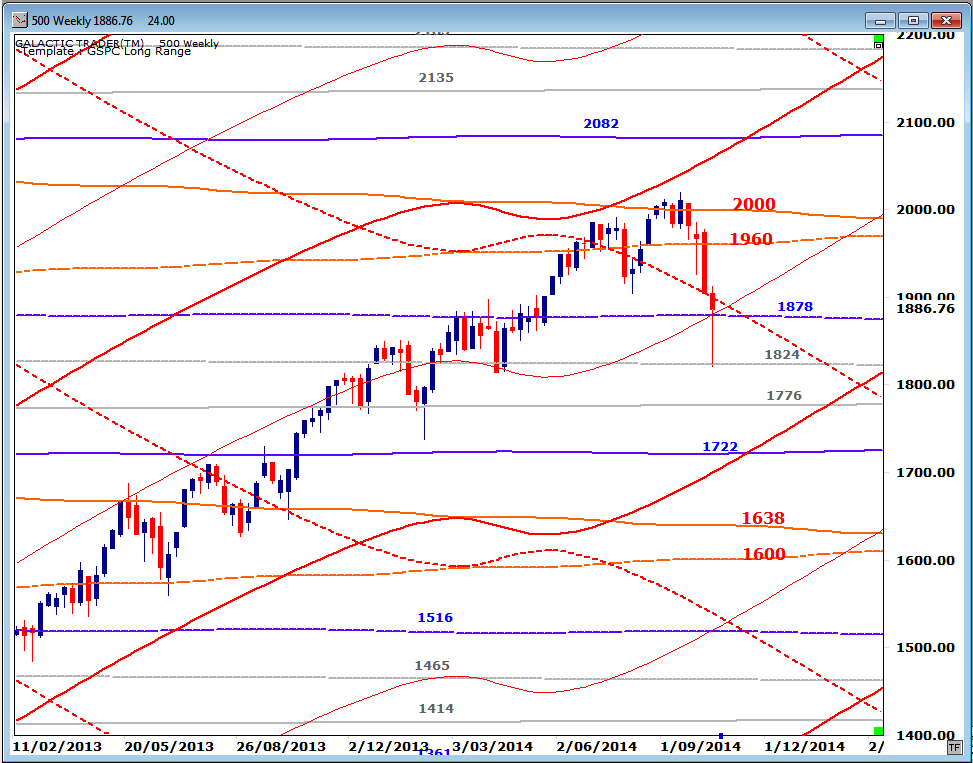
So, we'll spend a little time this weekend fleshing out those two main scenarios. I said last weekend that under the major correction scenario, the target for the decline could be as high as $1878 or as low as $1776 on the Pollyanna index, Wall Street's SP500.
I should have said "this" decline, meaning the first leg of of a three-legged decline. It can morph into a five-legged triangle pattern, but that is a level of Elliott Wave complexity which tends to be more confusing than helpful.
In any case, I showed you the long-range planetary price targets which should prove to be important throughout the correction and here's the update.
We now need to see exactly what sort of completed bounce we get before we can even think about predicting targets for the next major leg down.
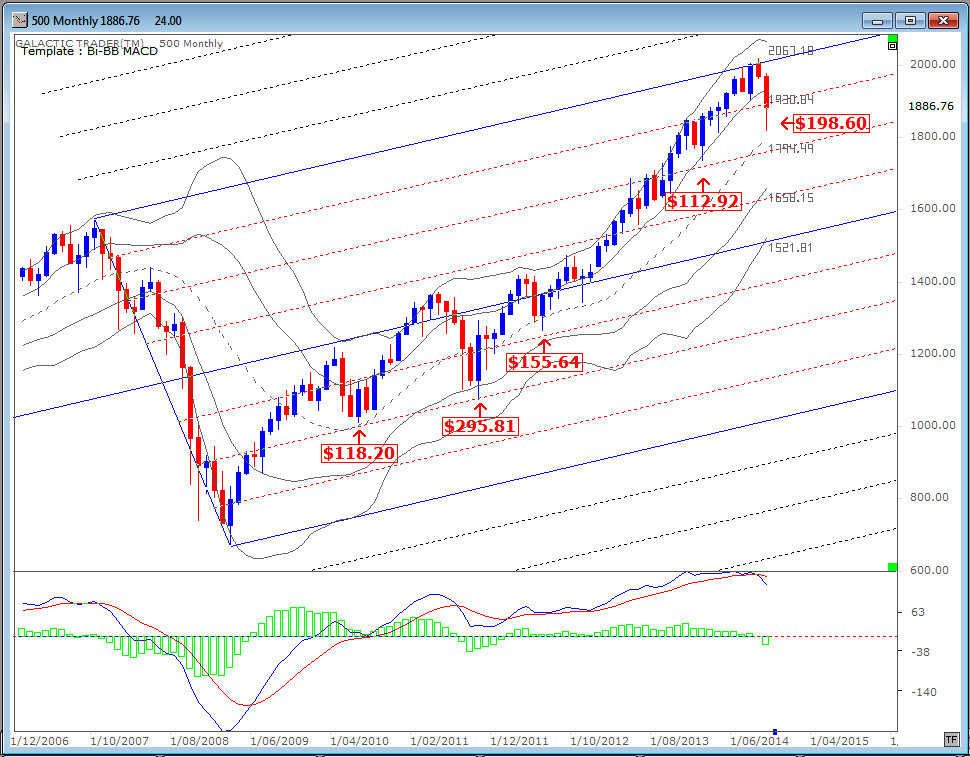
What we do know is that this is now the second biggest correction on Pollyanna since this Bull market launched itself in 2009.
What we do know is that this is now the second biggest correction on Pollyanna since this Bull market launched itself in 2009.
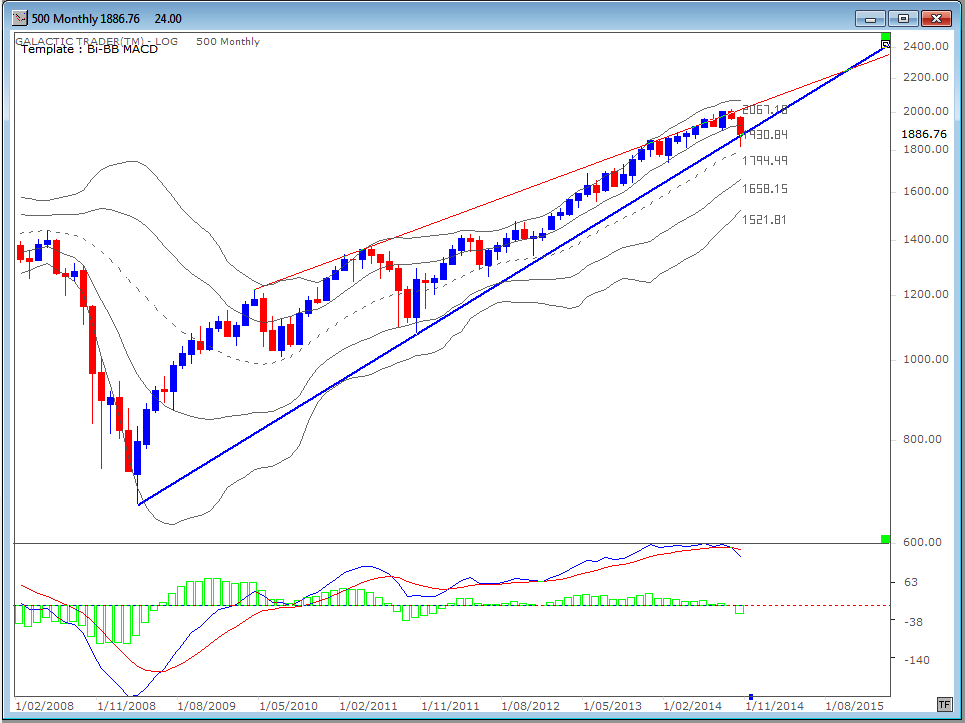
A lot of commentators are all Awoe! Alas! because the index has broken down below its long-term trendline. Well, yes and no at this stage. Personally, I think log-scale charts tend to be more accurate for an "eyeball" look at the long-range ... and on that chart, Polly is trying to cling on.
The log-scale chart shows how the price has been constrained within a rising wedge ... the thin, red topside trendline and the thick, blue support trendline.
The log-scale chart shows how the price has been constrained within a rising wedge ... the thin, red topside trendline and the thick, blue support trendline.
I don't think there's any question that blue trendline is going to be broken decisively. The MACD signal line has gone negative and the peaks in the histograms have gone from mountains to molehills over a long period while the price went higher. Negative divergence.
But, even when the trendline is finally broken, it doesn't necessarily stop the Bulls from launching a rally to do what's called a "kiss back" of the underside of the line before it all then starts really crashing.
Turning now to my home market, Australia. I said last weekend: "Regular readers will know that Auntie is a strongly Neptunian index over the long term, even as she responds to Saturn lines during weekly moves.
The next potential Neptune "rescue" level is very nearby, priced around $5150. Note that the index topped out at the $5650 level, so $5150-ish is both a legitimate target and potentially quite strong as a Support level."
And the old bat did exactly as expected ...
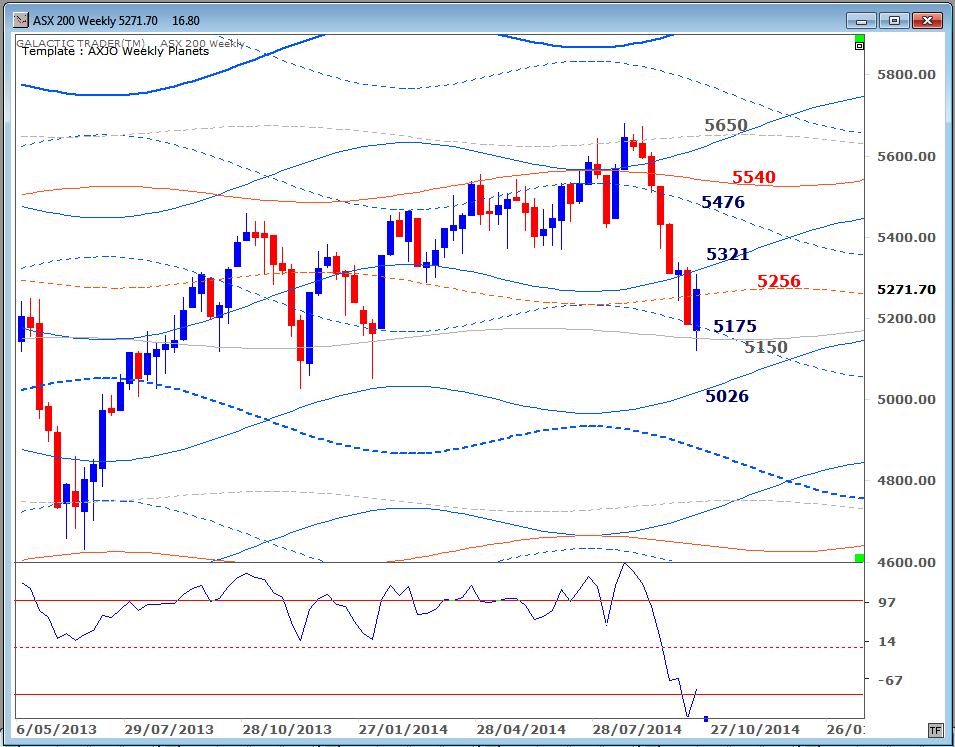
The break of the 5150 Neptune level was very short-lived. I'll show you on my daily All Planets chart for the ASX200 below. Now, do NOT try to print this chart, dear reader. Your printer will run out of black ink. Right-click the chart and save it as an image ... and then you'll have a ready-reference guide to help you through the bounce.
As you can see, Auntie topped out with some dithering around the Neptune line in the 5600s and then followed Sun and Venus lines down into the pile-up of coloured spaghetti near the lower 5150s Neptune.
As you can see, Auntie topped out with some dithering around the Neptune line in the 5600s and then followed Sun and Venus lines down into the pile-up of coloured spaghetti near the lower 5150s Neptune.
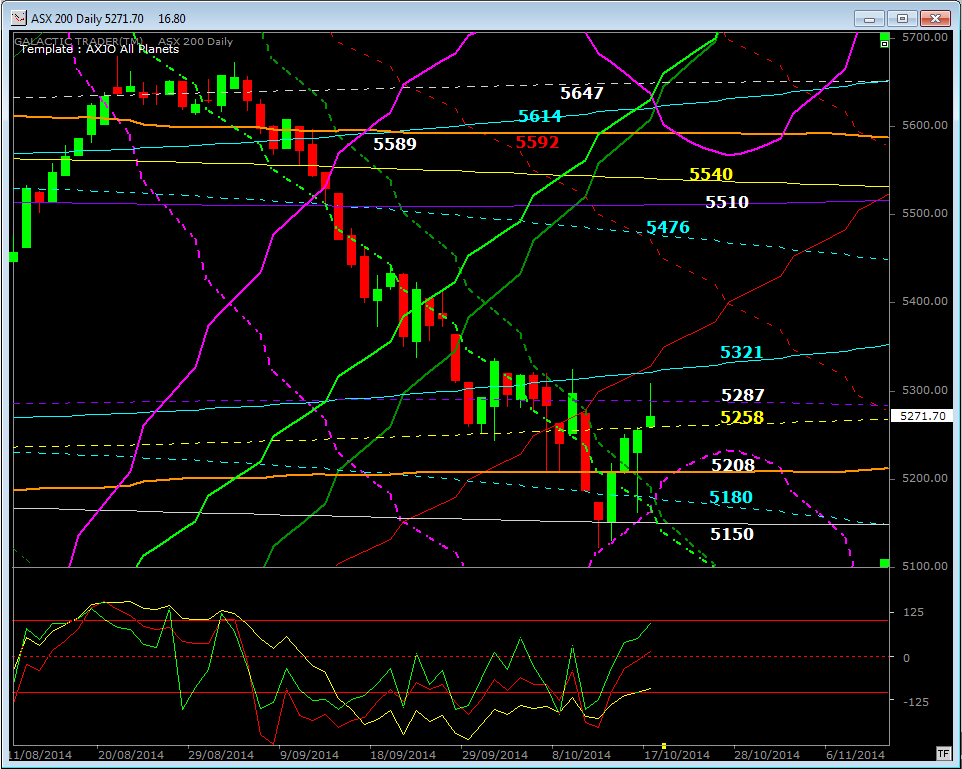
But there were were only intraday breaks below Neptune on Monday and Tuesday. Even Monday managed a close above the line, setting us up for what I'd indicated was a potentially strong Support level.
For a bounce, dear reader, but probably not a complete change in trend.
And finally for this weekend, a quick look at gold and the Sun-Pluto chart most of you will be familiar with.
For a bounce, dear reader, but probably not a complete change in trend.
And finally for this weekend, a quick look at gold and the Sun-Pluto chart most of you will be familiar with.
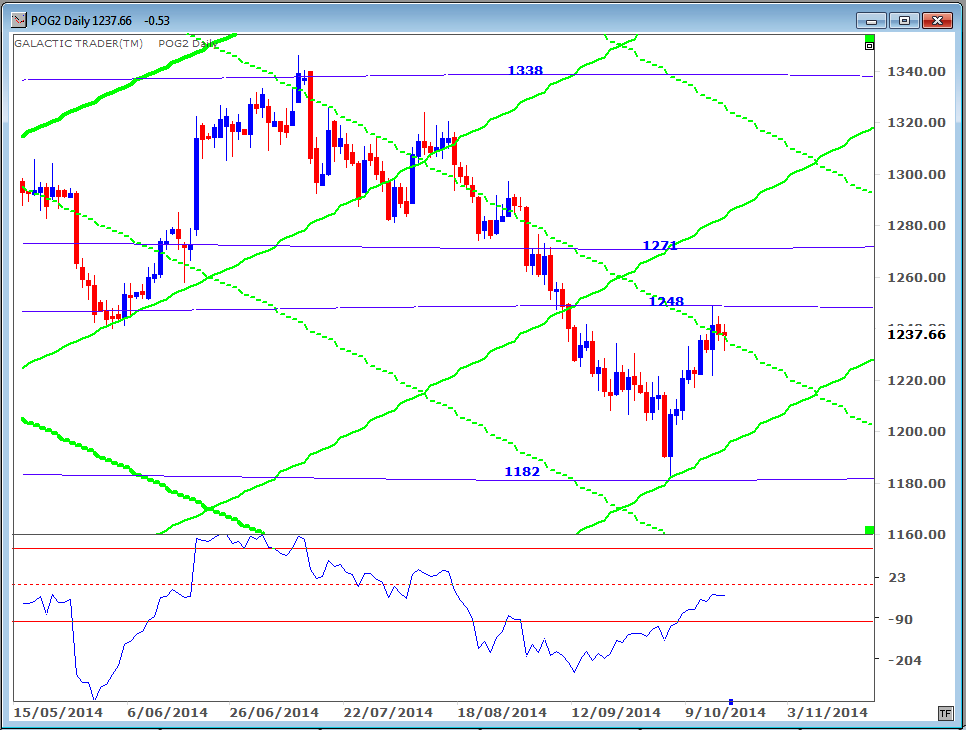
Earlier in the year, greenback gold found Support at the 1248 Pluto line ... which is now Resistance. However, on the bright side, notice the performance of the Big Bird oscillator.
While the price plunged lower, Big Bird has been steadily making higher troughs. It's a build-up of positive divergence which should have enough power to drive gold prices higher over the next few weeks.
While the price plunged lower, Big Bird has been steadily making higher troughs. It's a build-up of positive divergence which should have enough power to drive gold prices higher over the next few weeks.