2nd degree - or something cyclical?
Week beginning October 17, 2011
Markets continued their recent rally last week and the Price action in the coming week will tell us if the rally is merely a 2nd degree countertrend, or something longer.
The secrets of trend and countertrend Time periods are revealed in the final chapter of The Technical Section - Price & Time.
The secrets of trend and countertrend Time periods are revealed in the final chapter of The Technical Section - Price & Time.


Last weekend I dealt with this month's Spooky Stuff in some detail and if you need a refresher have a look under the Archives button. We are now past Full Moon and heading towards New Moon - a statistical High.
Warm regards .. and Safe trading - RA
(Disclaimer: This article is not advice or a recommendation to trade stocks; it is merely educational material.)
Copyright: Randall Ashbourne - 2011
Your homework for this weekend is to re-read that chapter, especially the material on Page 71 of The Idiot & The Moon.
Once you do, you will understand there is some danger this week if this is a 2nd degree countertrend - and also know the minimum length of time this rally can be expected to run if we get through the week unscathed.
Now, now ... it's only a little bit of homework and I'm not going to give away the secrets of those timeframes in this free weekly report. Knowing them, and applying them, is part of what you paid for when you bought the book!
I actually don't think there's much danger. I expect the coming week to be relatively quiet in terms of Price moves ... simply to consolidate the strong gains made since the thrust from the bottom.
Over the past few weekends, I've been detailing the technical condition of trading against a spike and the sharp turnarounds which follow a successful move against a spike.
That's not dealt with in the book, but it is a lesson worth learning and those of you who are interested in honing your technical skills might want to collate some of that material from the past couple of weeks into a document to keep in the same file as The Idiot & The Moon.
If I have time towards the end of this weekend's report, I'll show a Moon phase chart and add a bit of extra les Spookies information, but first I want to return to the big picture overview in technical terms.
After breaking below the primary Mars channel which has underscored this Bullish recovery run from the 2009 Low, Polly last week regained it. Now, is that a temporary condition, since she closed the week at Martian resistance?
Or will the next few weeks see her recover the primary line? You can see why I think it's possible this run could go to the 1300 area, as a possibility, rather than a probability.
You will not find charts like these anywhere else on the Internet - including on many sites where the authors purport to know more than a little about how the SP500 is affected by astrological aspects and planetary price lines.
Let's turn our attention briefly to The Moods of The Moon - which is the second chapter of The Idiot & The Moon.
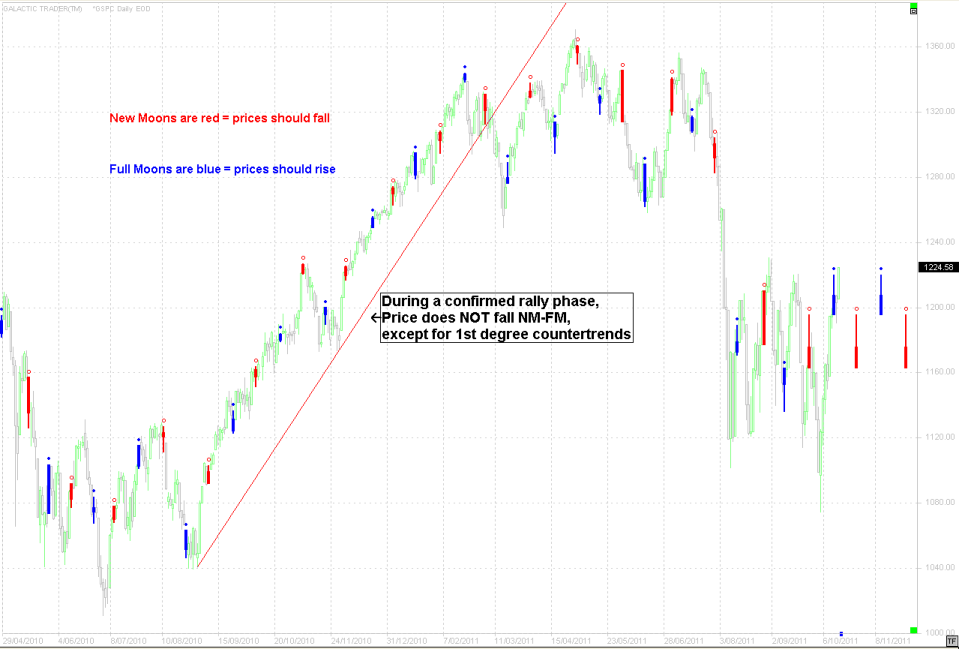
We had the expected "hiccup" last week with the Full Moon, but the technical momentum rode over the top of it - which is why I used the term, hiccup, in the first place.
We are now within the FM-3Q period, with the New Moon due around the end of the month in time with Jupiter's trine to Pluto and some other probably positive astrological aspects. The Moods of The Moon chapter goes into when it is safe to take "assumed" Moon phase trades - and details when NOT to take the assumed trades, using The Idiot as a filtering mechanism.
We get a sense of how that works in rally mode in the chart above, when the long-term statistical tendency of NM-FM drops is almost totally torpedoed by the market's technical strength.
Not only are we now on Idiot Buy signals, reacting to the timeworn script of what should happen at this stage of a Bear campaign, heading into a positive Jupiter aspect, within a statistically-positive FM-NM period, and the final quarter of the year which is, on average, a time of Price gains, but ...
We're also heading into a time when both heliocentric Mercury and Venus are moving into the optimistic sign of Sagittarius - which can bring on large Price moves.
So, just to recap before we look at markets other than The Vacuous Troll ... the broad roadmap I've been writing about since the August plunge, appears to be following the script and I've given the reasons - technical and spooky - for why I think it will continue to do so.
Timing is the more difficult part of the predictions, but the Price levels have worked so far and should continue to work.
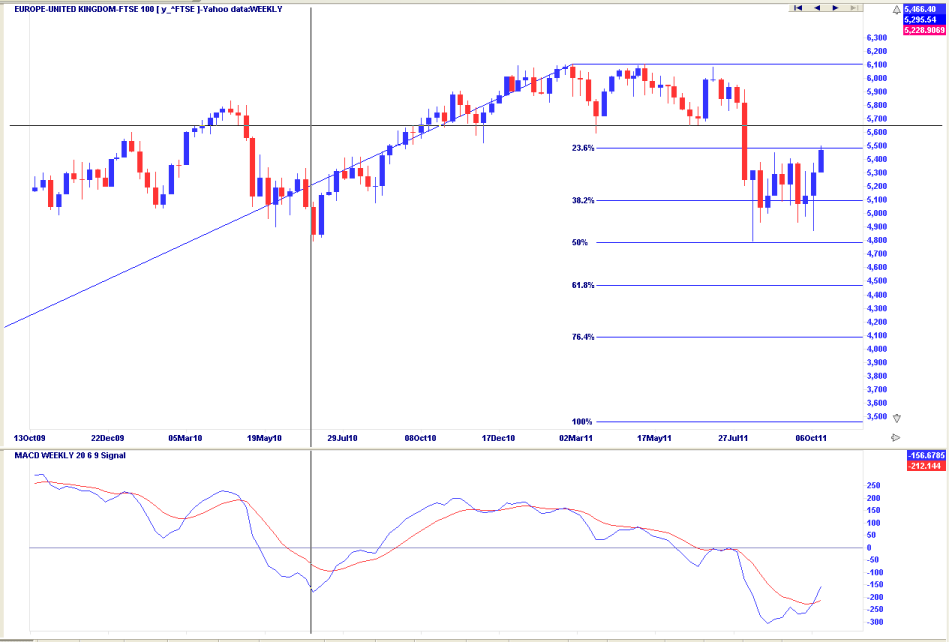
Let's take a quick look at the FTSE and the DAX - but from opposite ends of the technical spectrum. The weekly FTSE is above and we can see it has already made a higher rebound than many of the other markets, though is encountering Resistance at an expected Fibo Rx level.
I've placed the crosshair across the bottom of the previous congestion zone, indicating that's where this index will encounter even stronger Resistance in the near-term.
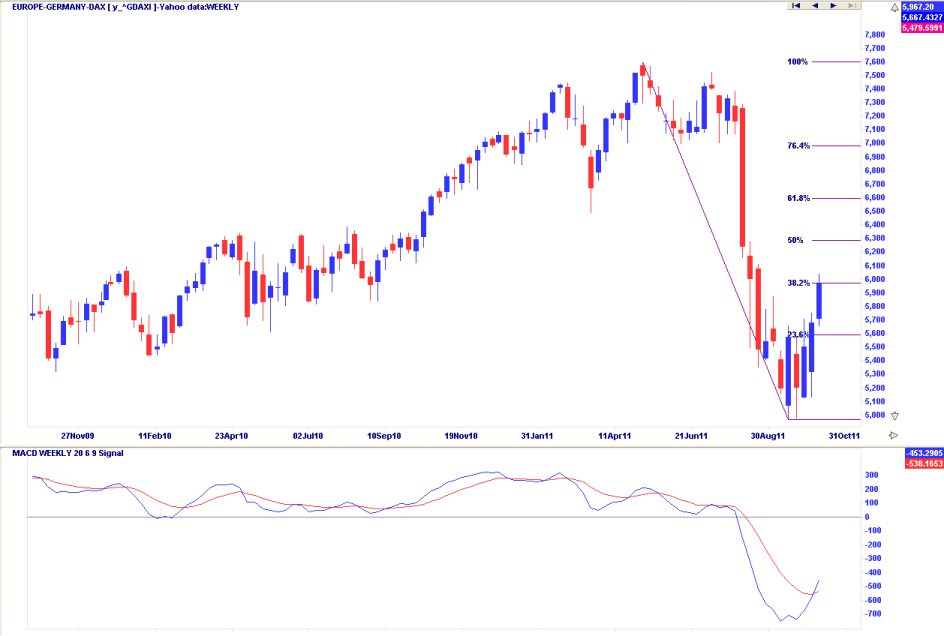
The DAX is below.
I've placed the crosshair across the bottom of the previous congestion zone, indicating that's where this index will encounter even stronger Resistance in the near-term.
The DAX is below.
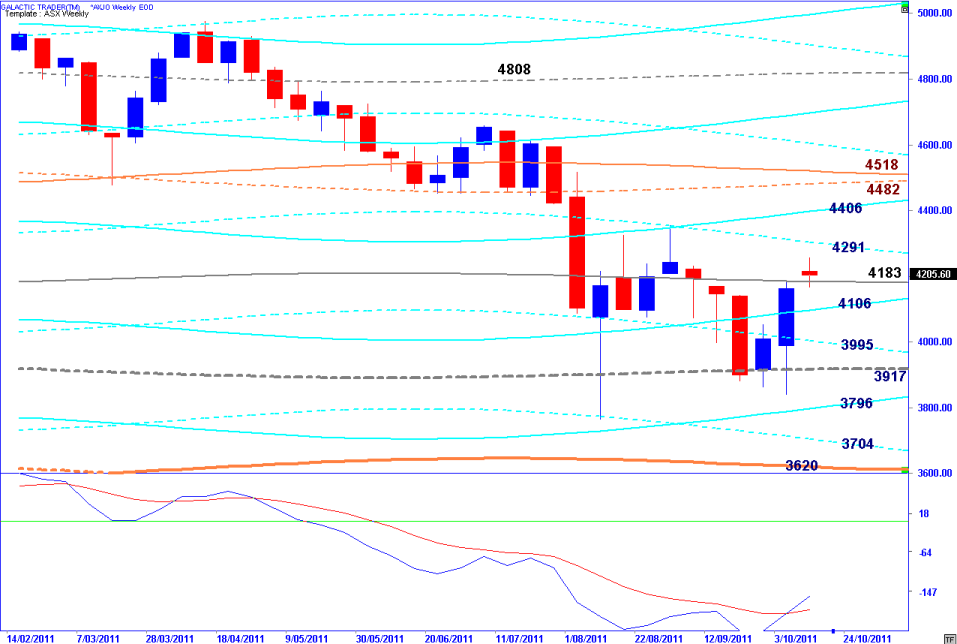
Unlike Pollyanna, the FTSE and the DAX, the ASX 200 recorded a small-range consolidation week after putting in a strong recovery run during the previous week.
Interestingly, heliocentric Mercury in Sagittarius often has an effect on commodity markets.
Okay, overall I think the bias now remains on the upside - at least for the next couple of weeks. I expect Pollyanna to have a tilt at hitting the last low before the high (which I've discussed in previous reports) and I still expect Auntie to have a run at hitting the high 4400s, maybe even the 4500s.
I'm still not expecting a resumption of the Bear for some time and think it's more likely we will go into another range-trading Time phase as markets test and retest the underside of the the upper congestion zone.
Your homework is to go read the final chapter of The Technical Section to become familiar with the difference between Time and Price phases.
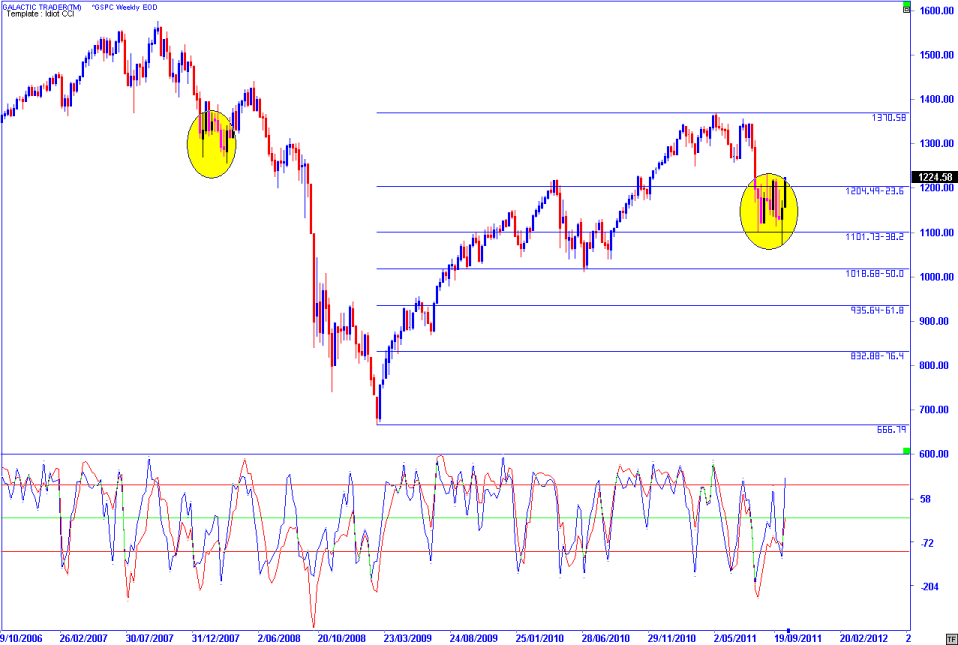
We have been discussing for many weeks now how the current pattern is shaping up as being very similar to the first Bear wave down following the High in 2007 - and my prediction was for a bit of bouncing within the 236/382 Fibonacci Rx zone before a breakout north likely to get the SP500 back into the 1240/1280 Price range.
Last week's close above 1224 - and the fact that The Idiot has moved to a Buy on daily and weekly charts for Pollyanna, following similar signals for European markets and the ASX, indicates that what I've referred to as a timeworn "script" is playing out on cue.
My bias remains - I expect the rally to continue in terms of Time into late October or early November. There is even a chance the topping/distribution process will take longer and it could be early in 2012 before markets go into another nosedive.
I am also, at this stage, still expecting this Bear market to end by October/November of 2012. I know many analysts are not expecting this Bear to conclude until much later dates - some as late as 2015.
And some are predicting Price plunges to what I think are quite silly levels. By and large, I think some of these predictions are Ego games - and I'm surprised some of those Egos are still intact given that many of their predictions have been just plain wrong. And not only in the recent past.
However, I digress and we have much to go through. If you're joining us for the first time, please go back into the Archives and to the Articles button to bring yourself up-to-speed.
So, I still think we're going to 1240/1280 into the end of the month - and there is potential, if the GS computers want to drag this out, for even higher prices. I'll show you why that's a possibility - though not yet a probability - in a moment.
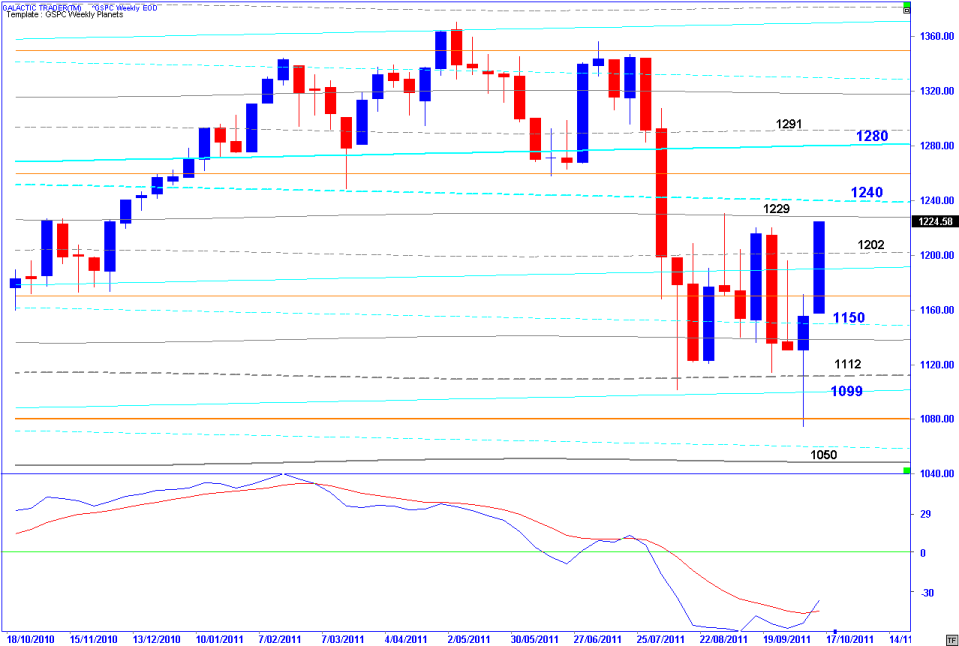
Pollyanna's Weekly Planets chart is above and we can see instantly it was a high-range Up week, following the false break below the 382 Fibonacci level and, also, a false break of a key Node line at 1080. It is quite possible since it bounced from the Node that the weekly will hit the next higher level at 1250.
The importance of the Node to Polly's long-range moves is explained in detail in the Old Gods chapter of the book. If you've constructed the Old Gods charts properly, or if you've been following The Eye of Ra for a while, you'll know the maximum probable upside is as high as the early 1300s ... and that is actually technically possible in a corrective countertrend in this position.
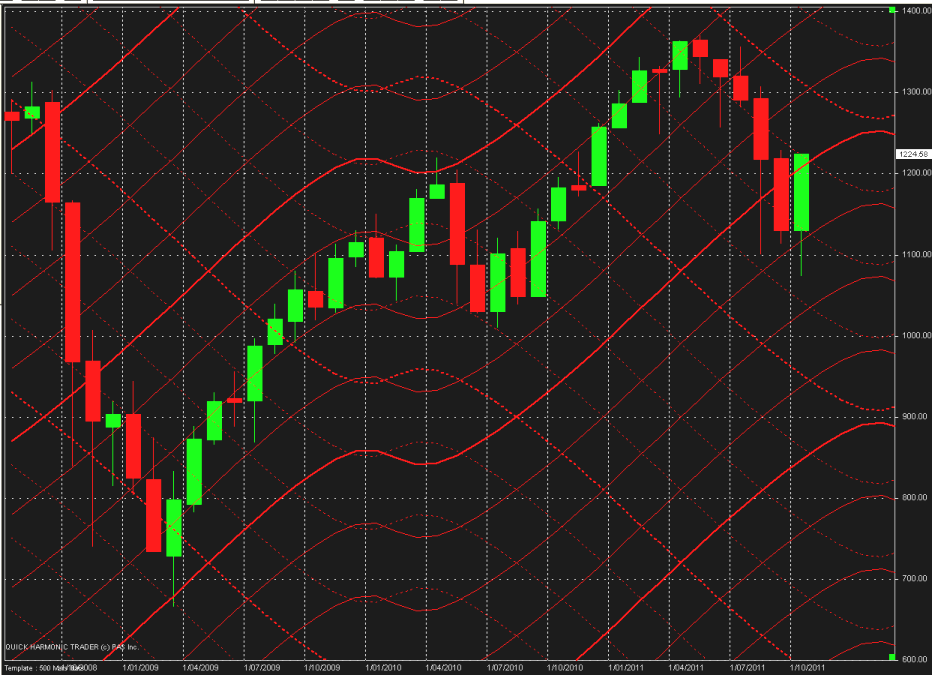
You'll know from the Old Gods chapter that Pollyanna hitches a ride between her special planets aboard a Marshun spaceship - and that's our next chart.
The importance of the Node to Polly's long-range moves is explained in detail in the Old Gods chapter of the book. If you've constructed the Old Gods charts properly, or if you've been following The Eye of Ra for a while, you'll know the maximum probable upside is as high as the early 1300s ... and that is actually technically possible in a corrective countertrend in this position.
You'll know from the Old Gods chapter that Pollyanna hitches a ride between her special planets aboard a Marshun spaceship - and that's our next chart.
One of the chapters in The Technical Section deals comprehensively with using Fibonacci retracements and extensions so that you can calculate in advance the safe, probable levels to Enter and Exit trades ... and these two charts are an excellent example of how to apply the techniques in real time in real markets.
Remember that these weekly Eye of Ra reports are designed as a learning aid in how to use the material contained in various chapters of the book.
Okay, onto my home market - Auntie ASX.
Remember that these weekly Eye of Ra reports are designed as a learning aid in how to use the material contained in various chapters of the book.
Okay, onto my home market - Auntie ASX.