Another week ... another gold dump
Week beginning October 14, 2013
This time it came at 8.52am Friday - tons of gold futures dumped for sale with no price limit.

Copyright: Randall Ashbourne - 2011-2013
To put it in context, it's about 40 tons of gold - or around 19% of Barrick Gold's worldwide production across four continents; more than the annual output of most individual mines.
As I said last weekend: "The reality is simple. Gold is still in a downtrend; attempts to "get in early" for the next rally phase leave ordinary traders vulnerable to being forced out of their positions at a loss while the big boyz' computers manipulate out-of-hours trading."
We'll take a look at the charts in a moment. And, unfortunately, that'll probably be it for this weekend. I've been having internet connection problems all week, making it almost impossible to upload, or download, anything other than very small files.
I'll leave a link to last weekend's edition at the bottom of this one, since I can't yet upload changes to the Archives menu. Stocks are bouncing after New York and Australia hit the downside planetary levels shown in last weekend's charts.
Though only little more than half the size of the 2am dump the previous week, the sell order was massive enough to force a stall in the computer trading systems.
That's just two sell orders in two weeks which have caused the price of gold to slump.
That's just two sell orders in two weeks which have caused the price of gold to slump.


Safe trading - RA
(Disclaimer: This article is not advice or a recommendation to trade stocks; it is merely educational material.)
The bounce may be short-lived. A temporary extension of the USA debt ceiling by a few weeks simply kicks the can down the road a little so we can live through all of this nonsense again, around kick-off time for the annual Santa rally.
I'm not a big fan of conspiracy theories, but the odd timing and massive size of the two gold dumps reeks of deliberate manipulation.
I'm not a big fan of conspiracy theories, but the odd timing and massive size of the two gold dumps reeks of deliberate manipulation.
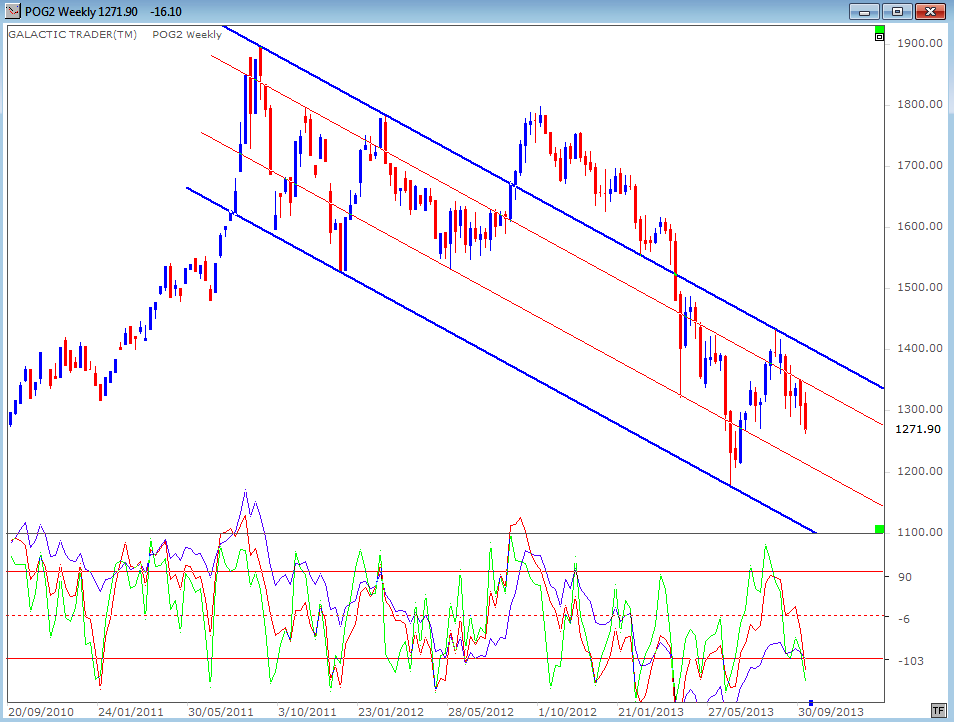
Last week's drop was confirmed by a lower low in the daily Big Bird oscillator, meaning there's a high chance of even lower prices in the next few weeks.
We would want to see some sort of obvious positive divergence develop in the oscillator readings on the daily charts before we can be sure gold is set for a sustained turnaround.
Until that occurs, there is still considerable danger in starting to load-up too heavily on either gold itself, or in gold mining stocks.
And the danger continues to grow, too, with stock markets in general. There has been very little northbound movement in prices since May.
My apologies for the necessarily brief report this weekend. I'm assured I'll have a full-speed connection back online by late Monday, so should be able to update some Weekly Planets charts for major indices next weekend.
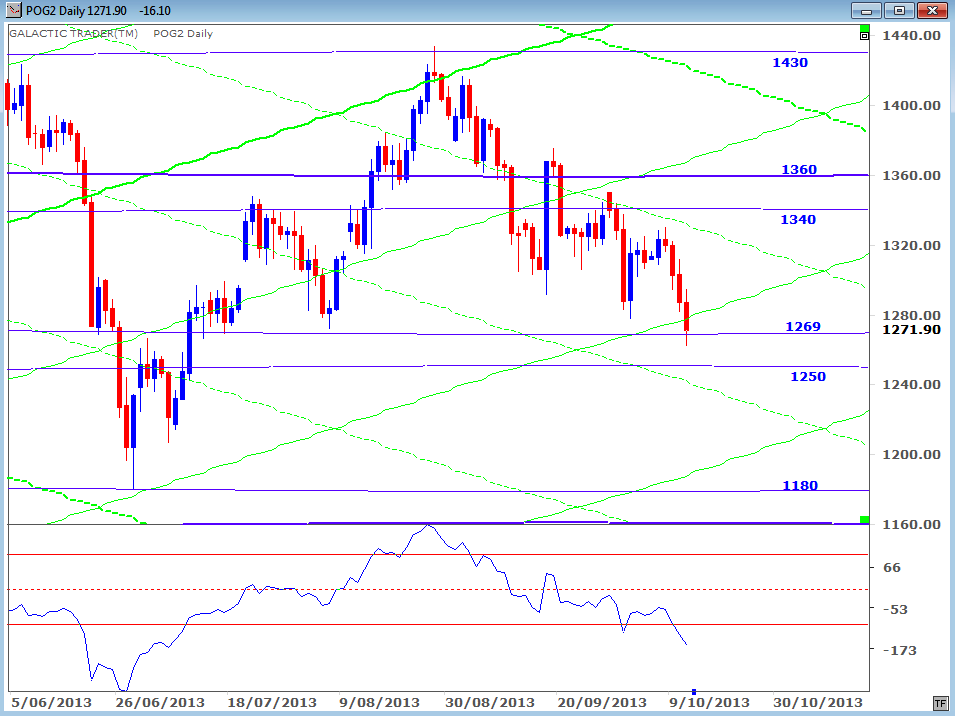
Greenback gold continues to decline within a clearly-defined downtrend channel and the risk remains it could still be on its way down to a lower low before a longer-range bounceback gets underway.
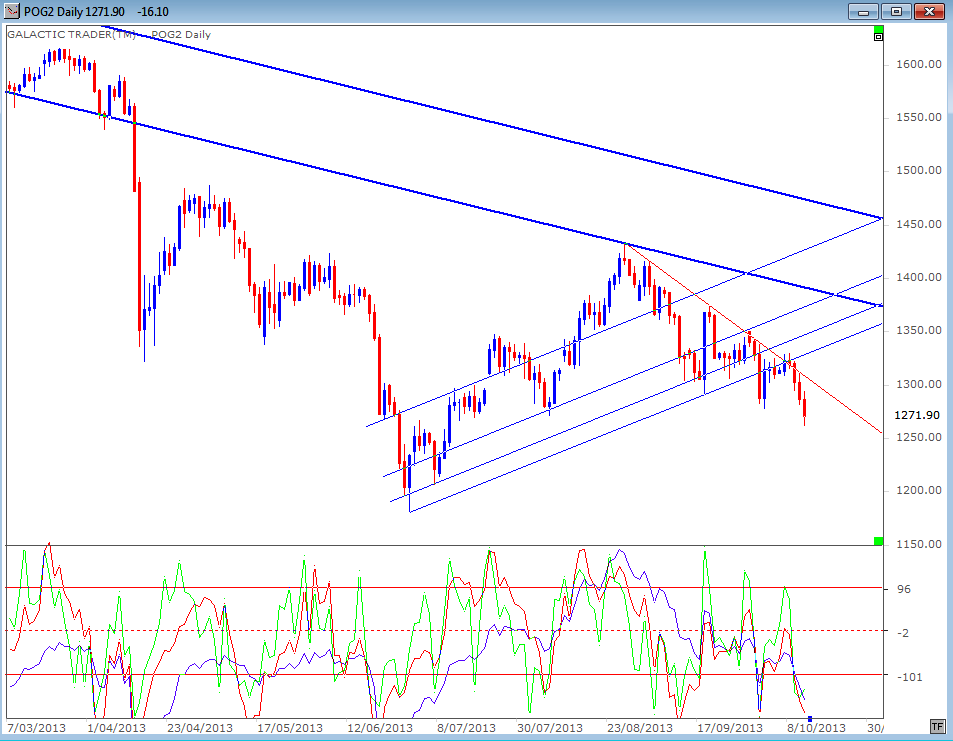
The daily chart is below and I indicated last weekend the near-term, red downtrend angle remained in effect - as it did again last week.
The daily chart is below and I indicated last weekend the near-term, red downtrend angle remained in effect - as it did again last week.
Not only does the price continue to align itself with these trendlines, it also continues to heed the planetary lines - travelling within green Sun channels between Pluto horizontal levels.