A bias changing to the upside - briefly
Week beginning October 10, 2011
For the past two months, Wall Street has been trapped in a trading range with a downside bias, as price moved against and tested the validity of the early August spike down.
Last week, the bias shifted as the SP500 finally made the move to record what "should" have happened in this condition - a marginal new low.
Last week, the bias shifted as the SP500 finally made the move to record what "should" have happened in this condition - a marginal new low.


While we are now heading into the statistically negative Full Moon phase in the coming week - and it has at least the chance to be very negative because the Sun will be almost on top of Saturn while the Arien Moon opposes both of them - my bias is that the bottom of the first, large-scale Bear wave is now in.
Warm regards .. and Safe trading - RA
(Disclaimer: This article is not advice or a recommendation to trade stocks; it is merely educational material.)
Copyright: Randall Ashbourne - 2011
The move took longer than I expected. In fact, I wasn't totally certain it was going to happen.
For the past couple of weeks I've been attempting to explain a particular technical condition known as trading against a spike - which sets up Price for a fast move, either a continuing collapse or a reversal.
I mentioned that several European indices had made a "perfect" wave structure down and that the ASX200 was clearly struggling against the spike, and that those two conditions had me "just a tad unconvinced that Wall Street isn't playing a game with us".
I indicated last weekend that I believed the worst case scenario was for a marginal new low, but I believed Wall Street was "just playing computer games to shaft the Bulls while preparing to shaft the Bears immediately ahead".
My apologies to those of you who join me each weekend purely for the technical readings and who have no interest in, nor understanding of, The Spooky Stuff. However, it will be fairly brief and, as usual, I will try to explain things as simply as possible.
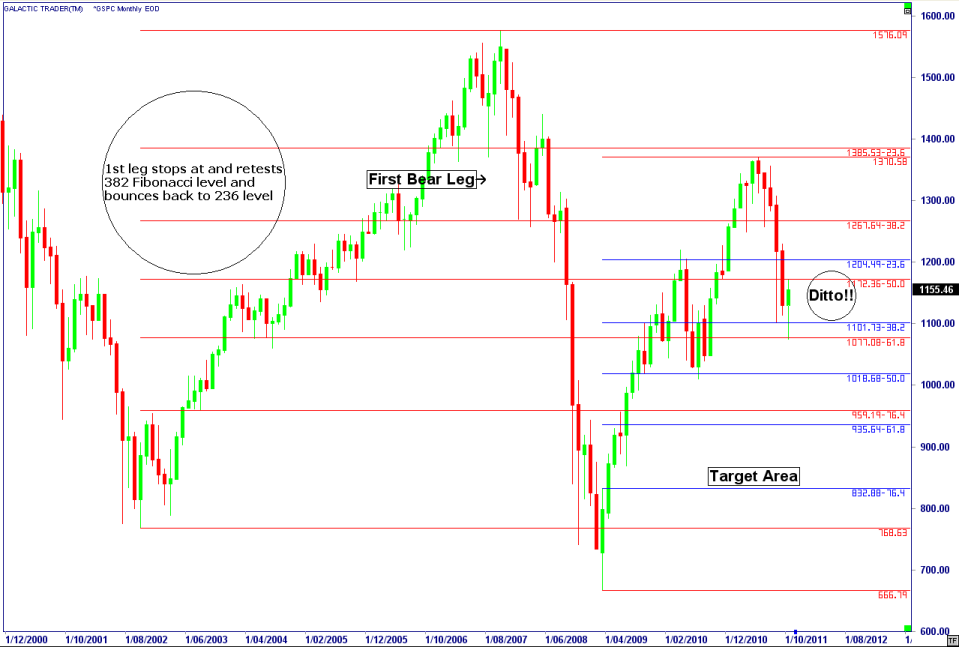
The first point I want to make is the new monthly bar made a fast false break below the blue 382 level and recovered quickly - just as it did with the break of the red Fibo Rx 382 level in March, 2008.
The second point is that with only a week's trading for the month, Price has touched, and resiled from, two key "horizontal" levels - the 50% and 618 red levels from the previous Bull run.
The third point is ... knowing what the forest looks like allows you to make SAFER moves at PREDICTABLE levels, according to the short-term signals from The Idiot, the Moods of The Moon, and The Canaries.
I don't want to harp on about this, but the whole raison d'être for both The Idiot & The Moon and the Eye of Ra is to teach you how to do this for yourself - without getting bogged down in the noise of the news cycle and without having to pay for expensive newsletters which promise to make you rich simply by following their recommendations.
The book itself outlines a couple of very simple systems designed to be both safe and profitable for those new to the markets, as well as those who have become too jaded by too many losses caused by listening to too many supposed experts. The Technical Section details the basic skills you need if you wish to trade more actively - and is what these weekly reports go over to help you enhance those skills.
If you find you're still allowing yourself to be swayed too much by the headlines and the talk shows, please go and re-read a couple of those chapters, especially the Bi-BBs and The Canaries.
I've tried to show over the past few months that markets are not nearly as unpredictable and volatile as they seem to be; the charts we first started using weeks, or even months ago, are still in use ... and still working! It's an important lesson to learn in helping to overcome that dreaded affliction, analysis paralysis.
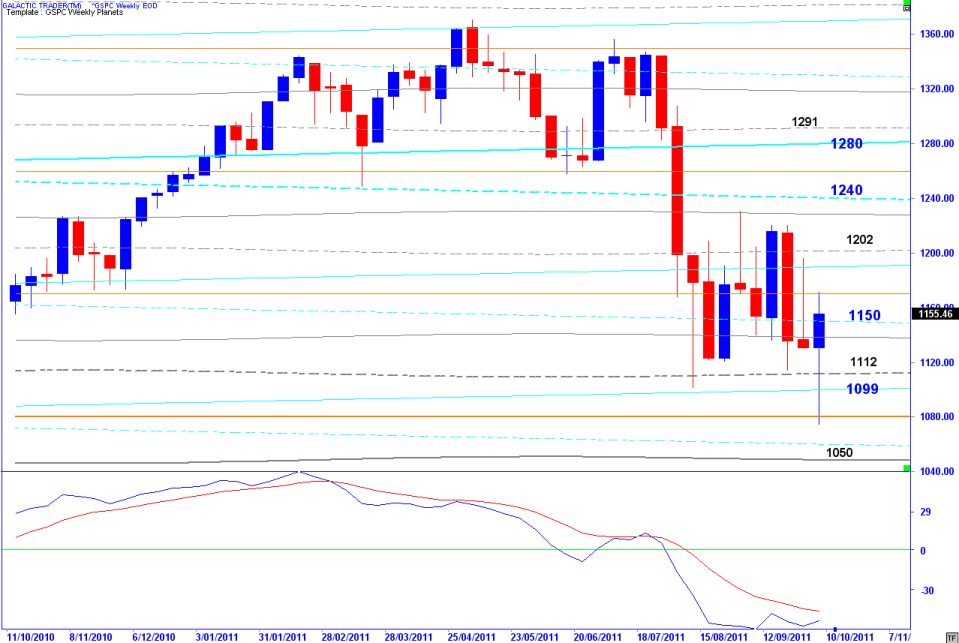
Okay, let's turn our attention to Polly's Weekly Planets. I said last week: I may be wrong, but I'm not confused. I ventured the opinion that 1112 could hold, but also admitted that in the NM-FM phase we could make a marginal new low which would probably stop at 1099 or 1050.
Polly did close at 1099 on Monday, but on Tuesday went for a deeper dip before recovering fast ... that little computer game I mentioned of shafting the Bulls before preparing to shaft the Bears immediately ahead.
As I've already mentioned, we have a potentially negative Full Moon this week, but once that's out of the way my leaning is towards a cyclical-length rally. I've written before about the importance of the 1250 level as "the last low before the High" and of my expectation that the rally should get back into the 1240/1280 Saturn zones.
And I repeat ... because of the pattern made by a number of European indices and the clear struggle-down by Auntie ASX against the early August spike, I believe the first Bear wave has made its bottom. Again, I suppose I could be wrong. Another October crash could be possible - but I still don't think it's probable.
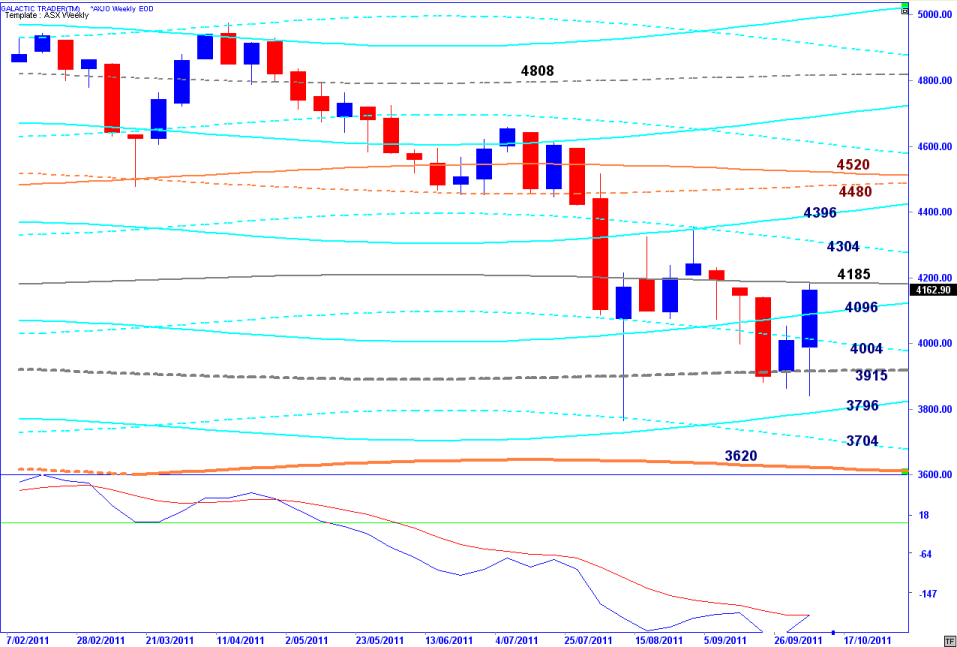
Now let's turn our attention to the ASX 200 and catch up with what happened on that "struggle down" chart I've used the past couple of weeks.
Polly did close at 1099 on Monday, but on Tuesday went for a deeper dip before recovering fast ... that little computer game I mentioned of shafting the Bulls before preparing to shaft the Bears immediately ahead.
As I've already mentioned, we have a potentially negative Full Moon this week, but once that's out of the way my leaning is towards a cyclical-length rally. I've written before about the importance of the 1250 level as "the last low before the High" and of my expectation that the rally should get back into the 1240/1280 Saturn zones.
And I repeat ... because of the pattern made by a number of European indices and the clear struggle-down by Auntie ASX against the early August spike, I believe the first Bear wave has made its bottom. Again, I suppose I could be wrong. Another October crash could be possible - but I still don't think it's probable.
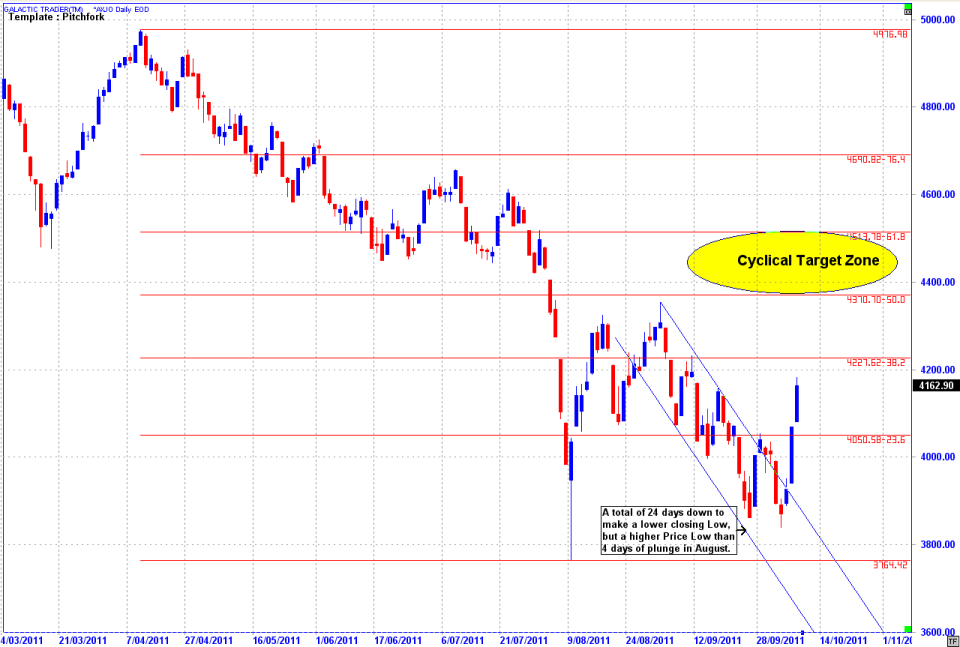
Now let's turn our attention to the ASX 200 and catch up with what happened on that "struggle down" chart I've used the past couple of weeks.
And Auntie did, indeed, have to react last Monday to the previous Friday's drop on Wall Street ... eventually making it a 24-day struggle to NOT breach the August spike Low. And you can see the sort of sharp rebound that sparks when there's a successful move to trade against a spike.
There was some evidence for believing it might have been in place a week earlier.
Okay, I said: "I'm sorry I can't give you a guarantee about what will happen with Mars square Jupiter. I think it's probably more likely to be drive, rather than dive ... even though that opinion is completely contradicted by what the statistics say should happen NM-FM in an Idiot Bear phase."
So, I'm a silly old bugger and we ended up getting both dive and drive. Life's a bitch ... and so is Pollyanna!
Normally, a rally under this set of conditions ought to recover the 50% or 61.8% levels, which I've marked as a target zone. It's actually not at all impossible for the wave to run even higher than that because I'm sure the GS computers will be trying to suck in as many Bulls, while screwing as many Bears, as possible.
And there's always Auntie's long-range tendency to run between Neptune lines to consider.
There was some evidence for believing it might have been in place a week earlier.
Okay, I said: "I'm sorry I can't give you a guarantee about what will happen with Mars square Jupiter. I think it's probably more likely to be drive, rather than dive ... even though that opinion is completely contradicted by what the statistics say should happen NM-FM in an Idiot Bear phase."
So, I'm a silly old bugger and we ended up getting both dive and drive. Life's a bitch ... and so is Pollyanna!
Normally, a rally under this set of conditions ought to recover the 50% or 61.8% levels, which I've marked as a target zone. It's actually not at all impossible for the wave to run even higher than that because I'm sure the GS computers will be trying to suck in as many Bulls, while screwing as many Bears, as possible.
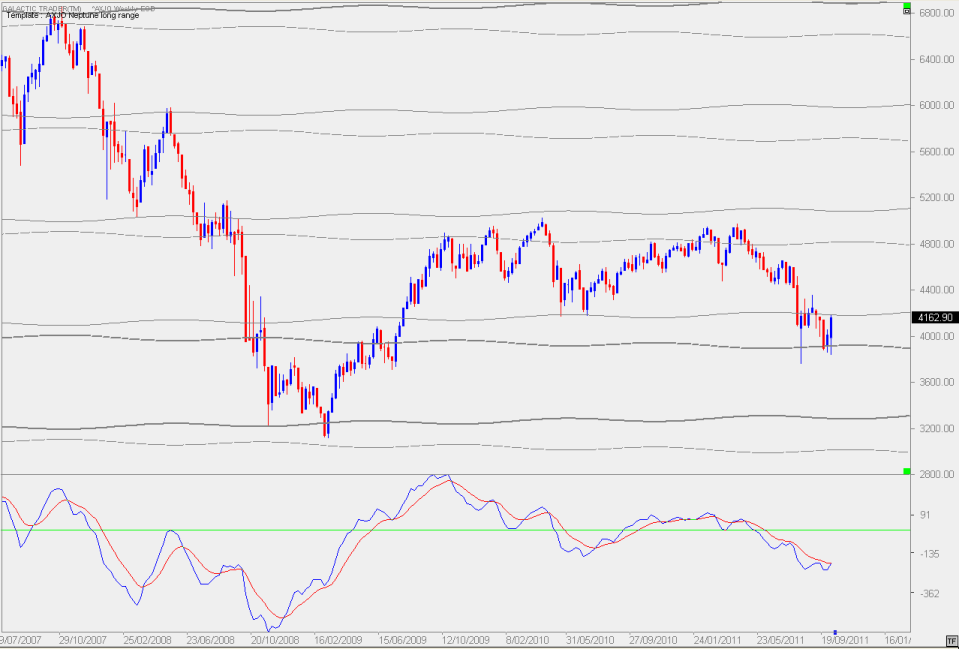
And there's always Auntie's long-range tendency to run between Neptune lines to consider.
If you compare the prices of the target zone I listed on the earlier chart, you'll see they correspond to the Uranian congestion zone around 4500-ish on Auntie's Weekly Planet charts above.
And you can see why she needs to break above the current Neptune Resistance line which has been in play as a stopper over much of the past couple of months.
Okay, well that's a wrap! You know what I think is (still) happening and what the next move will probably be and why, in terms of The Spooky Stuff, the Old Gods, That Dead Italian Guy, and just general chart patterns.
Your homework is to go re-read Bi-BBs and what's supposed to happen when there's been a break of the lines - and remember to look at the weekly and monthly charts, too! No sneaking off to tune in Jim Cramer!
If you've enjoyed the trip, send the URL to LOTS of your friends. Every astro nut I know needs to learn a bit about the techie side of things ... and we all know you technonuts just can't resist peeking inside the fortune teller's tent for a dose of les Spookies and all that silly twaddle about weekly planetary prices.
I know, I know! It's a real bugger when they make more sense than Ben Bernanke!
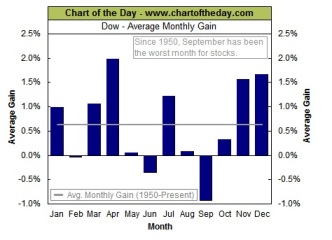
Firstly, I will leave above the Chart of the Day graphic showing the average performance of the DJI during the last quarter and record my thanks to: www.chartoftheday.com
On the left is the list of astrological transits for this month and, importantly, there is only one real negative in the list ... the first boxed aspect, which is the Sun hitting the same degree as Saturn.
One of the ways of reading "the mood" is simply to eyeball the upcoming aspects - and they're mostly positive, sextiles and trines.
The Venus and Mercury oppositions to Jupiter aren't necessarily negative at all, because Venus and Jupiter are the two positive, benefic planets.
Apart from the Sun's conjunction to Saturn, the strongest aspect in the list is the late October Jupiter trine to Pluto. The symbolism of that aspect in the current conditions is that a favourable solution will be found to "big debt" and tax issues.
So, according to my interpretation of les Spookies, the symbolism suggests a hiccup in the coming week followed by a growing optimism that a solution is coming to all the nasty stuff surrounding banks, debts and taxes. It won't be real and it probably won't last - because there are other, more negative transits in play over the longer term.
Now, the question is: Is there any technical back-up to suggest the "tea" leaves I've been reading wouldn't excite the drug squad?
As it happens, there is. For starters, The Idiot has moved to a Buy signal on the daily and weekly charts of the ASX200, the FTSE and the DAX - and done so with at least some degree of positive divergence showing in our recommended oscillators - the fast MACD and The Canaries.
I need to stress it is a fairly weak positive cross on the weekly charts, especially since the monthly Idiots moved to Bear mode, and that we do have the negative potential of a Saturn-affected Full Moon coming up.
However, bear in mind the average statistical performance of markets in the last quarter of the year; the fact that what should happen in these technical conditions is a corrective, relief rally that lasts several weeks, if not months; the statistical tendency for markets to record low points around the Full Moon; and that, so far, markets are closely following what I've described as a timeworn script ... and largely done so since I published The Idiot & The Moon in June, warning then that a top was in the making.
So far at least, I don't think I've led you too far astray. Pollyanna, the SP500, continues to do exactly what the script called for - bounce around within the 236/382 Fibonacci Rx zone. As y'all know from New Bull or Old Bear (under the Articles button) and the archives of this weekly Eye of Ra stock market report, I've been predicting that what "should" happen is a cyclical-length rally phase once the first Bear leg confirmed a bottom.
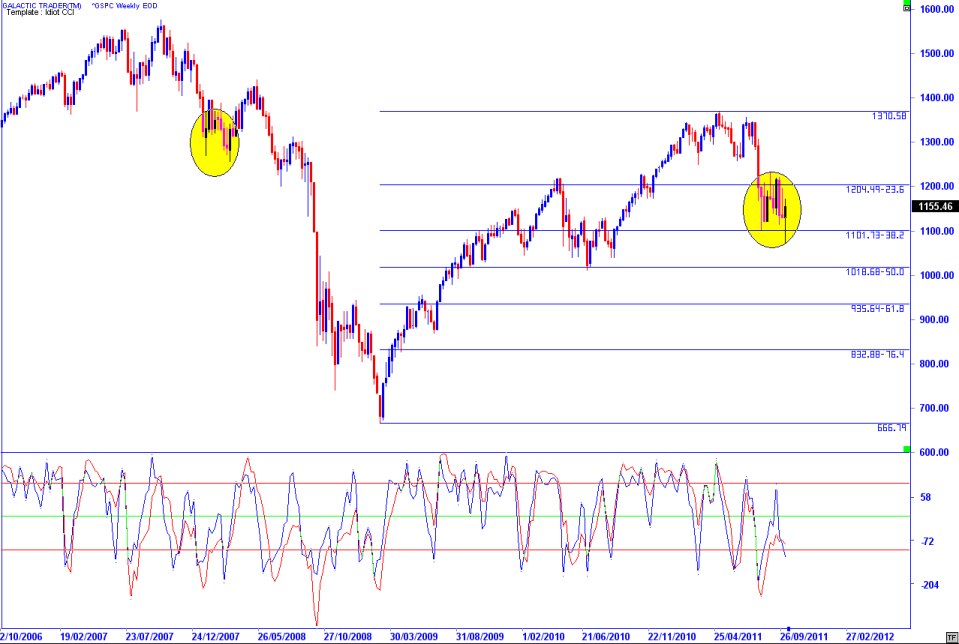
The chart above is Pollyanna's long-range weekly ... showing not only the continuing congestion inside the 236/382 Fibonacci range, but the distinct similarities with the first move down from the 2007 top into the 2009 bottom.
In fact, the pattern is remarkably repetitive, even down to the marginal new low and false break and fast recovery of the 382 level.
And it's the fact that is virtually a mirror image that suggests to me "something else" should happen. It is rare for exactly the same pattern to show up twice in a row.
It may be that the rally, this time, is sharper but not as long. Or it might be that it struggles higher and takes longer than the earlier Bear rally, which was completed in 9 weeks.
What should not vary, however, is the "probability" of reaching for, and resiling from, horizontal target levels. And our next chart, which first made its appearance in the New Bull or Old Bear article back in August, shows precisely that.
I said last week, when I put up the chart of Auntie's Weekly Planets: "If you've read the Old Gods chapter of The Idiot & The Moon, you'll recognise the significance of that 3915 level and why the old bat will fight to hold it ... and she's making a valiant effort so far."
I was, of course, talking about the old girl's tendency to run to distinct Neptune levels over the decades. And I'm not such a silly old bugger, after all; Auntie made a very valiant effort to hold the line - and bounced during her rebound right to the next level up.
I was, of course, talking about the old girl's tendency to run to distinct Neptune levels over the decades. And I'm not such a silly old bugger, after all; Auntie made a very valiant effort to hold the line - and bounced during her rebound right to the next level up.