Rechecking the roadmap into Full Moon
Week beginning November 7, 2011
According to our general roadmap for what is probable, we are currently within a leg likely to eat more Time than Price before another exhaustion push higher.
The end of this week brings on a Full Moon in Taurus, the most stabilising sign of the zodiac.
The end of this week brings on a Full Moon in Taurus, the most stabilising sign of the zodiac.


Warm regards .. and Safe trading - RA
(Disclaimer: This article is not advice or a recommendation to trade stocks; it is merely educational material.)
Copyright: Randall Ashbourne - 2011
Let's recap some of what I said in last weekend's edition before considering the likely path ahead.
"As you know, I've put the case that we're currently in the rebound and that it will be a three-legged affair with the first upleg now probably reaching both its Price and Time requirements.
What I think will follow is a period of downwards to sideways shuffling to eat up more Time ... then another exhaustion run higher ... to be followed by a CRASH into late next year."
I also spent considerable time last weekend discussing the potential for my being wrong about where markets are headed - and you can find all of that material under the Archives button (above).
However, at least for the moment, things continue to play out as we've been anticipating. The SP500 snapped back into the levels we expected to be reached in this first stage of a bounceback rally - but, as I indicated last weekend:
"Now, even with all the goo-goo/ga-ga gushing, it's not really likely that she's just going to blow through all that overhead Resistance."
That, too, turned out to be the case ... the overhead Resistance does seem to have set the Price and Time top for the first upleg and we do seem to be in the expected period of downwards to sideways shuffling.
Overall then, it's still a case of it ain't broke so we won't try to fix it.
In previous weeks, I've explained that I expect this downwards to sideways-shuffling middle leg to be a rather confusing affair. Not that we should be confused!
I indicated weeks ago that les Spookies indicated a favorable solution would be found to the big debt issues, but that it wouldn't be real and it probably wouldn't last. So, Greek got its bailout ... blew it all up by proposing a referendum ... changed its mind about that ... and blah, blah, blah, blah.
There may be even more of that in the coming week because Mars will oppose Neptune as the outer planet is changing direction - and Neptune is king of the foggy and confusing.
But. The Full Moon in Taurus should stabilise things again. As y'know, Full Moons tend to be statistical Low points.
Now, I think last weekend's piece and this little extra bit is quite enough of the spooky stuff for the moment.
It is now my intention to do my utter best to bore you.
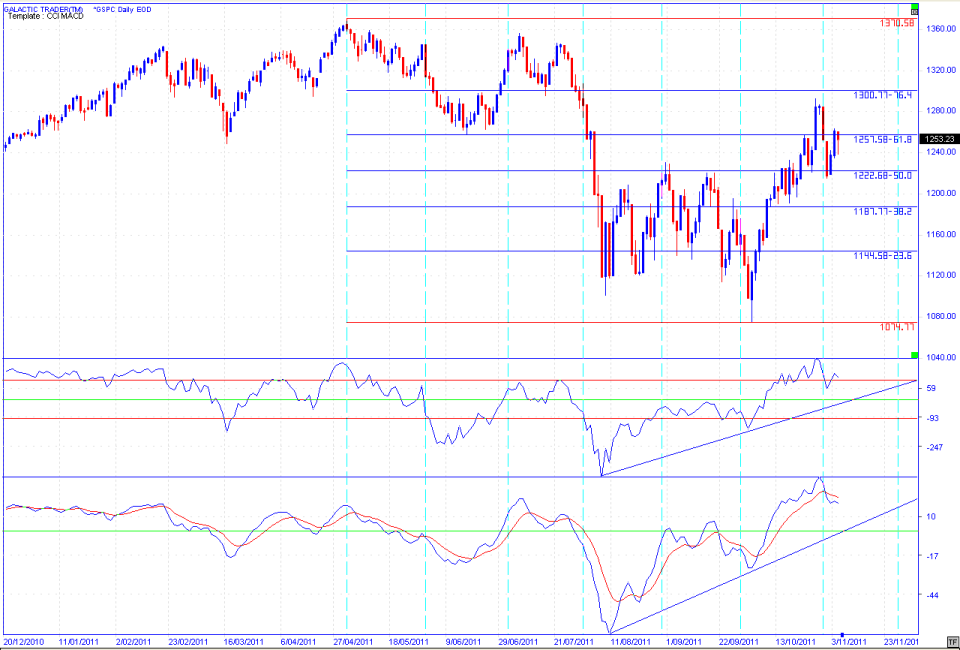
Now, as regular readers know, I don't very often resort to using daily charts because I believe it's far more useful to know where one is in the overall forest, rather than standing on some oscure path contemplating the veins of one leaf on a twig of a single tree.
But, this chart is a very good one for learning more about the positive/negative divergence signals I talk about in The Technical Section of The Idiot & The Moon.
Notice the very significant positive divergence between the oscillator troughs at the August spike Low and the lower Price Low on October 4.
Now, what we would expect to see before the final Price High to this rally is a case of?? Yes, negative divergence. We want to see Price higher, while the oscillators make a lower peak. It doesn't always happen, but it usually happens - regardless of whether the chart is a monthly or a 15-minute intraday.
For the moment, the daily oscillators are still trending higher - indicating that we have not yet seen the final high Price.
So, at this stage, it's all still on track to play out according to the old, timeworn script - and Pollyanna's Weekly Planets chart, below, continues to contain the bulk of each week's moves.
I'm not sure there's anything to be gained by analysing any further this week. As I indicated earlier, our roadmap still ain't broken. I know. It lacks excitement. And you know that's exactly the way I think safe, profitable, reliable trading ought to be!
My apologies to my European and Asian readers. It's a while since we've looked at anything other than Wall Street's main index. I'll try to amend that situation over the next couple of weekends.
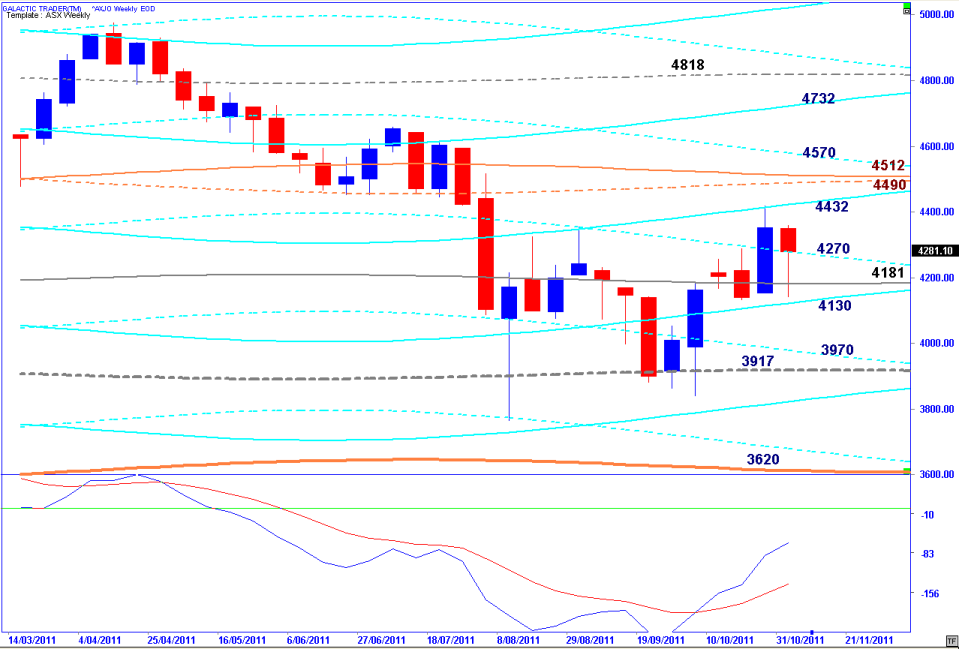
I'll leave you this weekend with Auntie's Weekly Planets chart - the Old Gods chart for my home index, the ASX200.
My apologies to my European and Asian readers. It's a while since we've looked at anything other than Wall Street's main index. I'll try to amend that situation over the next couple of weekends.
I'll leave you this weekend with Auntie's Weekly Planets chart - the Old Gods chart for my home index, the ASX200.
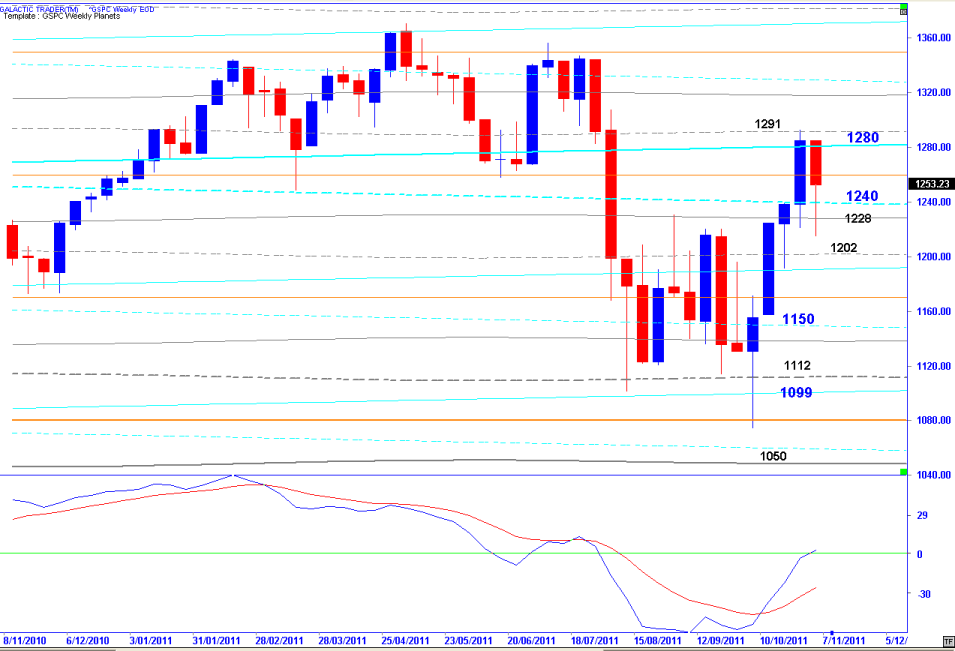
Yes, yes. We've been using this chart for many, many weeks. It's all part of my evil plan to get you off the adrenalin feed of the news cycle. So far, everything is going according to plan. Dull. Boring. Or ... safe and reliable.
The red Canary has climbed back above the upper 100 line, reaching higher than its nearest peak to the left, even though Price was higher at that previous peak. Since, on this chart, the red is an intermediate indicator, it's suggesting there is more rally mode still to come, even though the faster, blue Canary has turned down - indicating the probablity of short-term weakness immediately ahead.
Which wouldn't be unusual heading into a Full Moon ... when we expect a bit of downward pressure anyway ... to eat up some Time before another Price push higher.
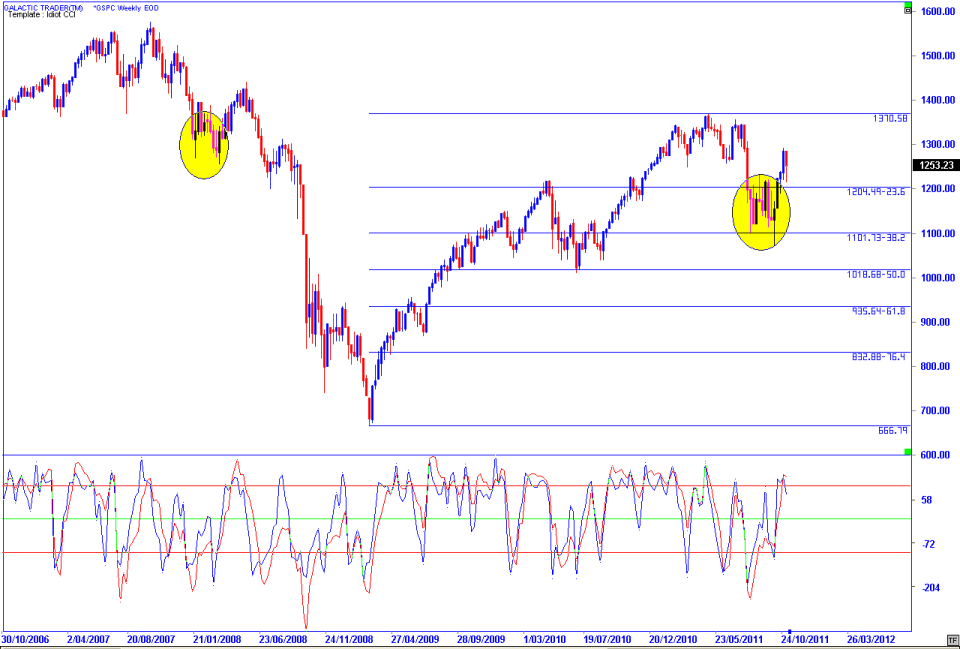
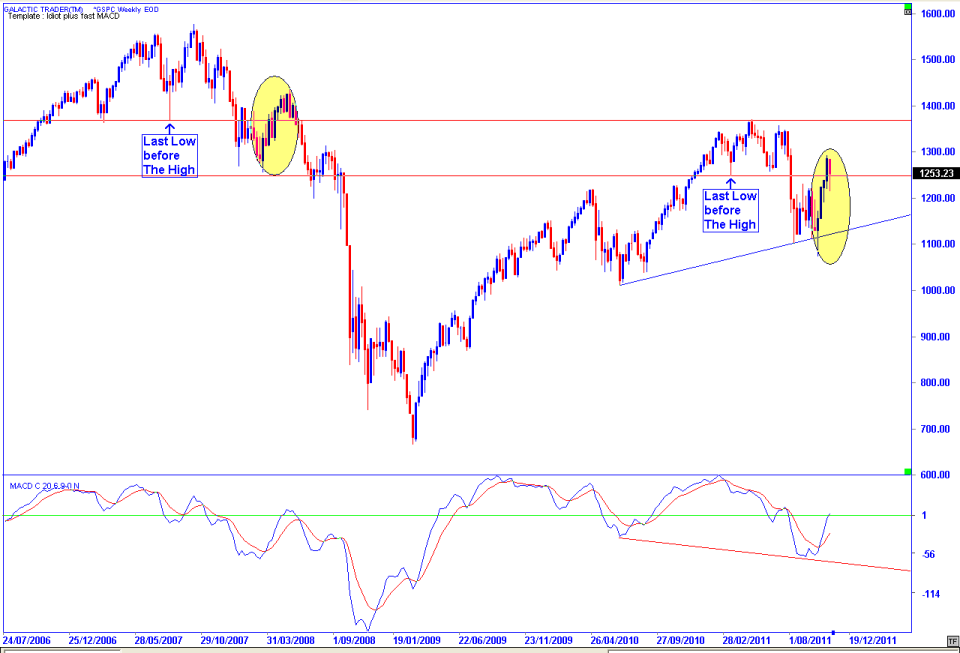
And another boring chart we've looked at several times because we want to know how the index reacts to the spike down of the Last Low Before The High.
By the close on Friday, the index had recovered the level. The blue MACD signal line is at Zero - which would be a nasty, nasty place to turn down from.
So, let's take a look at the daily chart for a more nuanced look at the immediate potential.
By the close on Friday, the index had recovered the level. The blue MACD signal line is at Zero - which would be a nasty, nasty place to turn down from.
So, let's take a look at the daily chart for a more nuanced look at the immediate potential.