Heading towards the final countdown
Week beginning November 28, 2011
There are now probably only two rallies left before stock markets worldwide start the real crash.
The first will likely be only a first degree countertrend before markets retest the August/October Lows and the second is likely to run 22+ days and will potentially be an exhaustion run.
The first will likely be only a first degree countertrend before markets retest the August/October Lows and the second is likely to run 22+ days and will potentially be an exhaustion run.


Warm regards .. and Safe trading - RA
(Disclaimer: This article is not advice or a recommendation to trade stocks; it is merely educational material.)
Copyright: Randall Ashbourne - 2011
For many months we have been following a broad roadmap which detailed the sort of bouncy path markets were likely to take before the Bear returned with bared fangs - and we will review all of that shortly.
Firstly though, I want to deal with the failure of the New Moon phase, where markets have tumbled rather than rallied. In the November 14 edition of The Eye of Ra, I noted: "We now head into the 2 week band when, statistically, the biggest gains are made if markets are in Bullish mode."
And that statement came with this caveat: "Normally, the Sagittarian energy is almost boundlessly optimistic. There are, though, occasions when it swings into reverse and what gets exaggerated is fear, rather than hope and an adventurous spirit."
Obviously, we got the negative side of the energy - which leaves open the potential for further losses before the final rally I spoke of above can get underway.
We are now also in a period when Mercury has gone Retrograde. What often happens with Merc Rx is a change of direction roughly halfway through the period ... so that markets end the phase little changed from the prices that prevailed when it started.
But, enough of the Spooky stuff. I want to go through some charts with you and detail how I think the final chapter is likely to unfold.
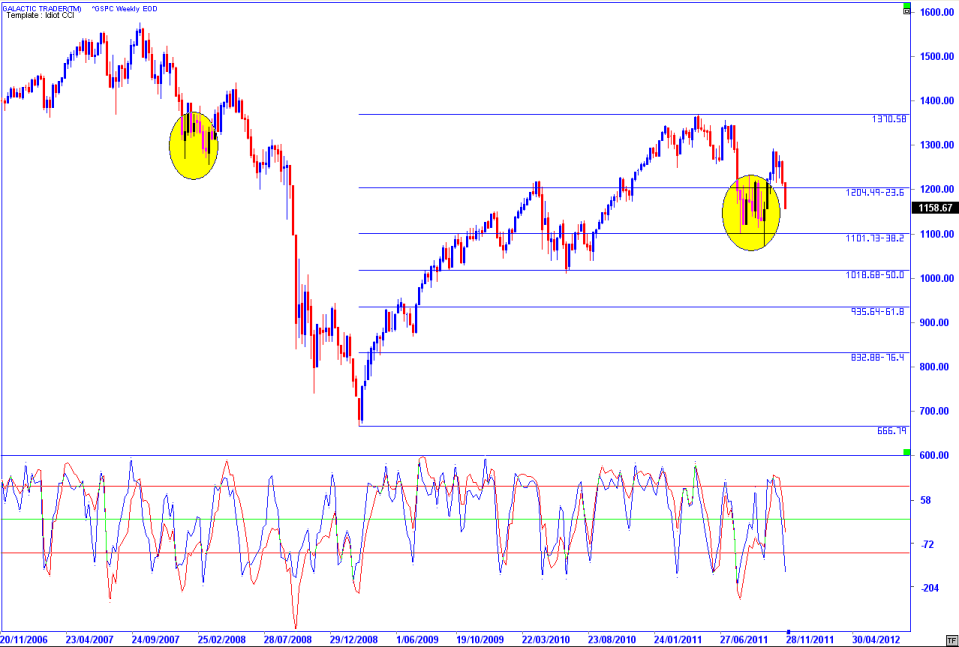
We'll begin by returning to the chart of Wall Street's prima donna index, the SP500, that we've used many times showing the probability of a repeating pattern developing since the August spike down and the false break low which would precede a rally.
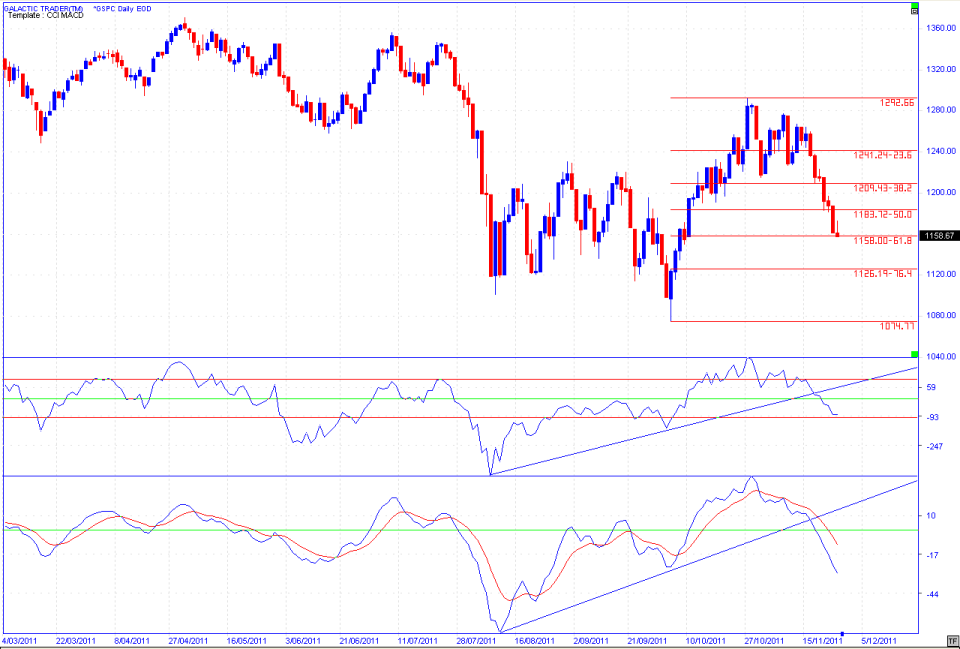
Pollyanna ended her shortened week trying to find some Support at the 618 Rx level. Yeah, yeah. The previous week she'd tried the same antics at the higher 382 level and that didn't work.
The one thing she has in her favor is Friday's low also came in on the Solar Eclipse New Moon and eclipses do have the energy to turn markets around.
Both oscillators have broken their uptrend lines ... The Idiot remains on a Sell signal across all 3 timeframes ... the trough in the fast MACD is diving lower than it did at the October false-break Low, though the Canary is giving early warning of a potential rebound.
As I said, I think we're going to get a first degree countertrend, but probably haven't yet seen the final bottom of this downturn.
One of the reasons I say that, even with the potential for some Mercury Rx shenanigans and a midway turn, is that it is statistically unlikely for markets to go up between New Moon and Full Moon unless markets are in a confirmed and continuing cyclical uptrend.
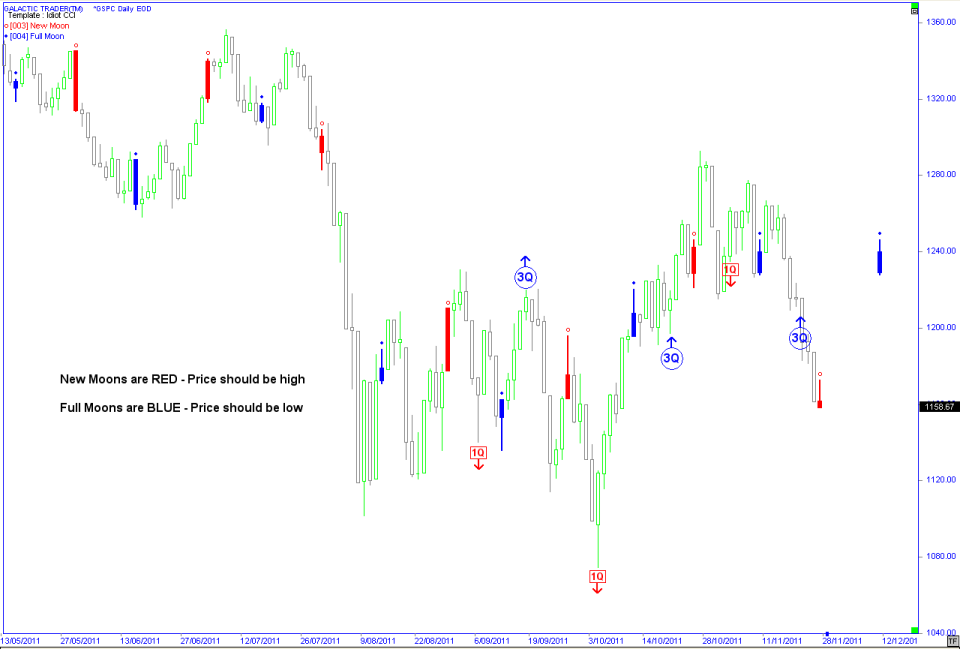
Since we think we're in that 4-month bouncing around phase before the Bear bites back, let's take a closer look at how the Moon phases have been playing since August.
New Moons are red bars, meaning markets should decline or stagnate for two weeks into the Full Moon blue bars (which are supposed to start another rising phase). On two occasions, we've had a brief bump up after the New Moon, followed by a decline into 1Q.
In fact, all 3 of the past 1Q Moons have been lows. Instead of continuing to drop into the Full Moon, the dates have coincided with northbound turns. Conversely, only 1 of the supposedly positive 3Q Moon dates has resulted in continuing rallies.
So, IF the recent pattern repeats itself, the current downturn will not see its actual low until the end of this week.
As I said last weekend, we got the "initial bouncing within the 236/382 Fibonacci Rx range, similar to what happened during the first Bear leg down after the 2007 top ... then a northside breakout which would stuggle up and stuff around at the bottom level of the previous congestion/topping range."
So, now we've fallen back inside the 236/382 Fibonacci zone - and it's beginning to look unlikely that we will be revisiting the recent highs, but may be on our way to making another low, similar to that first slump following the rally out of the yellow oval on the left of the chart.
If that's the case, we'll probably see only a small, first degree countertrend this coming week, or the next ... then a new Low ... then a rally which could scrape into 22 days or so.
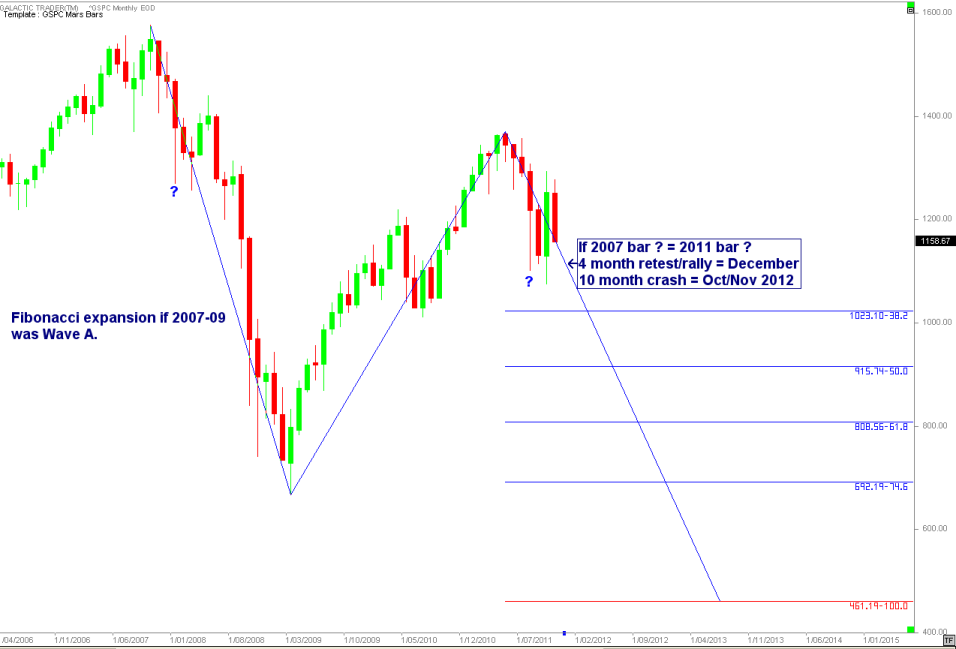
Some time ago, I posted a monthly chart of the Pollyanna index, indicating what I thought was likely.
So, now we've fallen back inside the 236/382 Fibonacci zone - and it's beginning to look unlikely that we will be revisiting the recent highs, but may be on our way to making another low, similar to that first slump following the rally out of the yellow oval on the left of the chart.
If that's the case, we'll probably see only a small, first degree countertrend this coming week, or the next ... then a new Low ... then a rally which could scrape into 22 days or so.
Some time ago, I posted a monthly chart of the Pollyanna index, indicating what I thought was likely.
I put a "?" mark at the bottom of two bars and indicated that if this year's August bar were similar to the 2007 "?" bar, we would have 4 months of stuffing around ... into December ... before a 10-month crash leg developed.
The Fibonacci extension tool shows what is probably a worst-case scenario - if it's a Grizzly in a really bad mood, rather than a docile Sun bear.
However, it is a "potential" one needs to be aware of since no politician in the Western world seems prepared to make the tough decisions necessary to rein in both their own profligate spending and get the cowboy banks under control.
Even under a best-case scenario, the next big freefall is unlikely to peter out much above 800 on the SP500.
Last weekend, I indicated my personal position had been to Short that index at 1285, increase the Shorts at 1268 - and that I did not anticipate having to reverse positions until late next year.
That remains my view. A couple of times in recent weeks, I've also indicated the likely alternative path if I am wrong about the Bear coming back, or at least being delayed into early next year.
Okay, so the broad roadmap is still in play. Let's take a look at where we are currently within the forest.
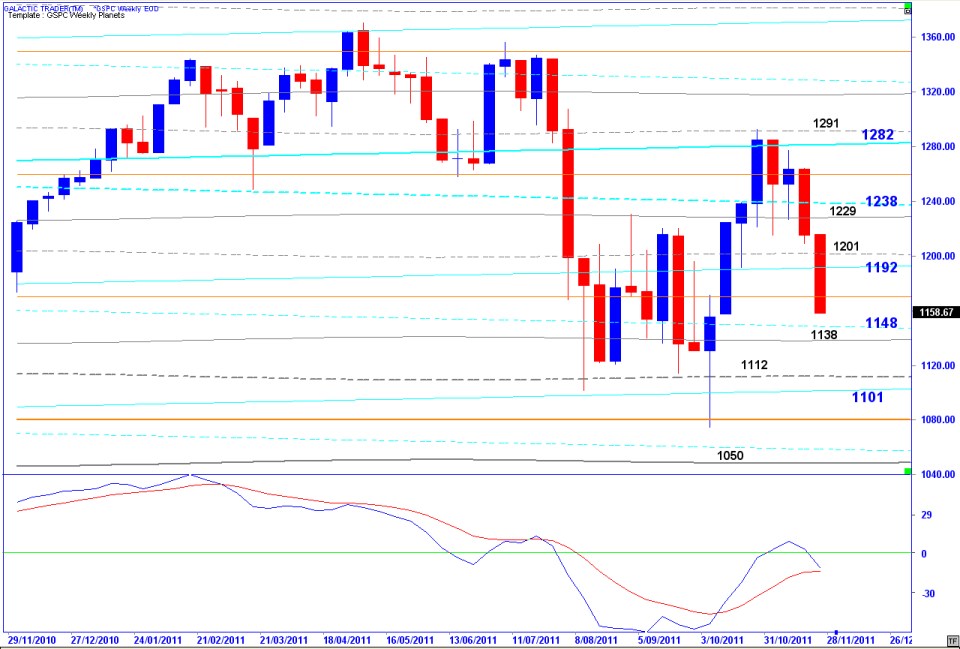
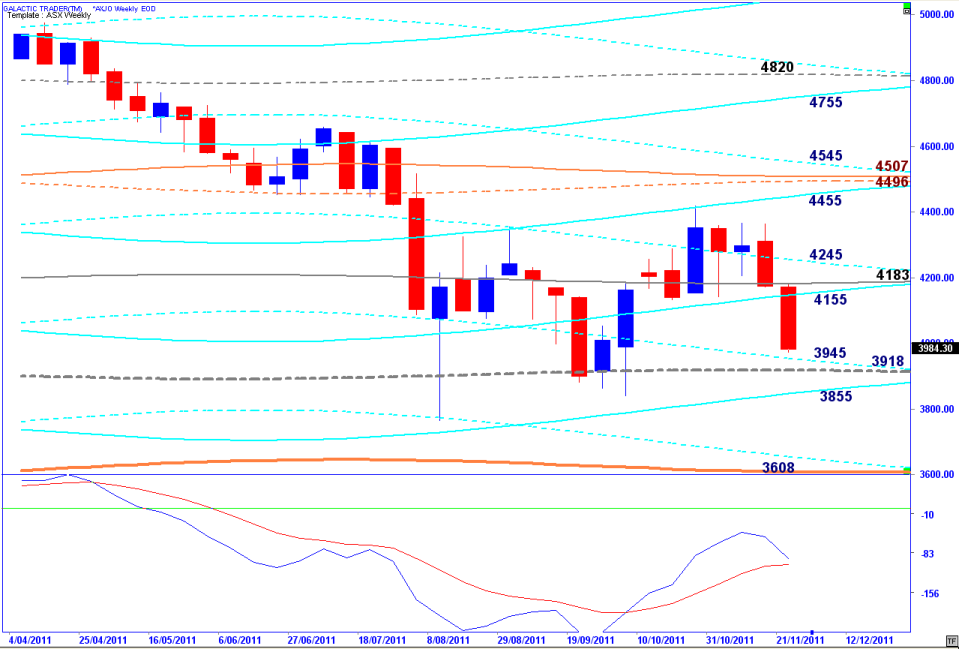
The chart above, as most of you will know, is Polly's Weekly Planets chart, with the Old Gods price lines marked. Just in terms of simple "eyeballing", you'll note that this current panic down does not seem to be of the same order as the huge August collapse.
In fact, it almost looks "orderly" in comparison. I'm actually a big fan of eyeballing - using the KISS principle. What it "looks" like is contained panic ... a lack of buyers, rather than a rush of sellers.
The computers have been playing with the futures markets in overnight trading, trying to gee up some excitement for the official Opens ... but, there has been no daytime follow-through to the upside. Volume has been extremely low and I suspect the computers, guided by the GS Motherboard, have basically been playing with themselves for the past couple of weeks.
That, in itself, is a warning sign. When the big boys find it hard to unload their accumulated crap to the little guys, danger lurks. We can expect them to have another run at unloading their snake oil to the unsuspecting ... and to try to convince their lap dogs at the US Federal Reserve to unveil QE3.
However, we don't want to go - yet again - into all that "news" stuff. The charts are what they are - and will stay what they are until they change. Which they're not showing any tendency to do at this stage.
The European markets aren't showing much difference to what Pollyanna is displaying and to repeat a comment I've made before ... while it ain't broke, we won't try to fix it.
For the moment, the roadmap I outlined several months ago, continues to work as a general pattern for what's happening. There's a chance I'm wrong and everything will turn out hunky dory after all. But, I believe in hunky dory about as much as I believe in Humpty Dumpty.
I think there's probably only one real "rally" left before this ends in tears and shattered dreams. It could be over by New Year ... it might manage to drag itself into late February/early March.
Pay attention to The Idiot signals. He's a lot smarter than I am, y'know. If it had been up to me, I'd have gone Long into the Sagittarian New Moon ... for the simple reason I am a Sagittarian and I can't imagine the FatBoy being bad. However, The Idiot was adamant I stayed Short and who wants to argue with an idiot, eh?
I'll leave you this weekend in the usual manner - with Auntie's Weekly Planet prices.