The death of a friend and colleague
Week beginning November 21, 2011
My friend and fellow Spookies nut, Kaye Shinker, died suddenly on Friday while visiting friends in Mississippi.
Kaye was one of the original financial astrologers, part of a group who got together a few decades ago to pool their knowledge and instigate some research projects.
Kaye was one of the original financial astrologers, part of a group who got together a few decades ago to pool their knowledge and instigate some research projects.


Warm regards .. and Safe trading - RA
(Disclaimer: This article is not advice or a recommendation to trade stocks; it is merely educational material.)
Copyright: Randall Ashbourne - 2011
She wrote four Textbooks for Financial Astrology and for the past few years has been operating the website, www.astrologicalinvesting.com, with another good friend, Marlene Pfeifle.
Kaye was a Sun sign Pisces, with Mercury in the same sign - and she loved reaching out worldwide to teach students. What will be fascinating - if only for fellow astrologers - is that she had a Libran North Node in her 2nd House.
In Vedic (Indian) astrology, Rahu (the North Node, the Dragon's Head) is a point of great evil and suffering. In Western astrology, it is considered the Life's purpose, while the South Node is considered to be the warehouse of natural strengths and talents.
Living our South Node is taking the easy way out - we live on our accumulated strengths. The North Node is the tough path - in spiritual terms, the Soul's predestined journey. In simple symbolism, a Libran North Node in the 2nd House is all about sharing your resources, especially anything related to earning money.
Kaye attacked that journey with vigor - joining with others to build a foundation for modern astrological finance principles, sharing her knowledge through ground-breaking textbooks, writing for her website, and conducting online classes with students across the world.
She was not simply a good friend; she was a good person. Bon voyage, old friend. Many will miss you.
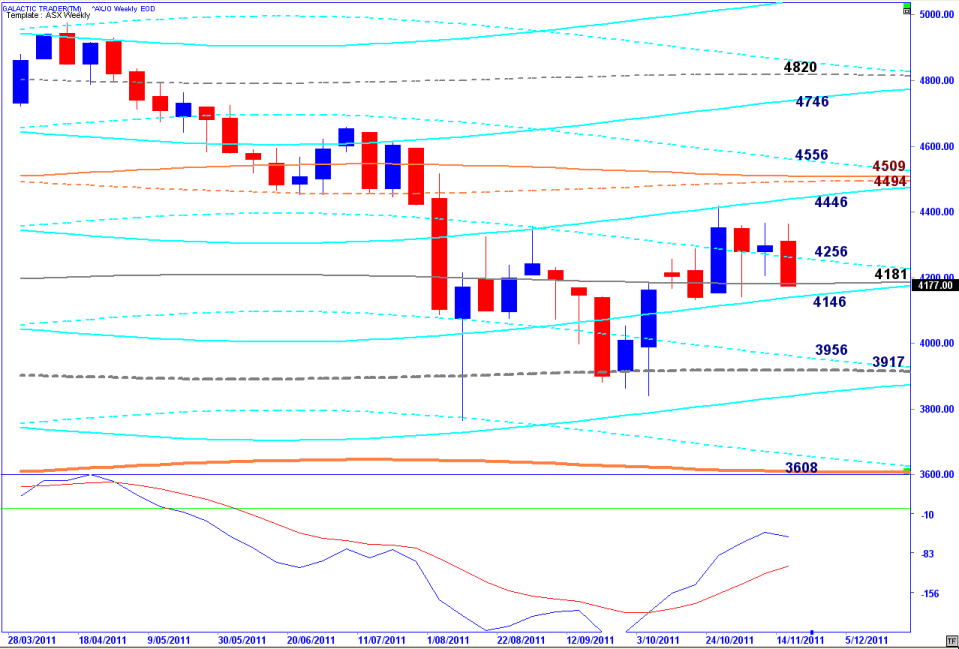
The potentially Bullish triangle that was developing failed last week and morphed into what, so far, is more of the sideways shuffle.
The failure of triangle patterns is not an unusual event - and nor, unfortunately, is getting the astrological interpretations wrong.
Which is why I developed the three-timeframe Idiot system in the first place. The most important lesson for survival in this game is ... always protect your capital! And that is The Idiot's first order of priority.
On the ASX 200, The Idiot is now on a Sell across all three timeframes. It is on a Daily and Monthly Sell on Pollyanna, Wall Street's SP500 ... and the Weekly is on the verge of a Sell.
However, it may not be that simple in terms of piling on the Shorts. Let's get the goat up on the slab and start reading the entrails.
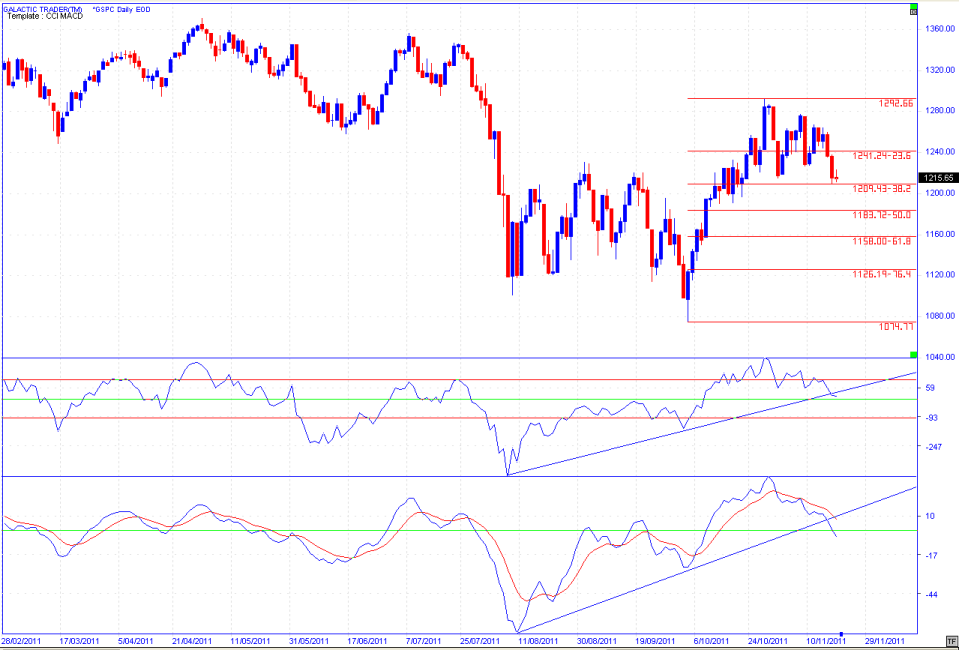
And the first thing we'll look at is the size of the retracement - currently stalled at the minor range 382 level, which leaves the index in a strong position to jump again.
The second thing we'll look at is The Moods of The Moon ... which have not been playing nice!
The second thing we'll look at is The Moods of The Moon ... which have not been playing nice!
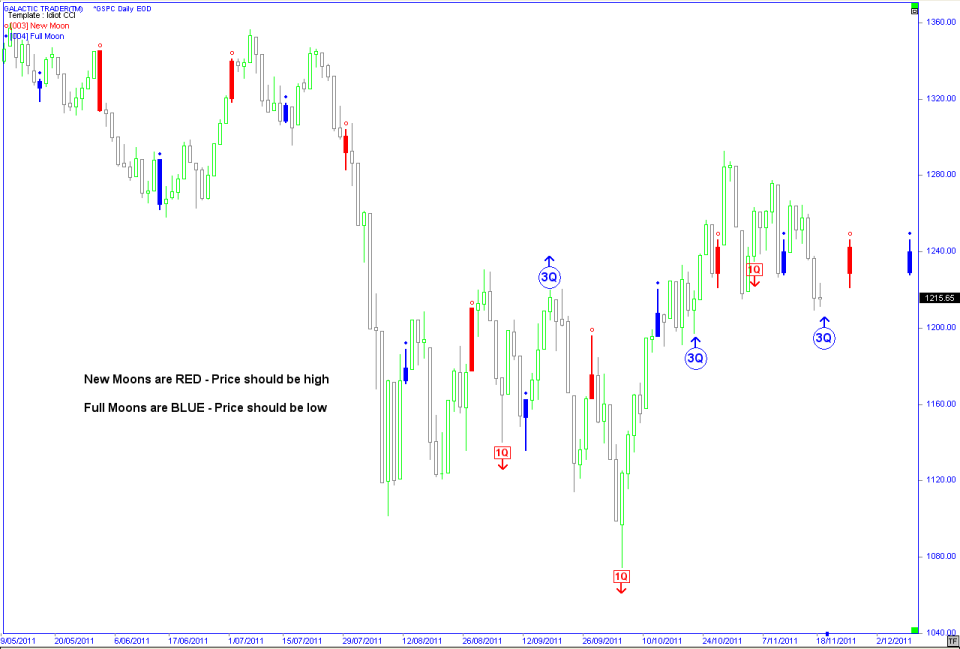
Statistically, over time, New Moons are Highs and Full Moons are Lows ... so the New Moons are red bars (markets should fall or stagnate from that point), Full Moons are blue bars, meaning the market should show a general tendency to rise into the next red bar.
What we can see is that since the early August spike down, the statistical tendency has worked ... the red bars have come in at higher Price levels than the preceding blue bars.
What is unusual is that while there have been sharp drops into the First Quarter Moon dates, they've produced sudden turns, rather than continuing drops into the blue Full Moon dates.
The Third Quarter Moon dates have also been producing turns and not necessarily continuations. Soooo, with the current 3Q happening this weekend, do we get a turn north ... from a lunar phase date AND a strong Fibonacci level?
There is another technical point which lends some weight to the potential. In The Technical Section of the book, I detail the set length of trends and how cyclical trends tend to break into calendar ranges closely tied to 30 days. Well, Friday marked 45 days from the Low ... and offers the possibility of a 45-day low-to-low as part of a 60 or 90 day cyclical rally.
It means the final high could be early December, or late December/early January. For that Timing to work, we would need to see not much more drop in terms of Price and a turn north by Tuesday.
I regret not being able to be absolutely conclusive on the near-term moves. Overall, the broad roadmap and its expected congestion zones and general targets and stuffing-around remains the probable outcome.
With The Idiot on a Sell, or near Sell, across all three timeframes, the danger is to Long positions. As y'all know, I think the probable best-case scenario here is for a marginal new high - and we could be holding our breath to February/March to get it.
Personally, I opened Short positions on Pollyanna at 1285 when the index overshot the 1280 Saturn level - and added to them recently at 1268. I don't expect to have to reverse positions until October/November next year, at the earliest. If there's another rally, and if the oscillators do what I expect, which is to show negative divergence, I'll add to them. I'm not interested in scuttling after these volatile, short-term moves.
Anyway, I'll leave you this weekend in the usual fashion ... Auntie's Weekly Planets chart for the ASX200.
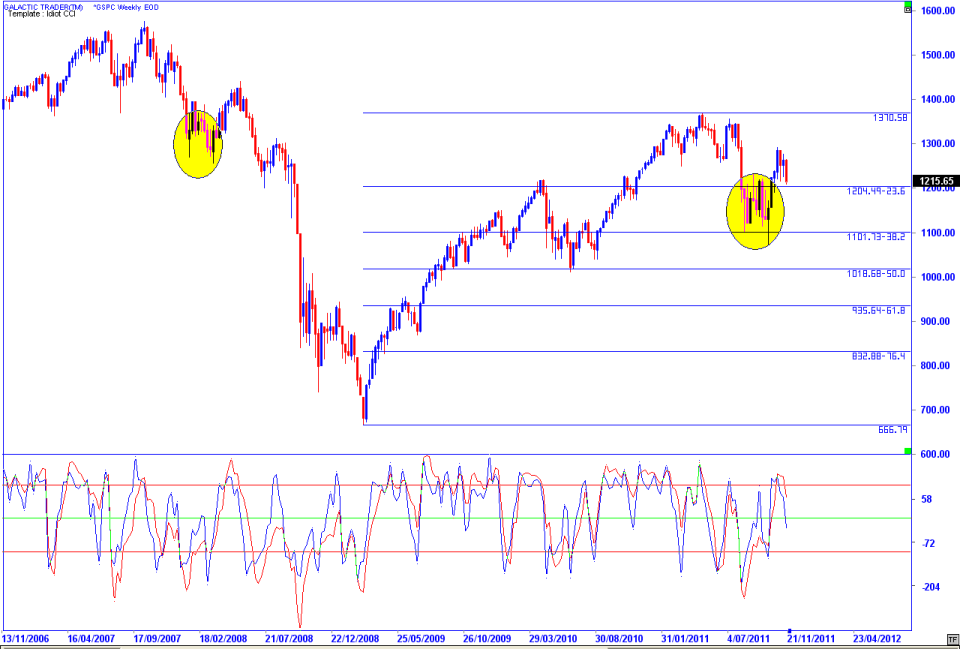
Okay, what we've been working to is a roadmap which called for initial bouncing within the 236/382 Fibonacci Rx range, similar to what happened during the first Bear leg down after the 2007 top.
Then a northside breakout which would stuggle up and stuff around at the bottom level of the previous congestion/topping range.
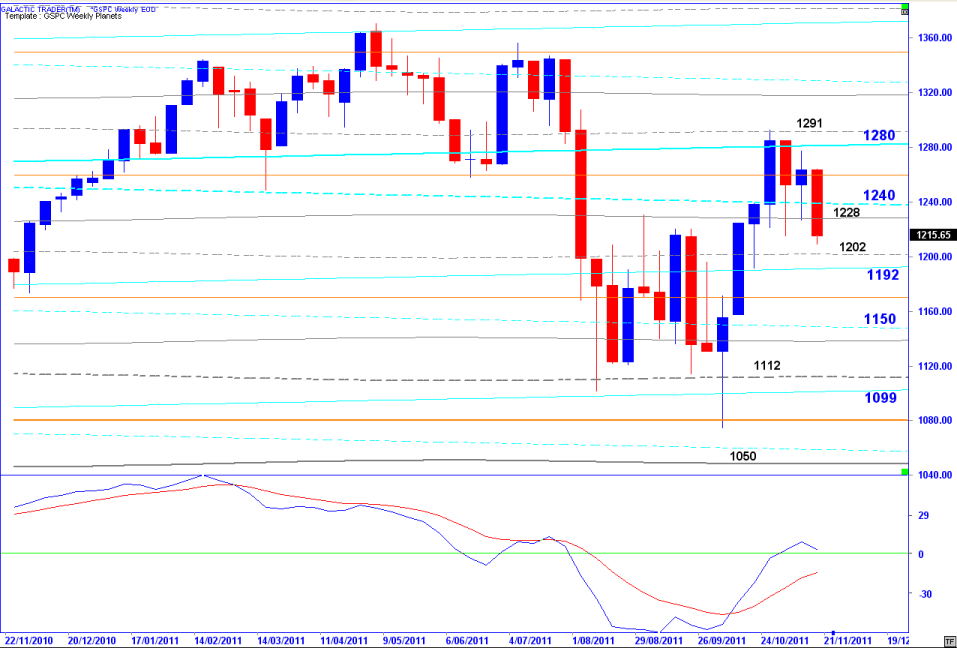
Using our Weekly Planets Chart for Pollyanna, we expected a recovery to at least the 1240/1280 Saturn zone, with potential to go to 1291 ... and possibly into the early 1300s. Using the technical mechanism of the "last low before the high", which I've explained in previous editions of The Eye of Ra (available in the Archives), we knew there would be a natural barrier at 1250 which would be hard to break above and hold.
Then a northside breakout which would stuggle up and stuff around at the bottom level of the previous congestion/topping range.
Using our Weekly Planets Chart for Pollyanna, we expected a recovery to at least the 1240/1280 Saturn zone, with potential to go to 1291 ... and possibly into the early 1300s. Using the technical mechanism of the "last low before the high", which I've explained in previous editions of The Eye of Ra (available in the Archives), we knew there would be a natural barrier at 1250 which would be hard to break above and hold.
So, in overall terms, the SP500 continues to follow our broad roadmap while we try to work out whether The Vacuous Troll is going to collapse now, hang on for some sort of Santa Claus rally ... or keep all of us completely off-balance by dragging this recovery rally out to early next year before going into a swan dive.
We can see from the technical chart above that the index is now coming down to retest the major range 236 Fibo Rx level ... and from the Weekly Planets Chart that a Neptune-to-Neptune shuffle (1291 to 1228/1202) may be underway.
Last weekend, I dealt with les Spookies going into the Solar Eclipse New Moon at the end of the coming week - and ventured the opinion that if one were looking for a potential High, that seemed like a good time. Unfortunately there was a caveat ... that the Sagittarian energy sometimes exaggerates fear, rather than optimism.
This is where the short-term prediction gets tough - and the New Moon could turn into the Low point for a springboard into Santa season.
So, let's drill down.