


Heading into a Solar Eclipse New Moon
Week beginning November 14, 2011
We now head into the 2 week band when, statistically, the biggest gains are made if markets are in Bullish mode.
We head from the stabilising influence of a Full Moon in Taurus into a Solar Eclipse New Moon in early degrees of Sagittarius, an energy force prone to going over the top.
We head from the stabilising influence of a Full Moon in Taurus into a Solar Eclipse New Moon in early degrees of Sagittarius, an energy force prone to going over the top.


Warm regards .. and Safe trading - RA
(Disclaimer: This article is not advice or a recommendation to trade stocks; it is merely educational material.)
Copyright: Randall Ashbourne - 2011
Normally, the Sagittarian energy is almost boundlessly optimistic. There are, though, occasions when it swings into reverse and what gets exaggerated is fear, rather than hope and an adventurous spirit.
Often, it's the Santa Claus rally which gets underway around this time each year as the Sun, Mercury and Venus are frequently close to each other, having a rollicking good time of it in Jupiter's favorite playground.
This time round, Mars is also in play with Jupiter - making a trine to the big fella this coming Wednesday and a parallel on the day of the Saggy Solar Eclipse. Both of these aspects suggest an abundance, perhaps an over-abundance of positive energy - because the symbolism of the trine is an easy and smooth flow of energy and a parallel has a similar meaning to a conjunction, when two forces merge temporarily to create a sum greater than the individual parts.
If one were looking at the potential Time for a top, it's that one that's the most obvious. Bull markets have a tendency to fall over on good news - and the sheer weight of the energies in play at the Sagittarian New Moon eclipse suggest a likely peaking of good news.
There is still a chance I am wrong that this is a recovery rally within a developing renewal of a big Bear phase ... and also a chance that I'm wrong only in the timing - ie: this might drag on through November and into late February before the Bear bites back.
So, we will turn our attention away from les Spookies and towards the technical conditions.
Overall, the patterns we've discussed at length for many, many weeks are still in play ... that we would have a fast rally out of the successful move to struggle down and trade against the early August spike ... that the fast rally would be followed by a period of downwards to sideways shuffling ... and that would give way to a final exhaustion run higher before markets rolled over into a crash leg which runs into October/November of 2012.
Overall, the patterns we've discussed at length for many, many weeks are still in play ... that we would have a fast rally out of the successful move to struggle down and trade against the early August spike ... that the fast rally would be followed by a period of downwards to sideways shuffling ... and that would give way to a final exhaustion run higher before markets rolled over into a crash leg which runs into October/November of 2012.
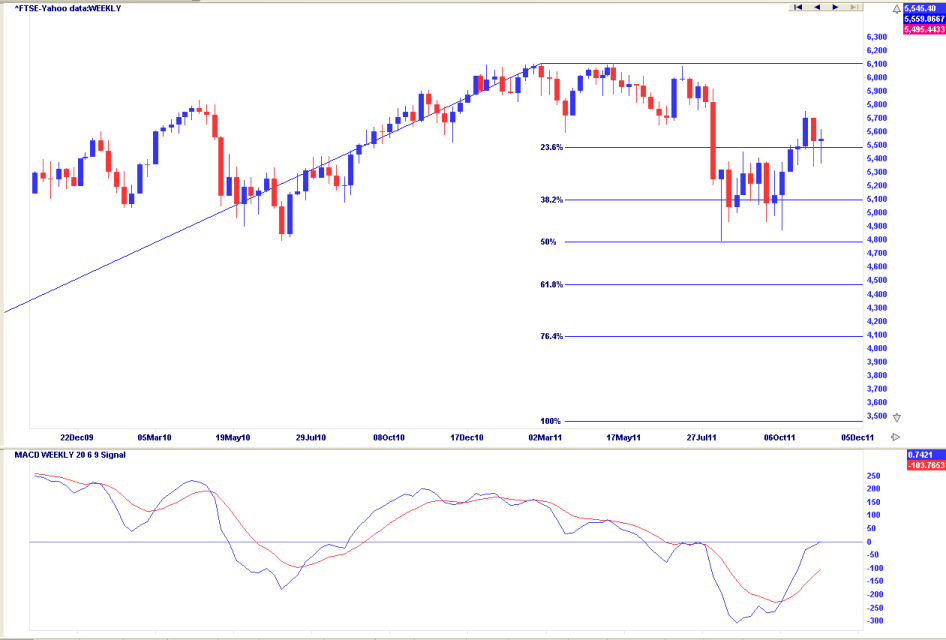
The FTSE is mapping out a similar pattern to the SP500 ... consolidating on top of the 236 Fibonacci Retrace level and with weekly bars standing tall on their tails, indicating buying support is coming in at a high level.
That's a fairly superficial view though, since the volume is running way below average. Just incidentally in that regard, there were reports during the week that Australian fund managers are sitting on cash levels of 30%, 50% and even higher - a similar position to just before the 2008 crash.
It helps explain the relative underperformance of the ASX 200 where current forward Price/Earnings ratios are at a low 12%. If the fund managers are hoarding cash, and believing that "cheap" is going to get even cheaper, there's not enough boodle in individual investor accounts to drive the market higher.
But, but ... back to the FTSE.
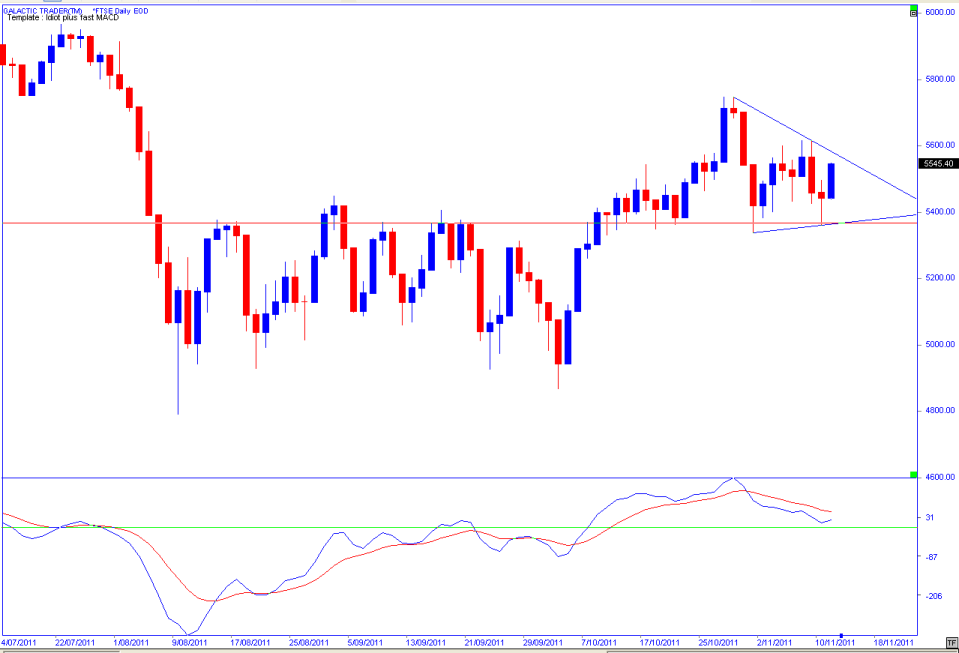
Looking at the daily chart, we can see the "line in the sand" - the red horizontal barrier which kept a cap on prices during the bottoming process from August to October and which has since served as Support, rather than Resistance.
I traced out in blue the potential triangle being formed. While I think it's likely we will see a breakout, rather than a breakdown, there's probably not a lot of upside left ... unless, as I outlined a couple of weeks ago, I'm totally wrong about this being a cyclical recovery rally and it is, instead, a new Bull leg developing.
I've outlined many times, in both astrological and technical terms, why I think it's more probably just a relief rally in a developing Bear and, as y'all know, I tend to ignore the whole "news" thing and try to concentrate on the technical readings of the charts ... with the occasional entrail-reading thrown in. It's not that I don't actually read the news, just that I don't give it any weight in deciding whether to go Long or Short.
Part of the problem is that we've been hearing and reading about the state of the PIIGS for so long. Now we're back to the Italy part of the PIIGS play ... and pretty soon it looks as if it might be F'ing PIIGS, as questions crop up about France ... and Germany!
I've seen an interesting piece which raises the possibility that sovereign debt is the "now" equvalent of the sub-prime loans crisis of 2007-08. And, as y'know, that is exactly what we strange Spooky types have been talking about in relation to the whole Saturn/Uranus/Pluto cycle.
The last time round, governments bailed out the banks ... thus sinking their national balance sheets deep in the doo-doo. In most of the Western world, the Baby Boomers are now entering retirement age ... a drain on the tax base, rather than building it up each year, as happened from the 1950s into the current period.
What I find deeply ironic and endlessly amusing is that it's those evil, socialist, nanny-State countries which have low debt! Sweden is 42% of GDP, Denmark 43%, Finland 48%.
Those doyens of the free market, the leaders of the free world, the militant enforcers of democracy (when they can't even print ballot papers properly) ... the USA ... has a debt to GDP ratio of 98.6% and growing every day.
Tsk*tsk ... I digress from what we're here for! Okay! Back to the FTSE ... triangle will probably produce a short, upside breakout; watch out for the red line in the sand.
So far we've had 2 weeks of the sideways shuffling - with last week spinning inside the range of the previous week in Wall Street's main index, the SP500.
Price appears to be forming a triangle pattern and that has some important implications because a triangle is the penultimate move in any direction ... ie: it's a precursor to the final move before a major trend change. In this position, it indicates a final breakout higher is getting nearer.
Let's look at the daily chart: -
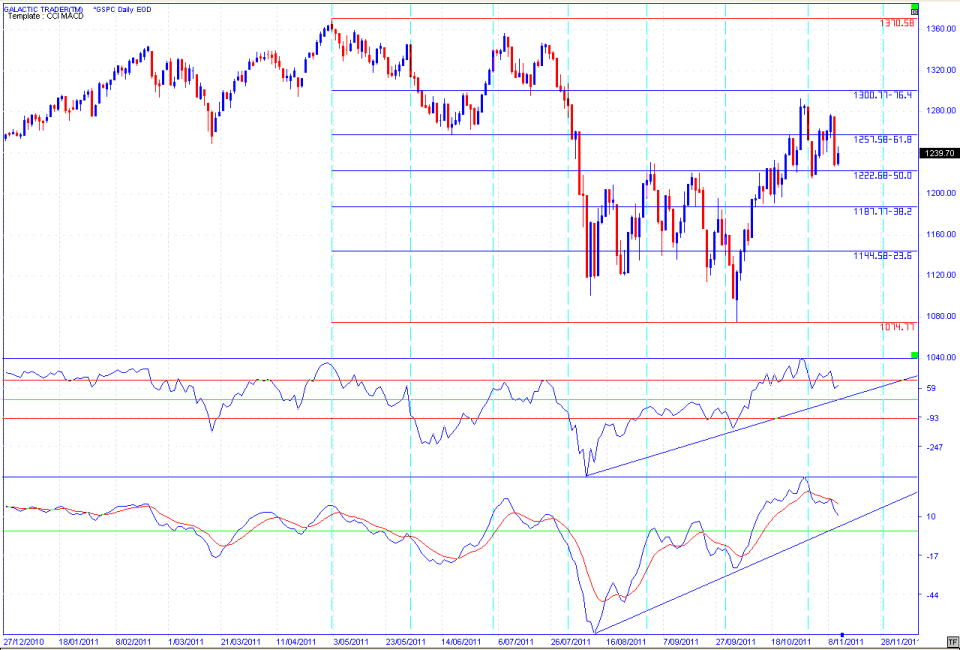
I don't often use daily charts, but we looked at this one last week because it contained an excellent real-time example of how positive divergence in the oscillators can be used to forecast when it's safe to get back into a trade.
And I made the point that with such a strong example of positive divergence between the August spike down and the final Price low in early October, we would probably need to see an incidence of negative divergence before being sure this recovery rally had reached its final Price peak.
We're still waiting to see whether that develops. The oscillators have turned, but have yet to breach the downside of their rising trendlines. I still think it's likely we will see a marginal break above 1293, perhaps into the early 1300s - but that High will not be confirmed by either one of the oscillators.
And that will be the signal to get the hell out of Dodge!
Well, that's the probable roadmap we've been following since August and it's still in play at this stage.
If we were to get a sharp spike in the Pollyanna index, especially between 3Q Moon and the Saggy Fun Fest on November 25, into the range 1304/1320s ... and it happened with clear divergence signals in the oscillators ... I suspect it will be out of Dodge and into the Badlands very fast.
Now, let's pay some attention to Europe where leaders are toppling and even Silvio Berlusconi seems prepared to fall on his sword. So to speak.
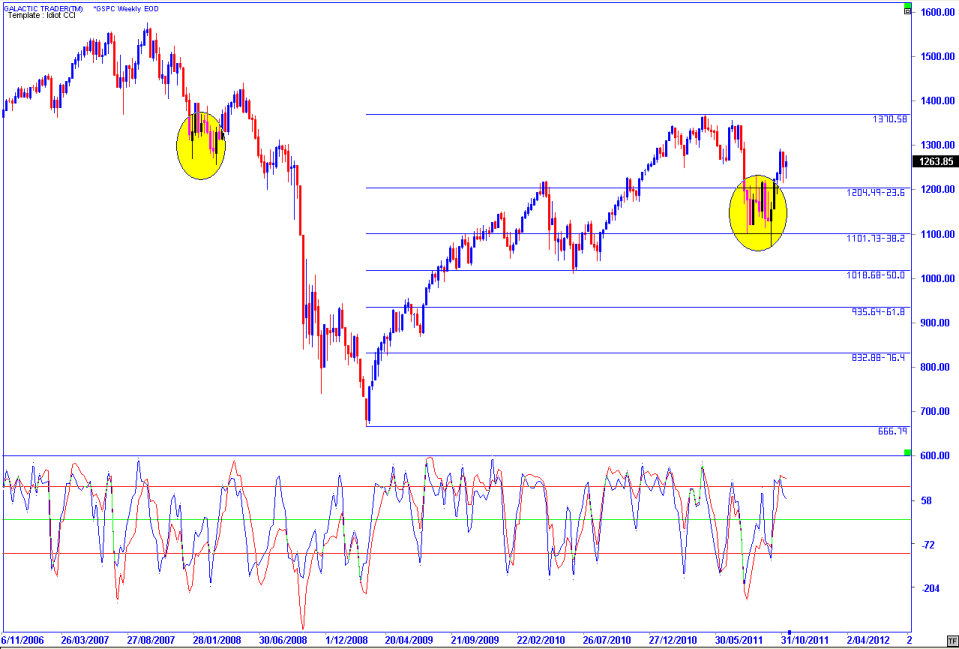
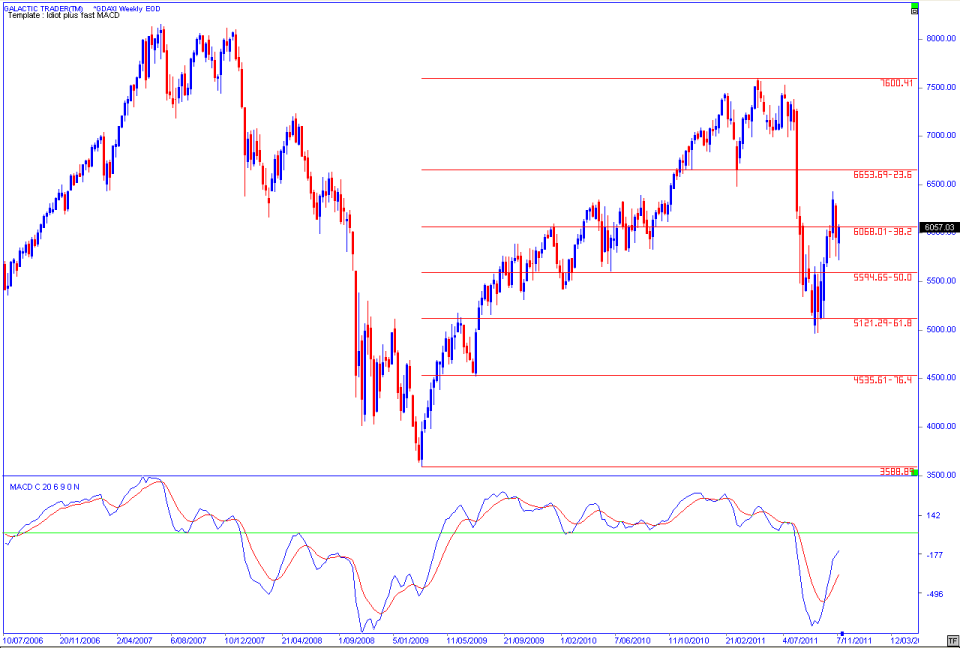
The chart above is the weekly of the main German index, the DAX ... unable, so far, to lift itself back inside the range of the topping pattern which preceded the drop.
Have a quick scroll back to the yellow ovals on the Pollyanna chart at the start of this weekend's report. Now, have a close look at how the DAX, too, appears to be making the same pattern - by NOT being able to get back into the range of the topping pattern!
And if this does turn out to be only the first drop in a Bear which has at least another year to run, world finances might get very ugly indeed.
Let's take a look now at India's Nifty index and Singapore's STI ... because Singapore shows a potential pattern for this scenario to drag out into late February/early March, the timeframe for a run past the Solar Eclipse.
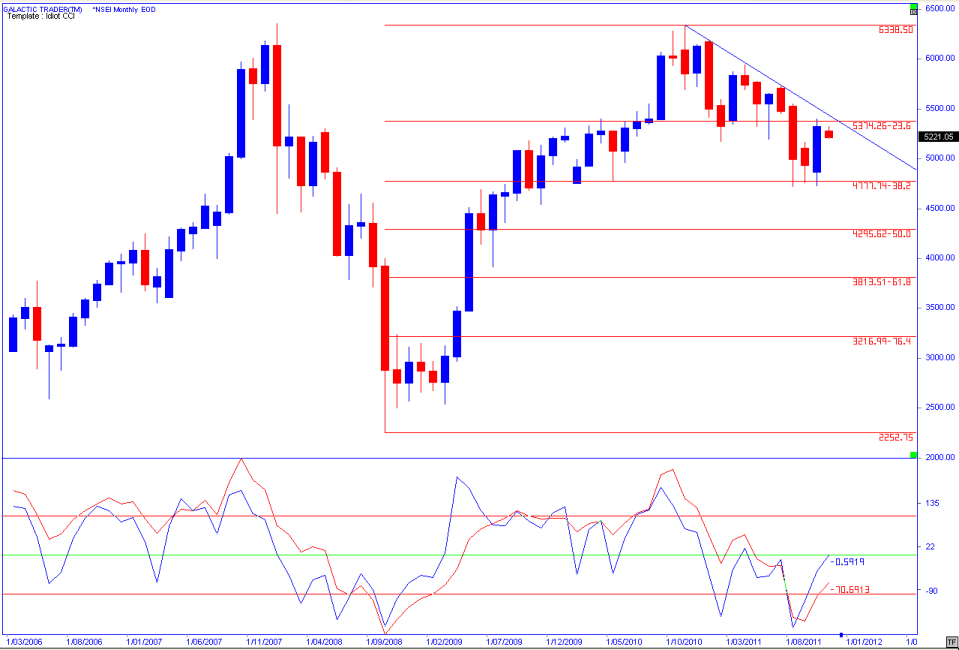
We'll stick with the big picture, monthly view of the Nifty - where the index hasn't yet broken above the downtrend line and, according to my reading of the weekly planets chart relevant to the index would have real trouble breaking above 5400, but could run to 5700 if it manages to do so.
The next chart is daily bars of the STI set against weekly planet lines.
The next chart is daily bars of the STI set against weekly planet lines.
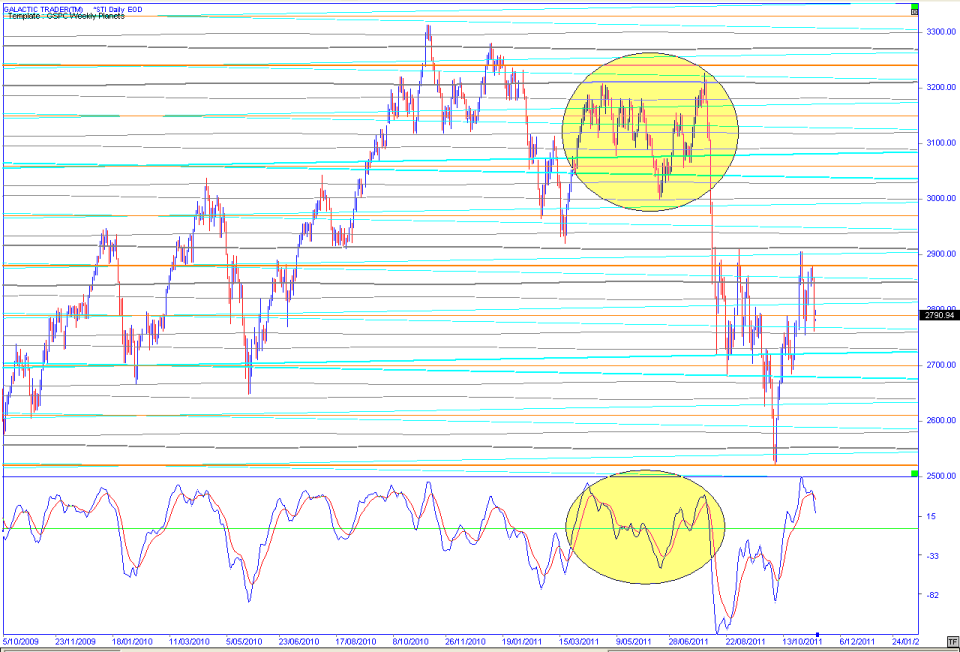
I've marked on this chart an example of what I've talked about over the past couple of weeks - one of them being making a marginal new Price high to the pattern, with a lower MACD peak. And this really is a prime example of why I caution to get the hell out of Dodge when you see this happen on a chart!
The other is that it's an example of what I was talking about when I mentioned the probable pattern of a fast rally out of the struggle down against the spike ... followed by a confusing, downwards to sideways grind ... and a final, blow-off rally to only a marginal new high, before the crash.
Now, I wouldn't be at all surprised to see something very similar to this take shape over coming weeks in the EuroAmerican indices. This is a chart well worth studying and relating to the lessons in The Technical Section of The Idiot & The Moon.
Okay, almost time to finish up for the week. Here's the ASX200 Weekly Planets Chart: -
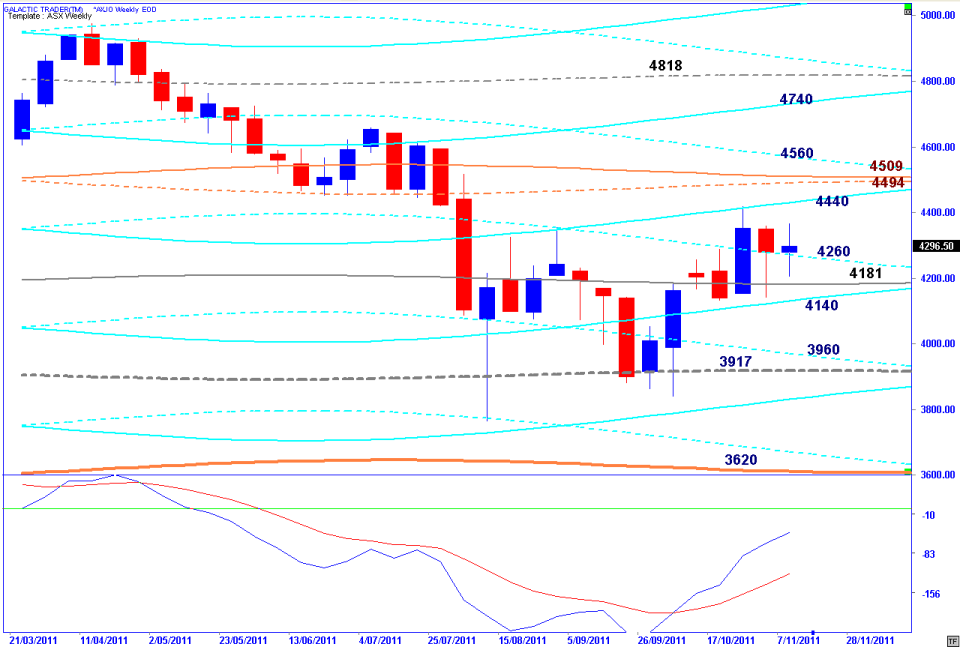
Not a lot to say, really. The Price targets are fairly obvious if there's to be a run up into the New Moon - as are the planetary Support levels, with Saturn continuing to hold the closing prices.