
Chicken Little versus Sun-Jupiter smooch
Week beginning May 7, 2012
Markets behaved last week generally in line with the "normal" tendency of The Moods of The Moon - a fast drop into this weekend's Full Moon.

Copyright: Randall Ashbourne - 2011-2012
For the moment, though, I want to go through some of The Spooky Stuff, which suggests the Bulls are not quite ready to cede to the Bear.
Last weekend, I indicated negative news was likely with the 1Q-FM lunar cycle - reiterating there is a "distinct tendency" for markets to drop in that Moon phase. And I pointed out the 1Q weekend arrived with a Sun trine Pluto aspect - "which is a relatively minor influence with a positive bias" - but that this weekend's Full Moon would coincide with Mercury opposing Saturn - "more likely to be a dose of unwelcome reality".
I wrote: "It will coincide with Mercury opposing Saturn, indicating investors will turn their minds again to the challenges facing future growth prospects."
Well, this weekend's headlines say it all: "NEW YORK (Reuters) - Wall Street ended its worst week this year with a sharp selloff on Friday after a slowdown in job creation in the world's top economy raised the biggest question mark yet about the prospects for U.S. growth."
I also stressed the point last weekend that these were only minor, short-term astrological influences and that the real planetary game-changers arrive mid-month. I made some reference to these in mid-April in the edition headed "The sign of the Bull highlighted again", when I warned the Bears might be growling prematurely.
So, let's review the outlook.
The sharpness of the drop has many commentators back in Bear mode, expecting a resumption of the downtrend.
And they may be right; we'll take a look at the technical conditions in a little while.
And they may be right; we'll take a look at the technical conditions in a little while.


The problem, as I see it, for a resumption of the Bear trend is the Sun's approach to a conjunction with Jupiter. I remarked last month that the Sun's annual entry into Taurus had the potential to reignite the March energy of the Grand Toro Love Fest between Venus and Jupiter - and that the effect could last into mid-May, as the Sun made its annual conjunction with the head honcho of the Old Gods.
That aspect is now close. This Wednesday, New York time, Mercury makes the transition to Taurus as the Sun parallels Jupiter. This develops towards a potential climax over the next couple of weeks, heading into the Solar Eclipse New Moon, in Gemini, on May 20.
We took time off a couple of weekends ago to look at other markets and dealt last week with the relatively minor influences of the current lunar phase, because I indicated there was nothing much happening astrologically.
But, that now changes. The Sun is heading for a major kissy-smoochy with Jupiter, Venus will go Retrograde, Mercury enters the stability of Taurus, and both Mercury and Mars act in a united fashion to make a Grand Trine with Pluto.
My interpretation of this sort of high-energy Spooky Stuff is that it is likely to herald the arrival of a significant trend change, and my leaning would be more towards a final high in the markets, rather than an intermediate low.
So, let's turn our attention to the technical conditions ... and I'm going to turn the usual format around.
Safe trading - RA
(Disclaimer: This article is not advice or a recommendation to trade stocks; it is merely educational material.)
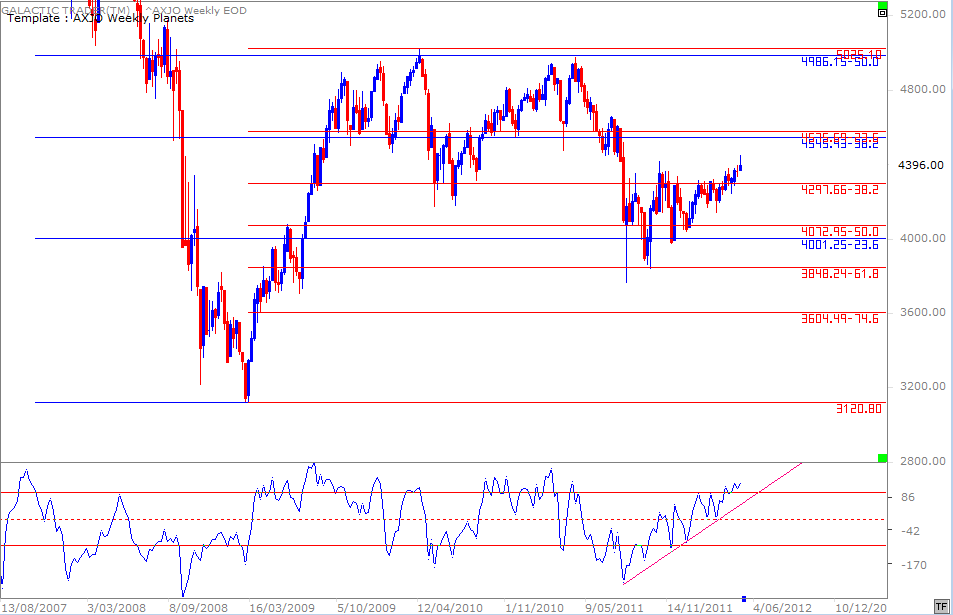
We will begin with a weekly of the ASX200 - the chart I occasionally describe as a sort of Fibonacci cheat sheet. For many weeks the index struggled against the overhead Resistance around 4300 ... but we discussed the potential for a breakout as the medium-range Canary maintained its rising trendline and gave no sign of wanting to fall off its perch.
The significance here is that there is still no warning croak from the Canary.
The significance here is that there is still no warning croak from the Canary.
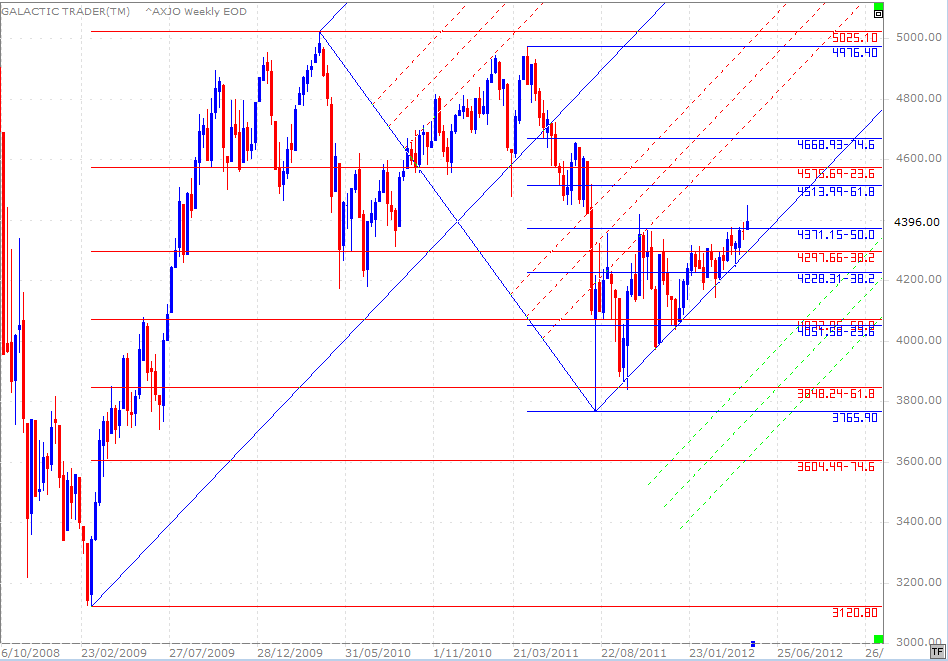
Taking another view of the index, we see the ASX finally hit a new High last week, breaching above the 50% barrier of last year's plunge. Now, it is true that Auntie has not performed since last August-October in the way other indices have, especially the Americans.
She is not prone to be Pollyanna one minute and Chicken Little the next. Still, I ask myself: Would Auntie be displaying optimism if she believed los Yanquis were in the throes of an imminent death dive? And I think it's probably unlikely.
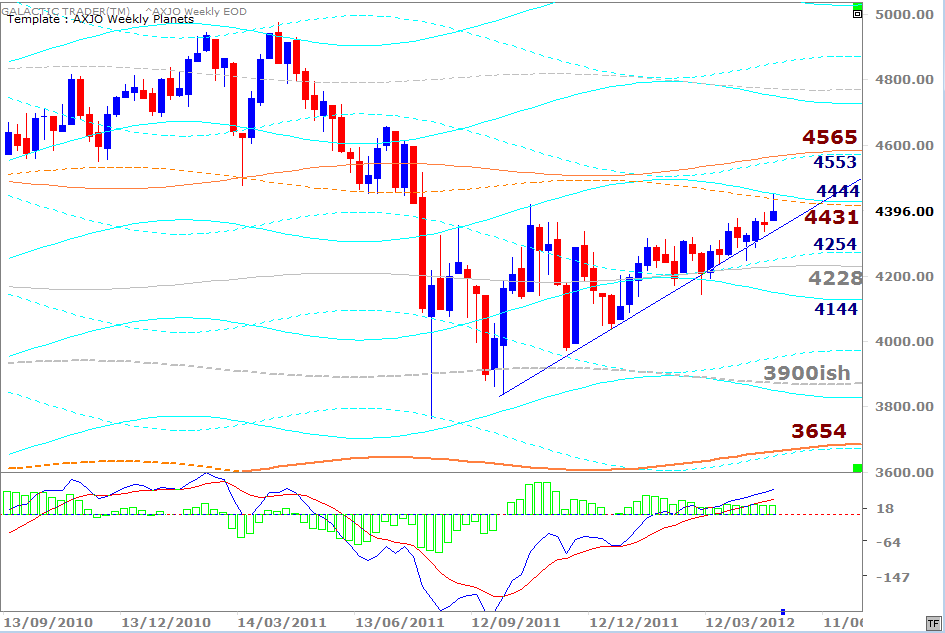
Discussing Auntie's Weekly Planet charts last weekend, I said: "The old girl is managing to close each week above the rising trendline ... there is little disagreement from the fast MACD, though the histograms continue to shrink ... and the overhead planetary targets have not yet been reached."
She is not prone to be Pollyanna one minute and Chicken Little the next. Still, I ask myself: Would Auntie be displaying optimism if she believed los Yanquis were in the throes of an imminent death dive? And I think it's probably unlikely.
Discussing Auntie's Weekly Planet charts last weekend, I said: "The old girl is managing to close each week above the rising trendline ... there is little disagreement from the fast MACD, though the histograms continue to shrink ... and the overhead planetary targets have not yet been reached."
And above is how the week evolved. She did finally hit the overhead planetary targets.
Okay, so Auntie isn't clanging the evacuation alarms, though none of us like to see a weekly candle left hanging by a thread from a planetary ceiling.
So, let's look at the FTSE for some further clues.
Okay, so Auntie isn't clanging the evacuation alarms, though none of us like to see a weekly candle left hanging by a thread from a planetary ceiling.
So, let's look at the FTSE for some further clues.
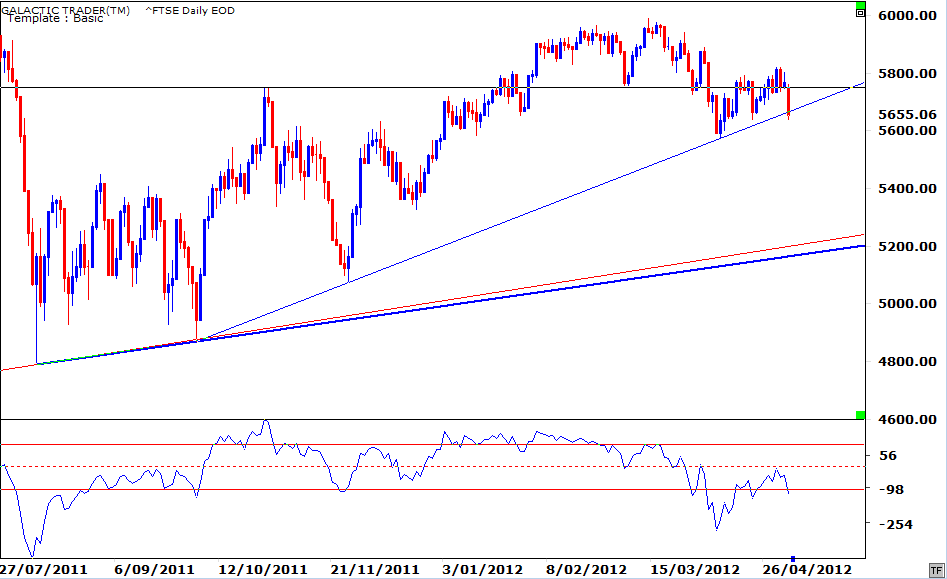
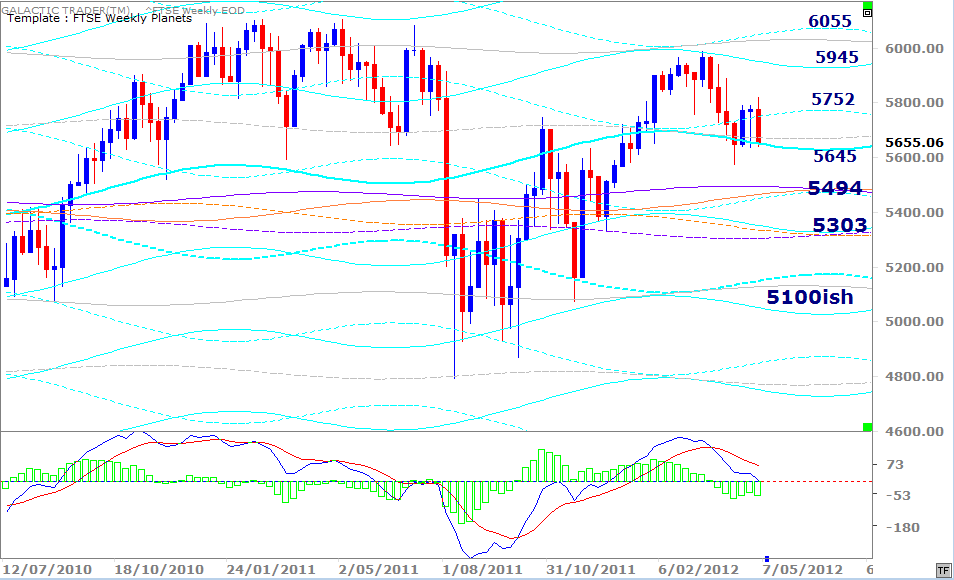
I indicated last weekend that the London Bulls were trying to keep alive the angle of the shallow blue trendline - and late in the week we saw our first downside breach of that line. I also showed the Footsie Weekly Planets chart - "with some useful Price targets - in both directions"
And, as with Auntie, they were useful. Uhm, if you believe in the power of Old Gods!
And, as with Auntie, they were useful. Uhm, if you believe in the power of Old Gods!
Below is the FTSE's monthly, using Gann angle lines from the Bear bottom in 2009 and Gann price divisions from the peak of the Bull run to the bottom of the Bear plunge. At this stage, the recovery from the Bear Low is not over until we get a monthly close below the level of the primary Gann angle, which underpinned the closing prices during last year's slump.
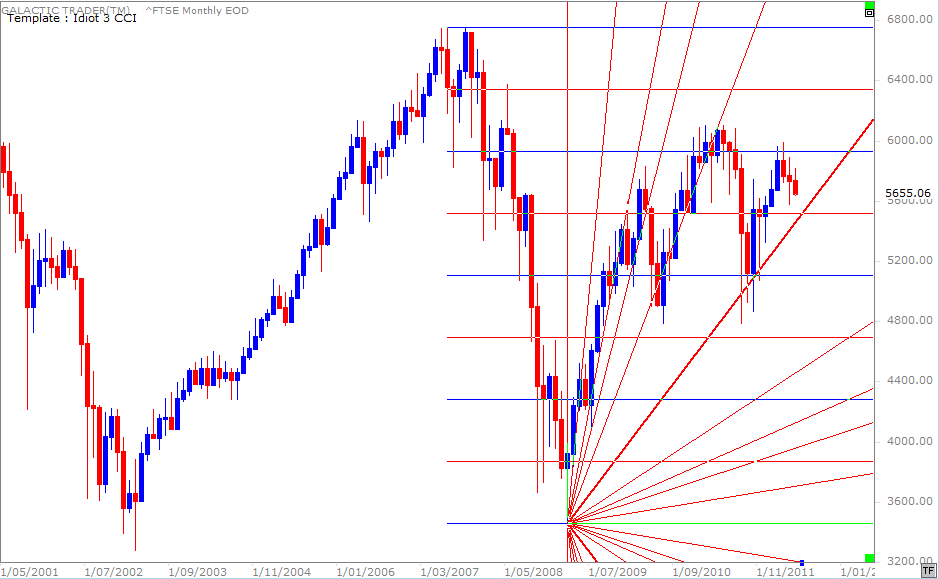
Okay ... let's go to Wall Street and the SP500.
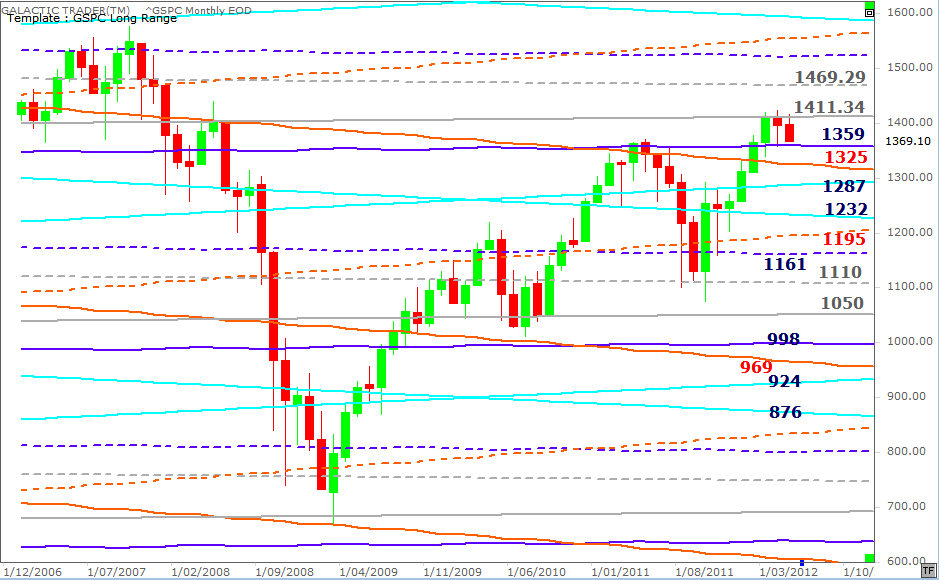
We'll begin with my Pollyanna Long Range Planets chart. For the third month, the index is playing within the territory marked by Neptune on the upside and Pluto on the downside. We use this one only to see the planetary price markers for major moves.
We discussed this chart in last weekend's rather simplified - no-angst - edition. As I said last weekend, all we really needed to know was exactly where the Bulls had drawn their line in the sand ... and it's pretty much where last week's decline into the Full Moon stopped.
The oscillator continues to deteriorate and from a purely technical reading it sure looks like the Chicken Little roadshow is back in the Big Apple. The Bulls need to step in here and defend their line. And do it fast.
The oscillator continues to deteriorate and from a purely technical reading it sure looks like the Chicken Little roadshow is back in the Big Apple. The Bulls need to step in here and defend their line. And do it fast.
Now, I published Polly's Weekly Planets last weekend and the long range planetary price chart is above. If you want to see the intermediate ranges, look up last weekend's edition.
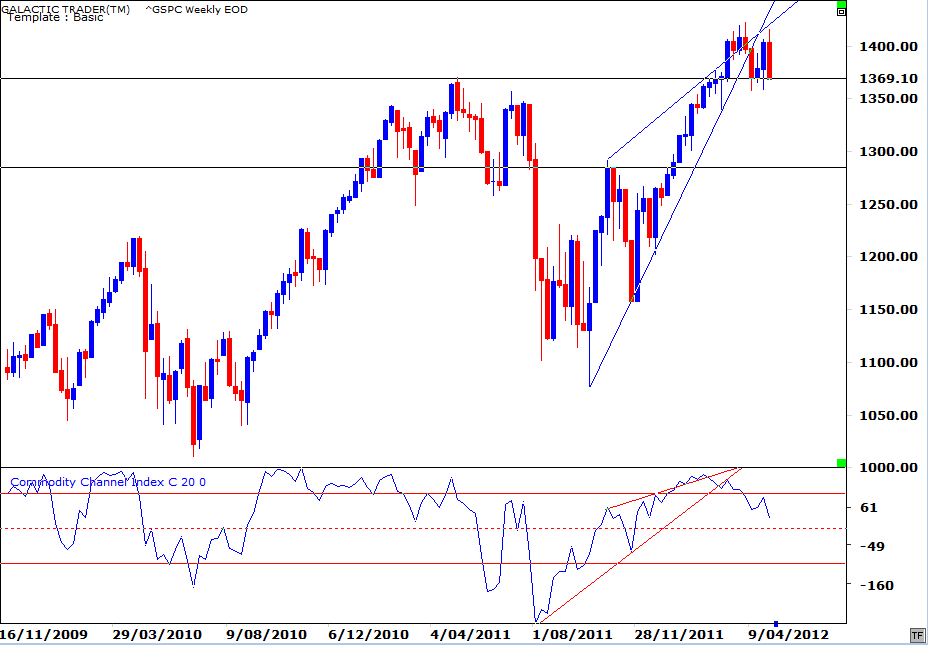
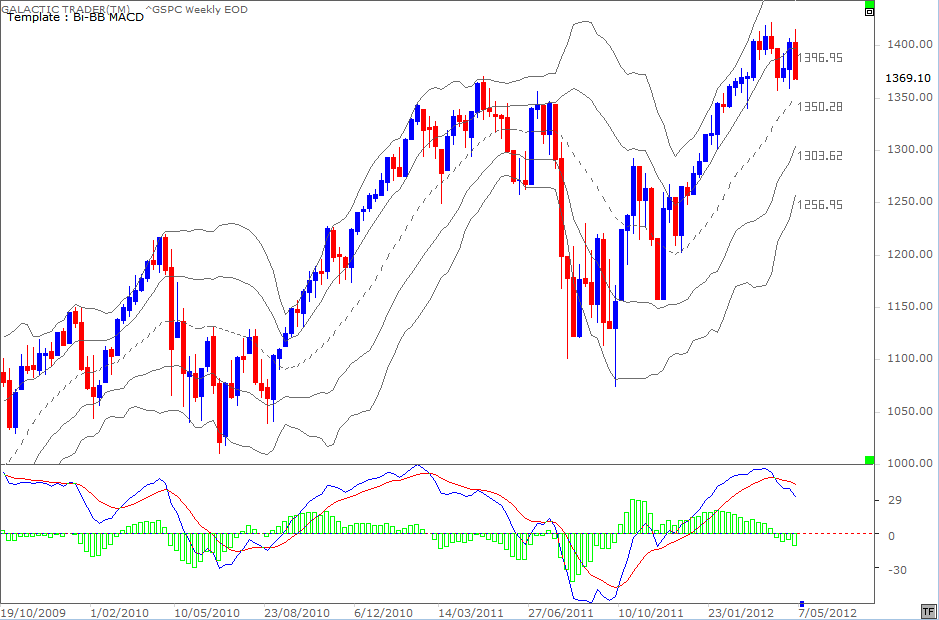
Instead of the Weekly Planets, I'm putting up a weekly Bi-BB, which shows some alternative targets. The fast MACD signal has gone negative ... the histograms have been painting up negative divergence signals since last year. So, the rally may have run its course.
But, it did happen as expected going into a Full Moon where the bad mood effect was increased by a Mercury opposition to Saturn. And, consider what is normal behaviour for the fast MACD. No need to look up the relevant section of the book ... just glance leftwards to its performance during last year's three-thrust Highs.
We had a negative cross in the signal, followed by a higher Price high that was not confirmed by the MACD. That is "normal" and is explained in the book. So, the odds are the Bulls are most probably not finished Bear baiting. And if they're not, I'd expect the final Highs to come in over the next couple of weeks, as we get the Sun meeting up with Jupiter and the Gemini Solar Eclipse.