Price may be near, Time probably not
Week beginning May 28, 2012
Some commentators this weekend are already calling the end of the downtrend in American markets.

Copyright: Randall Ashbourne - 2011-2012
In terms of the Spooky Stuff, the only major aspects in the immediate future are the Lunar Eclipse Full Moon and Neptune turning retrograde, both of which are due on Monday week.
My research indicates neither is a particularly reliable guide in the current market conditions and because of that, I see no reason to doubt the June date at this stage.
In a moment, we'll look at a few charts. It may be that markets are trying to find a bottom around the current price levels, though the Support levels don't appear to be particularly strong - from either a planetary or Fibonacci viewpoint.
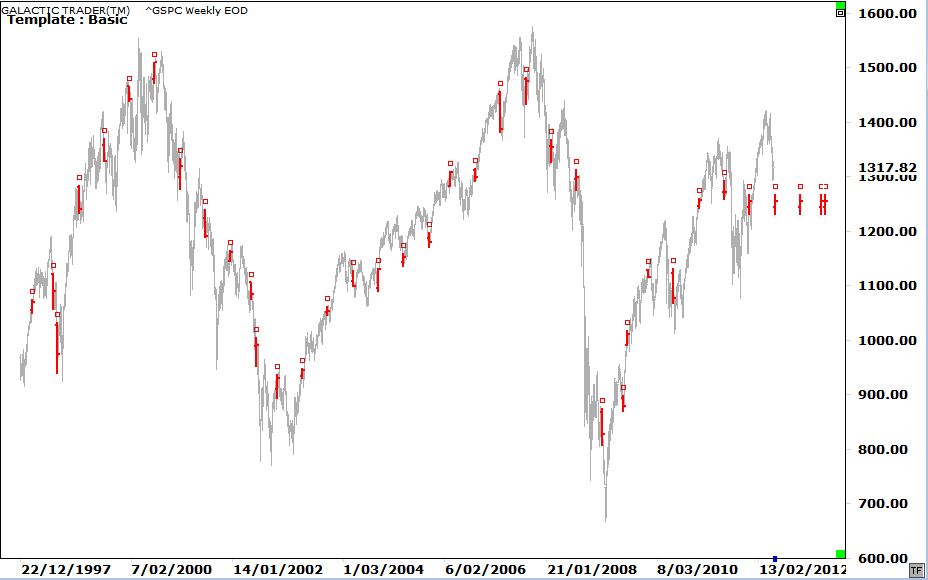
The first chart we'll look at is a weekly of the SP500, showing its performance following past instances of Lunar Eclipse Full Moons.
My research indicates neither is a particularly reliable guide in the current market conditions and because of that, I see no reason to doubt the June date at this stage.
In a moment, we'll look at a few charts. It may be that markets are trying to find a bottom around the current price levels, though the Support levels don't appear to be particularly strong - from either a planetary or Fibonacci viewpoint.
The first chart we'll look at is a weekly of the SP500, showing its performance following past instances of Lunar Eclipse Full Moons.
Others are suggesting at least a significant bounceback is underway.
Personally, I think both calls are premature.
I indicated last weekend that the next significant trend change date in my forecast for the year does not arrive until June 25, though the Bradley Model expects a trend shift a little earlier - on June 12
Personally, I think both calls are premature.
I indicated last weekend that the next significant trend change date in my forecast for the year does not arrive until June 25, though the Bradley Model expects a trend shift a little earlier - on June 12


Safe trading - RA
(Disclaimer: This article is not advice or a recommendation to trade stocks; it is merely educational material.)
We get a couple of these every year and there are some astrologically-minded researchers who believe they're able to stop-and-turn a panic drop.
Well, it just ain't so. Lunar Eclipse Full Moons are not too shabby at forecasting an intermediate downtrend Low during a sustained Bull market.
But, the chart above shows they do NOT work as a reliable Low once markets go into a Bear phase. Of the seven Lunar Eclipse Full Moons since the 2009 Low, only two coincided with a weekly Low in the uptrend.
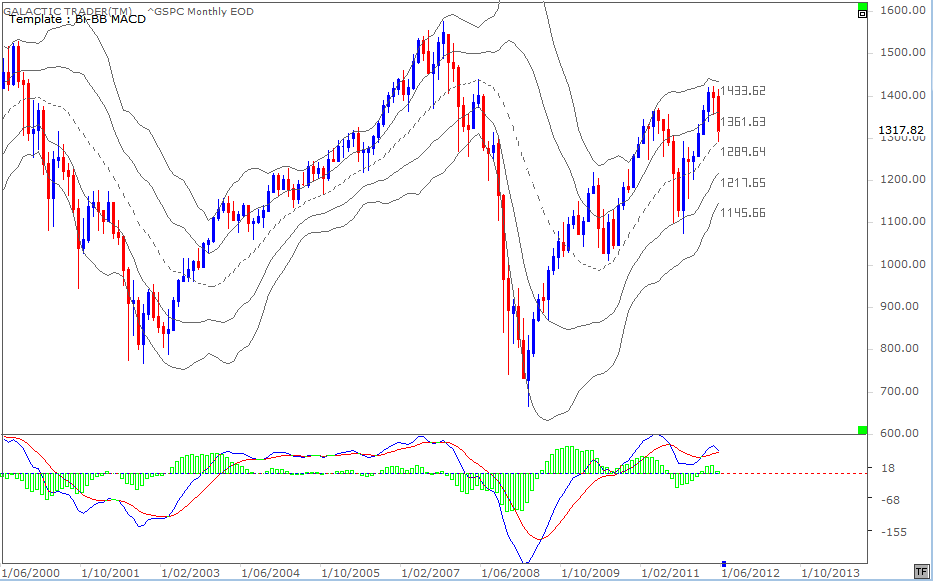
Our next chart is a monthly Bi-BB of the 500:
Well, it just ain't so. Lunar Eclipse Full Moons are not too shabby at forecasting an intermediate downtrend Low during a sustained Bull market.
But, the chart above shows they do NOT work as a reliable Low once markets go into a Bear phase. Of the seven Lunar Eclipse Full Moons since the 2009 Low, only two coincided with a weekly Low in the uptrend.
Our next chart is a monthly Bi-BB of the 500:
Each successive price high in the index since the 2009 Bear Low has been accompanied by a lower peak in the MACD histogram - a fairly classic sign of building negative divergence.
Also interesting is the volatility of the price drops. Notice that during the 2002-2007 Bull run, there wasn't a single monthly close below the middle BB. The recovery rally from 2009 started the same way - but the behaviour changed during the spikes down last August and October.
I've used the Pollyanna Long Range Planets chart recently and you can find its price levels in the Archives. I use the monthly Bi-BB here for an alternative view of the Support and Resistance levels now in play.
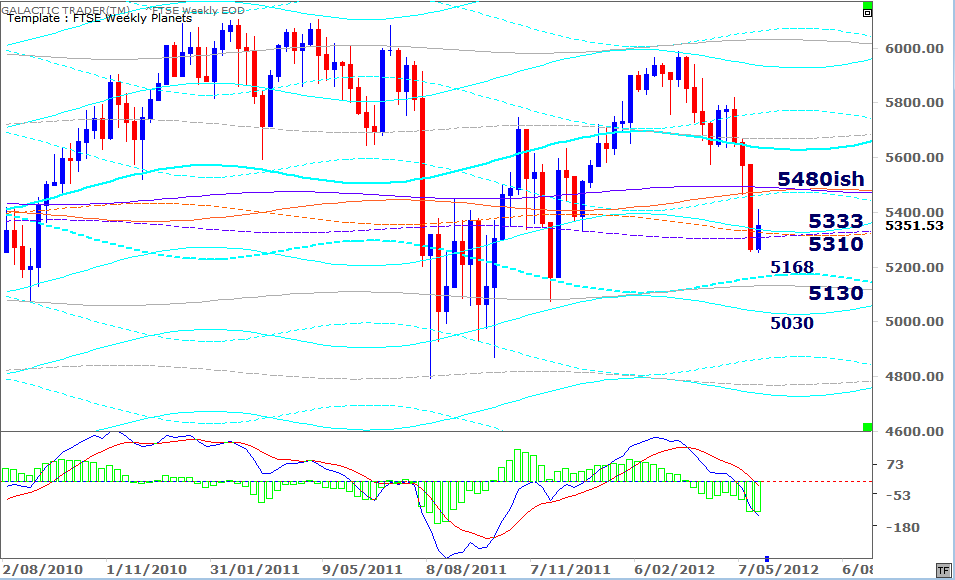
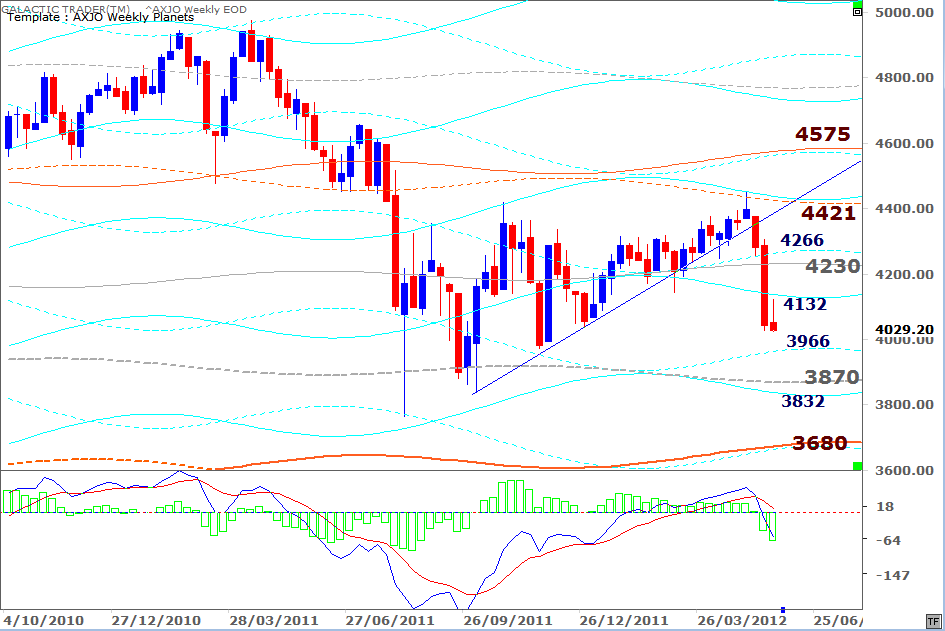
Below, I'll update the Weekly Planets charts for both the FTSE and the ASX200. I'm sure you're used to these by now and they don't really need any explanation. You'll note on both of them there is no sign of positive divergence from the fast MACD - neither from the signal lines nor the histograms.
Also interesting is the volatility of the price drops. Notice that during the 2002-2007 Bull run, there wasn't a single monthly close below the middle BB. The recovery rally from 2009 started the same way - but the behaviour changed during the spikes down last August and October.
I've used the Pollyanna Long Range Planets chart recently and you can find its price levels in the Archives. I use the monthly Bi-BB here for an alternative view of the Support and Resistance levels now in play.
Below, I'll update the Weekly Planets charts for both the FTSE and the ASX200. I'm sure you're used to these by now and they don't really need any explanation. You'll note on both of them there is no sign of positive divergence from the fast MACD - neither from the signal lines nor the histograms.