Gold, SP500, TSX, Europe and the ASX200
Week beginning May 20, 2013
So far, the only real "sell in May" action we're seeing is in gold and mining stocks.

Copyright: Randall Ashbourne - 2011-2013
It puts all the inner planets on course for a conjunction get-together with Jupiter. We'll take a close look at the potential implications of that next weekend; but the past two years have seen intermediate tops locked-in as the Sun and Venus conjuncted Jupiter.
Wall Street, England and Germany have now reached long-range targets published in Forecast 2013.
We'll spend this weekend looking at those targets and the technical state of the charts to see if "that's it", or whether the rally still has legs to run.
I'll update Australian readers on the state of the ASX200 and we'll take a look at the latest rundown in gold prices.
This week kicks off with another exact hit of the long-running Uranus square to Pluto and will end with another Full Moon Lunar Eclipse.
The Sun leaves stable and money-conscious Taurus and moves into Gemini. Volatility will increase - and in both directions. Mercury and Venus will also be in Gemini and will be joined by Mars at the end of the month.
The Sun leaves stable and money-conscious Taurus and moves into Gemini. Volatility will increase - and in both directions. Mercury and Venus will also be in Gemini and will be joined by Mars at the end of the month.


Safe trading - RA
(Disclaimer: This article is not advice or a recommendation to trade stocks; it is merely educational material.)
And it's gold we'll look at first.
While the topic is not raised in The Idiot & The Moon, I have on occasion discussed a technical condition called trading against a spike. The last significant one of these we saw was in stock indices in August-October, 2011. Gold now appears to be in a similar state.
Basically, what happens is this ... price produces a large-range spike; there is a strong bounceback from the low; and then the spike is retested. It is the nature of how the spike is tested which gives us an indication of whether a larger bounceback is coming, or whether the freefall continues.
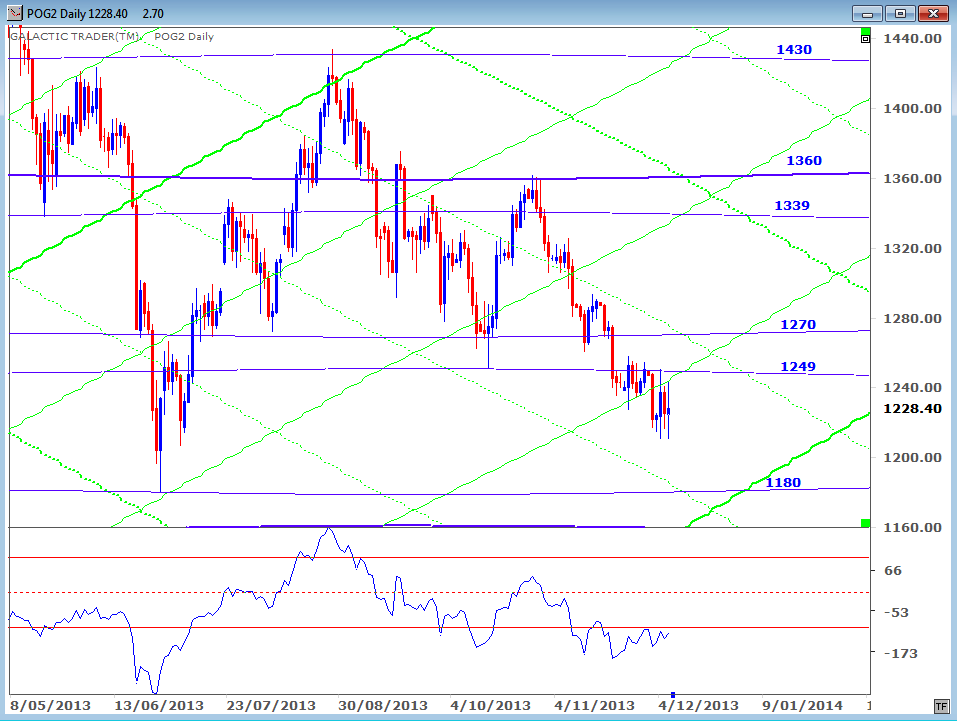
The planetary charts for gold, and their explanation, were introduced in Forecast 2013 and, so far, gold continues to play to them with almost uncanny accuracy.
In the chart below, we see the sudden April plunge ... the strong bounceback ... and now the retest is underway.
While the topic is not raised in The Idiot & The Moon, I have on occasion discussed a technical condition called trading against a spike. The last significant one of these we saw was in stock indices in August-October, 2011. Gold now appears to be in a similar state.
Basically, what happens is this ... price produces a large-range spike; there is a strong bounceback from the low; and then the spike is retested. It is the nature of how the spike is tested which gives us an indication of whether a larger bounceback is coming, or whether the freefall continues.
The planetary charts for gold, and their explanation, were introduced in Forecast 2013 and, so far, gold continues to play to them with almost uncanny accuracy.
In the chart below, we see the sudden April plunge ... the strong bounceback ... and now the retest is underway.
For a stronger bounceback to occur, or even a complete trend change, gold needs to make either a higher low, or only a marginal new low. The higher low would come from around 1337 and a marginal new low should not go significantly below the rising, primary Sun line currently priced at 1320.
The reality is that for gold to recover, stock indices probably need to drop ... and that's what we'll spend this weekend looking at.
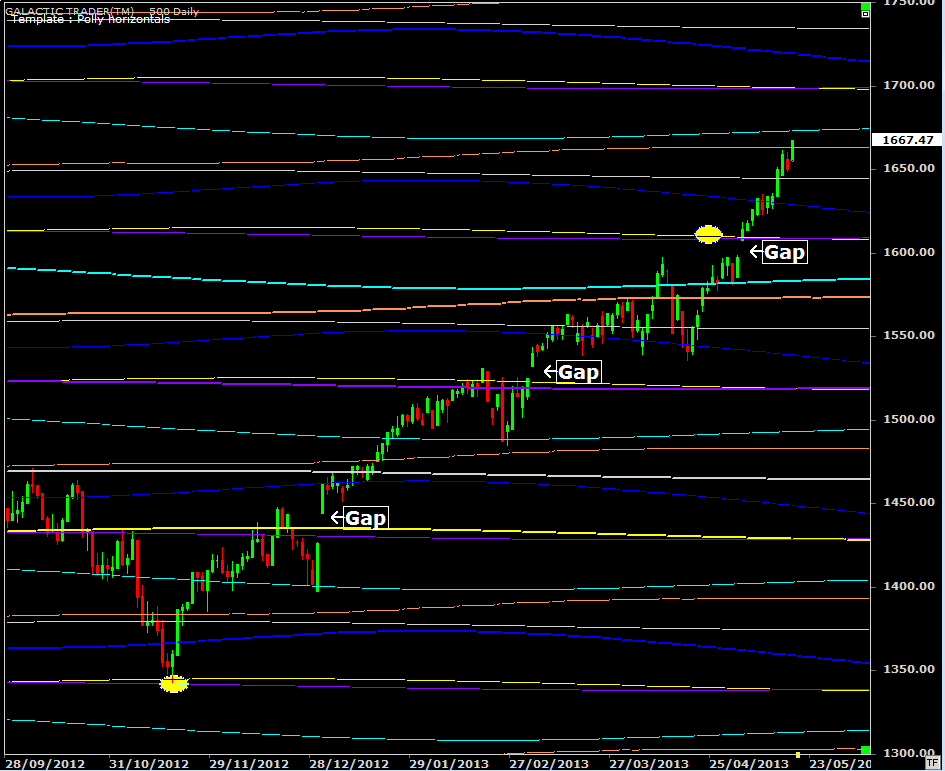
At various times recently, I've published this chart for Pollyanna, the SP500, indicating the index may have been on a run between Uranus/Pluto planetary barriers. The target price was around 1610, though I did warn there was a higher target in the 1660s.
And ...
The reality is that for gold to recover, stock indices probably need to drop ... and that's what we'll spend this weekend looking at.
At various times recently, I've published this chart for Pollyanna, the SP500, indicating the index may have been on a run between Uranus/Pluto planetary barriers. The target price was around 1610, though I did warn there was a higher target in the 1660s.
And ...
Forecast 2013 is now available for sale and download.
Click the button on the right for more details.
Click the button on the right for more details.


Forecast 2013 is now available for sale and download.
Click the button on the right for more details.
Click the button on the right for more details.
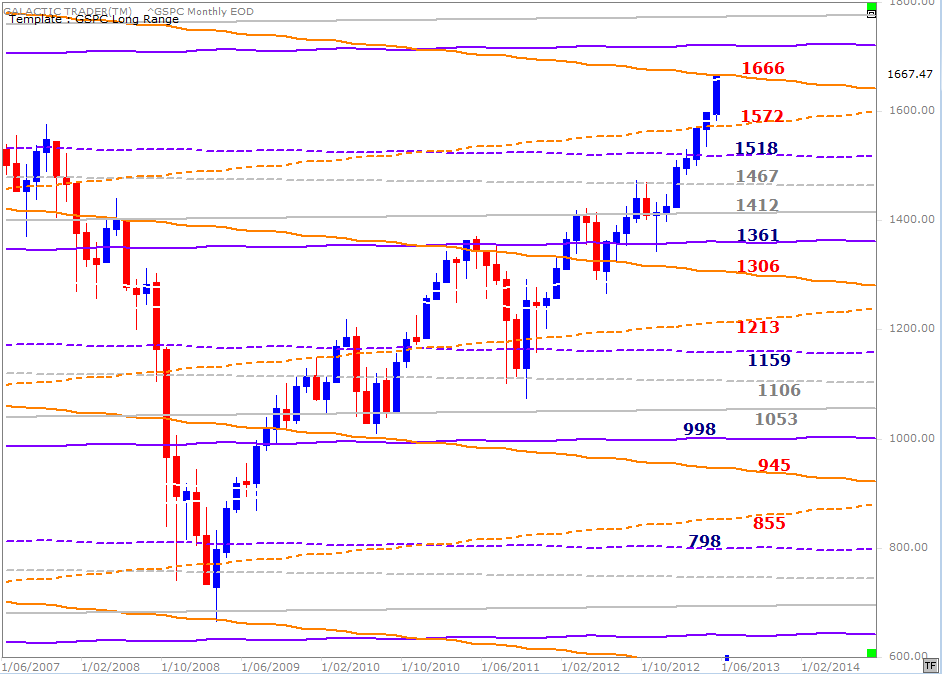
It's interesting to see how Polly has dealt with these Uranus/Pluto price zones since bouncing off one late in 2012 to launch into very strong rally mode - the resistance has been overcome by forced jumps over the hurdles. The next Uranus/Pluto zone is the 1700s.
However, let's look at where the index is in relation to the long-range planetary targets I published in January, in Forecast 2013. The index is now hitting against strong resistance from a Node barrier. The next highest target is Pluto at 1719.
However, let's look at where the index is in relation to the long-range planetary targets I published in January, in Forecast 2013. The index is now hitting against strong resistance from a Node barrier. The next highest target is Pluto at 1719.
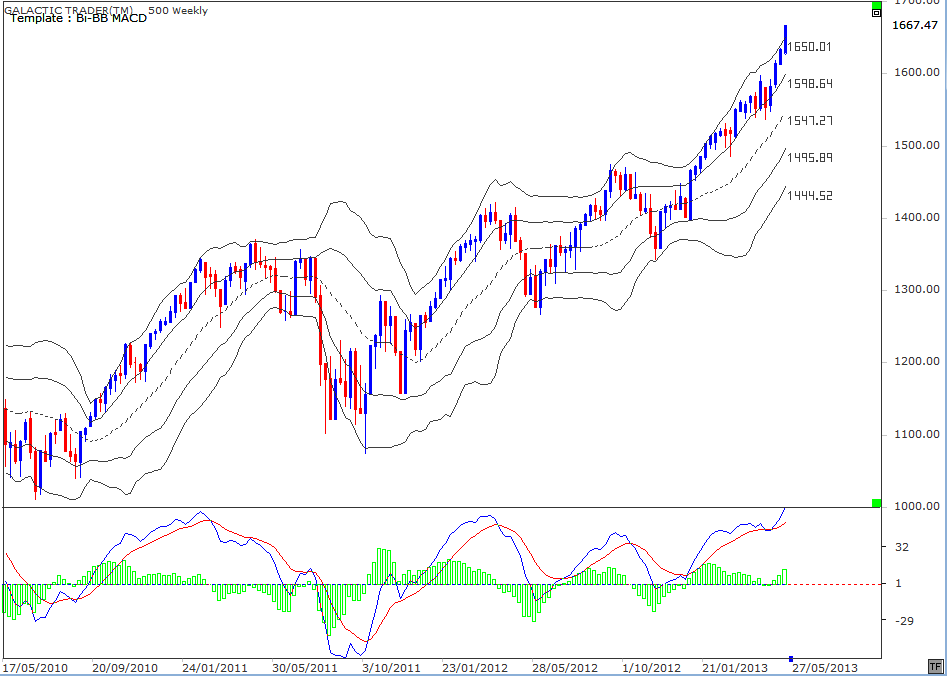
We are, however, entering the statistically negative period between the 1Q and Full Moons ... and with Polly having breached the topside of the Bi-BBs. As explained in The Technical Section of the book, a breach of the upper or lower outer bands tends to cause either a sideways shuffle, or a countertrend.
Last week's price action breached the weekly upper band for only the second time in years. The previous one prompted a 9-week decline after some initial sideways shuffling. One other thing to note is that all the declines so far have travelled the full width of the bands ... so, IF one starts in the next week or two, the history suggests Chicken Little is going to want to slash 200 points from Polly.
Last week's price action breached the weekly upper band for only the second time in years. The previous one prompted a 9-week decline after some initial sideways shuffling. One other thing to note is that all the declines so far have travelled the full width of the bands ... so, IF one starts in the next week or two, the history suggests Chicken Little is going to want to slash 200 points from Polly.
The other warning sign on the chart above relates to the condition of the fast MACD histogram peaks. The signal lines are fine. But the histogram peaks have been in constant decline throughout the rally from October, 2011.
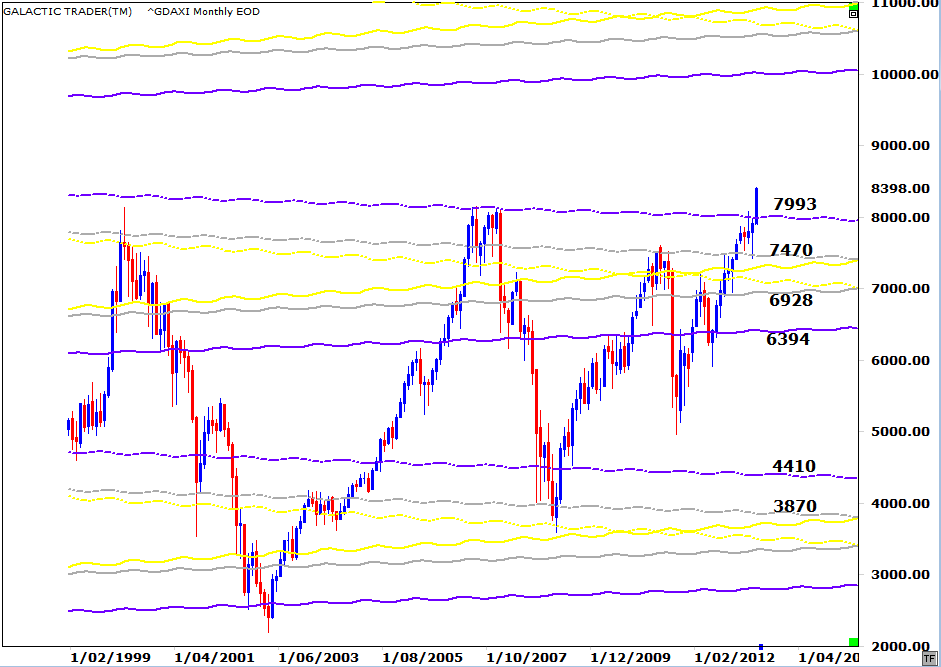
Okay. The two other Western indices as brightly optimistic as Polly are the FTSE and the DAX. We'll deal first with Germany, which has had a breakout above the major price target published in the Forecast.
Ten-thousand plus seems like a fairytale target. But, that's the next major planetary barrier for the DAX.
The planetary lines in the chart above are set at their maximum width. However, I used them because the German index has a strong track record of actually reaching them and they cannot be dismissed lightly. But we can use a Fibonacci Extension tool as a guide to potential targets within the 2000 points of "empty" space above.
Even so, the nearest higher target is several hundred more points away. AND all 3 Canaries - short, medium and long-range - are not at all unhappy.
Even so, the nearest higher target is several hundred more points away. AND all 3 Canaries - short, medium and long-range - are not at all unhappy.
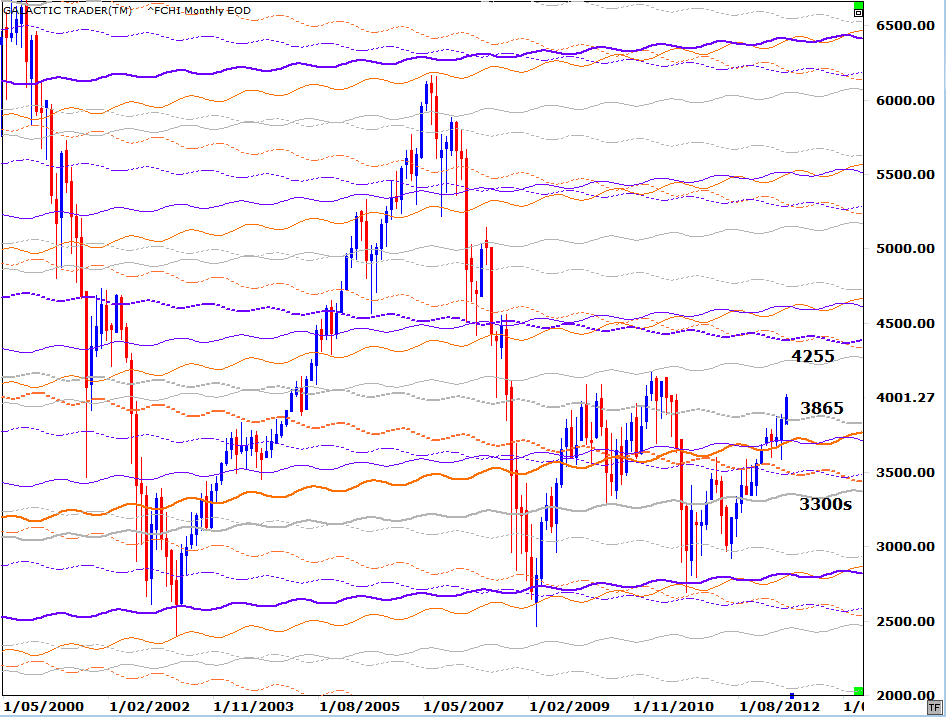
Paris is next and I again use the chart from Forecast 2013. The CAC40 finally managed to break free of the 3800 price zone.
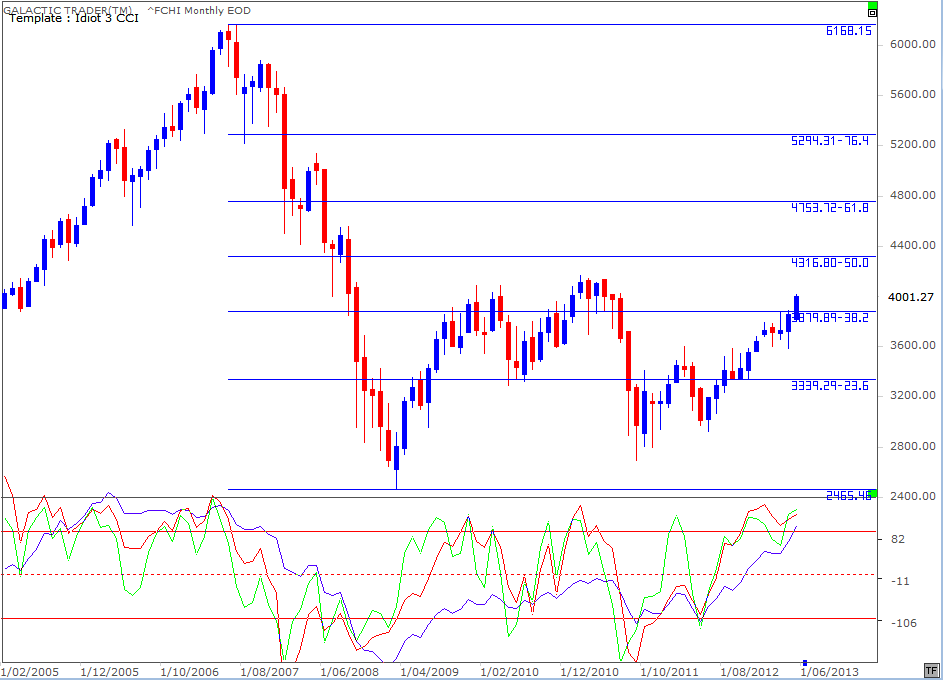
Since the CAC is not breaking out to new Bull market highs, we need to pay attention to the Fibonacci Retracement levels. There is very strong positive divergence evident in the FiboRx chart below. None of these oscillators has been this happy since the post-2009 recovery began and the higher FiboRx levels correspond with the potential planetary targets.
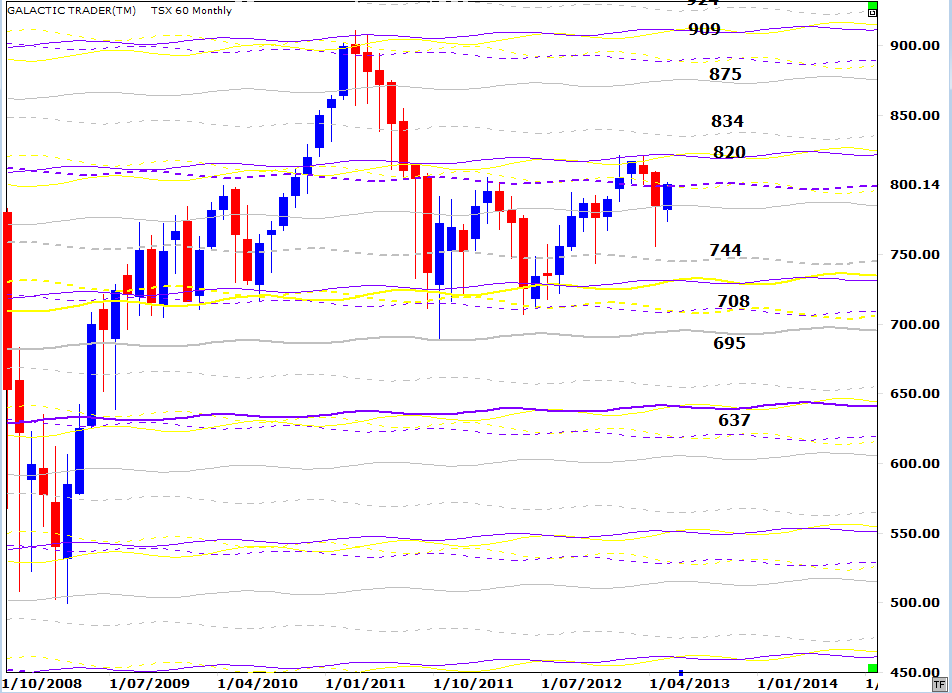
Returning now to North America for a look at the Canadian market. The TSX is in a similar state to the CAC40 ... ie: well below its earlier recovery high.
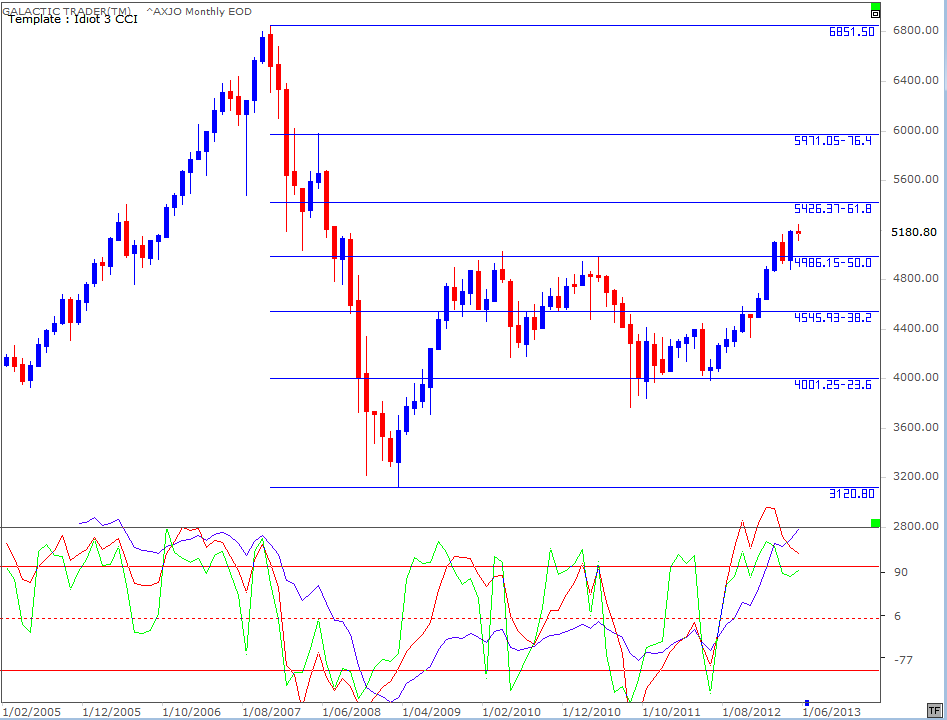
Now to my home market, Australia. Again, probably the most important thing on the chart is the state of the long-range Canary. While the short-term and medium range Birds are declining, the long-range line has hit new peaks. No negative divergence building, as it did during the push into the 2007 highs.
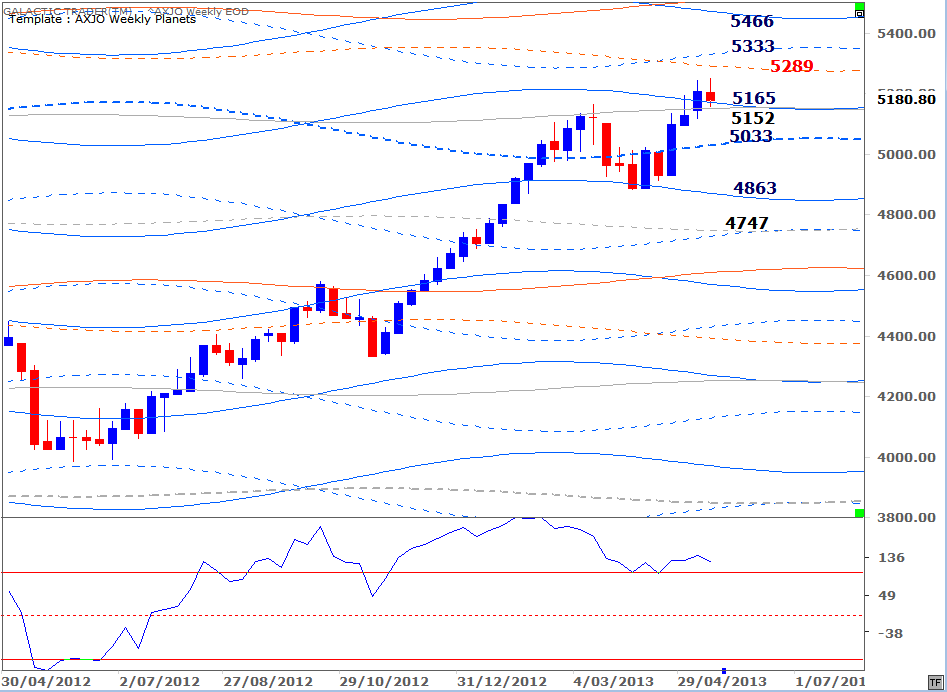
However, there is a warning sign flashing. The long-range Canary is holding above the +100 level, but appears to be increasingly unhappy. Remember this is a weekly chart - and the negative divergence is not present in the monthly chart.
Which suggests that any short to medium range price weakness in the index will be overcome and that higher prices are not merely possible, but are probable, over the course of the year.
Which suggests that any short to medium range price weakness in the index will be overcome and that higher prices are not merely possible, but are probable, over the course of the year.
Auntie's Weekly Planets chart is below. After being blocked by a Neptune level in March and April, the index is now testing support on top of the line - and the price targets, if it succeeds, are obvious.

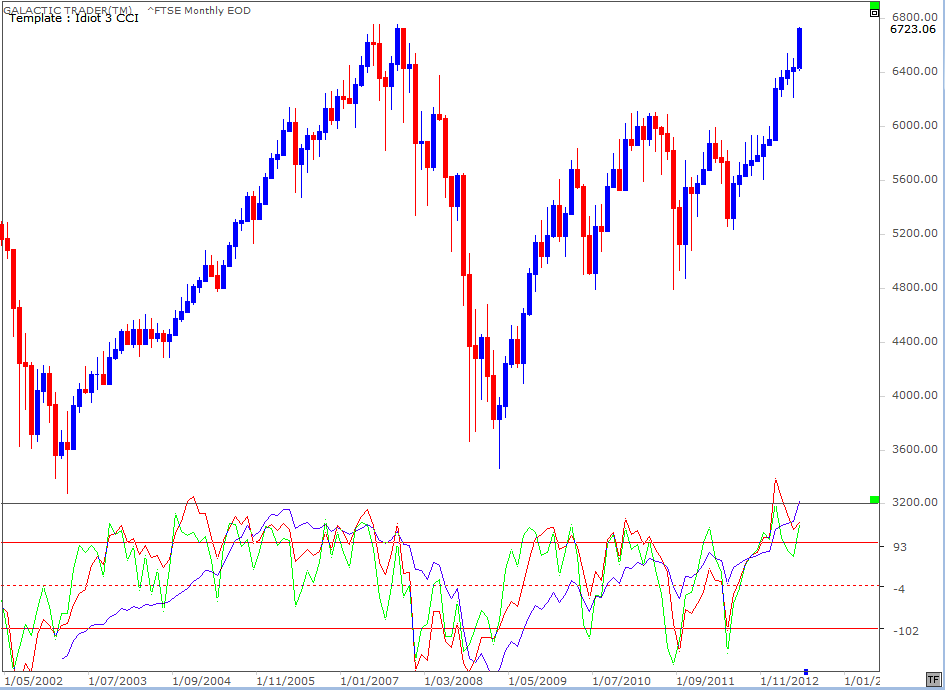
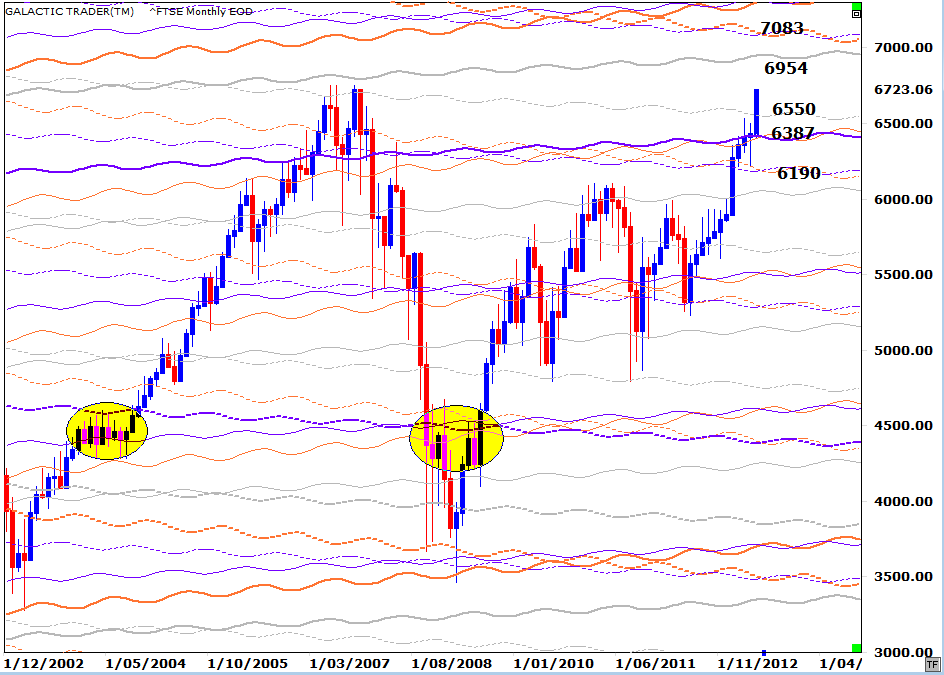
The FTSE's long-range planetary price chart is below and I discussed in Forecast 2013 how the 6300s would be a difficult area, given the index's history of stalling at Uranus/Pluto zones. London has had a strong breakout after the months-long stall in that zone ... and also broken above the Neptune barrier which stopped the 2007 Bull run.
And in the chart below, the long-range Canary is singing quite happily. Note the divergence which slowly built in the indicator (the blue line in the lower oscillator panel) as price rose into the 2007 Bull peaks ... and note especially that there is absolutely no sign of divergence in its current readings.