A look at the Venus Retrograde effect
Week beginning May 14, 2012
The coming week is one of this year's extreme high energy zones in terms of astrological impacts.

Copyright: Randall Ashbourne - 2011-2012
This week kicks off with the Sun conjuncting Jupiter in the sign of Taurus. Mercury and Mars will make a Grand Trine with Pluto. It is the statistically positive period between the 3Q and New Moon.
But the most significant event of the week is that Venus turns retrograde. It's an optical illusion; when viewed from the Earth, the planet appears to be going backwards.
Yeah, yeah ... we all know that couldn't possibly have any impact at all on stock markets, gold prices, currency swaps etc.
It's Spooky Stuff. Just like the ASX200 and the FTSE halted last week's declines pretty much exactly at price lines worked out from the position of Saturn in the sky. You can check that out on the charts in a little while.
Okay, so the Bears are growling, happily slurping up the honey from their Shorts and looking forward to making lots more as the dive continues.
Last weekend, I made a couple of comments ... that "from a purely technical reading it sure looks like the Chicken Little roadshow is back in the Big Apple" ... and also that "The problem, as I see it, for a resumption of the Bear trend is the Sun's approach to a conjunction with Jupiter."
The chances of a significant trend change nearby are much - MUCH - higher than normal. That's not a guarantee, but it is a statistical imperative we shouldn't ignore out-of-hand.
I realise that, often, "show me" works a lot better than "tell me" - and in a few moments I'll do just that and your brain can draw its own conclusions.
I realise that, often, "show me" works a lot better than "tell me" - and in a few moments I'll do just that and your brain can draw its own conclusions.


So, let's review the state of the markets and try to work out which is more likely to play out this week - more of the Chicken, or a Bullish revival.
We'll begin by looking at the lunar phases, since we are now in the Quarter phase leading up to the statistical high timeframe of a New Moon ... and this New Moon will be a Solar Eclipse in very early Gemini, one of the two signs which can spark wide-range price moves.
Safe trading - RA
(Disclaimer: This article is not advice or a recommendation to trade stocks; it is merely educational material.)
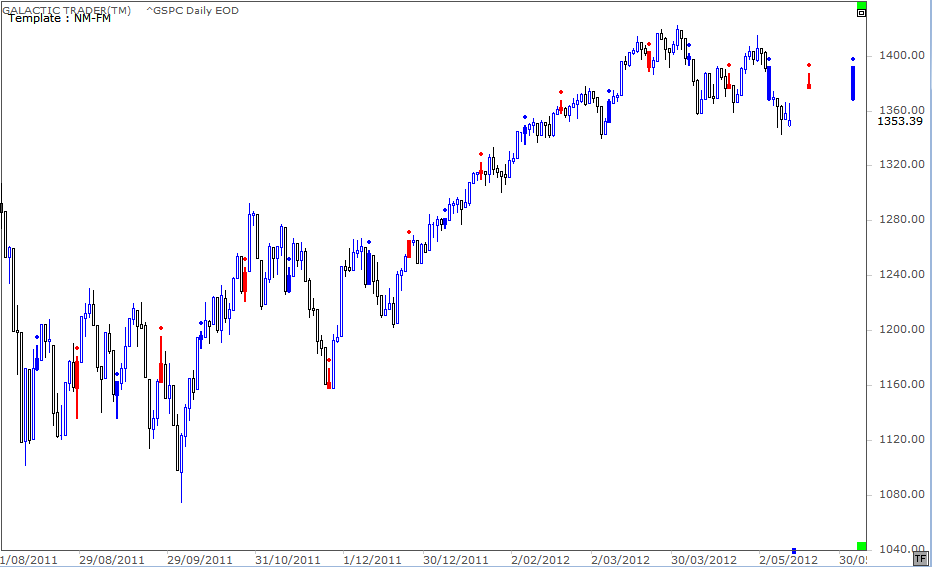
Above we have the New Moon-Full Moon chart for Pollyanna, the SP500. New Moons are solid red bars (prices should fall or flatline from that point) ... Full Moons are solid blue bars (prices have a statistical tendency to rise after the Full Moon).
Okay, we're between a blue and a red. Since the spike Low last August, there have been only 3 occasions when Pollyanna prices have been lower at the red bar than they were at the preceding blue bar.
There is only one red bar which came in at a Low. In every other instance, there was a distinct tendency for prices to rise in the few days immediately leading into a New Moon red bar.
To be blunt, it is statistically a bad bet to be Short the market in the week before a New Moon.
Okay, so that's the first part of this weekend's "show me" exercise.
Now we're going to turn our attention to the Venus Retrograde effect.
This is an astrological event which has the power to turn markets on their head!
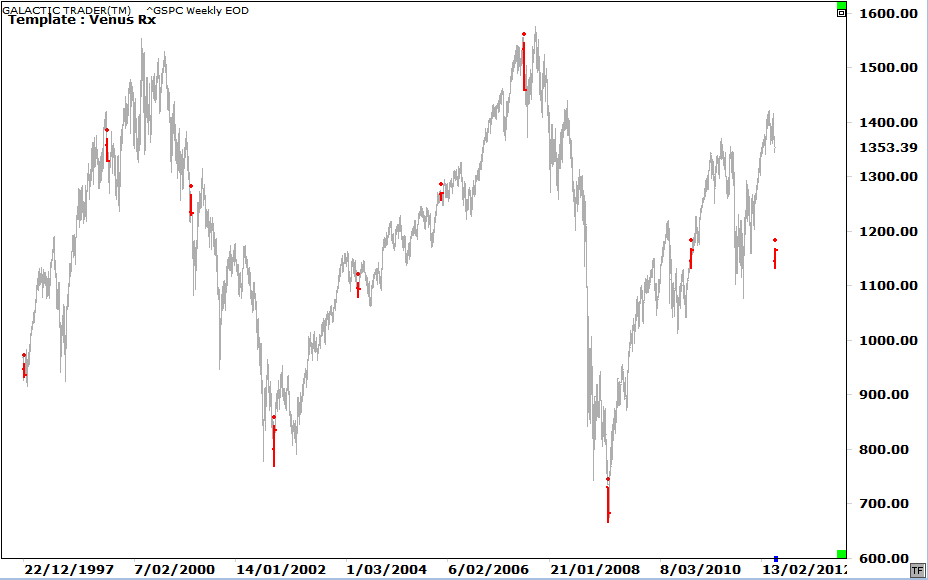
Now, it's not always the case ... but, as I said earlier, it's a statistical imperative we shouldn't lightly dismiss. The chart above is an SP500 Weekly going back to the late 90s and the red bars are the weeks in which Venus went Retrograde.
THE Low of two Bear markets ... and the almost-final High of the 2007 Bull market.
Okay, so the coming week is going to have one of those solid red Venus Rx bars ... but it's also going to coincide with the Sun conjunct Jupiter aspect.
THE Low of two Bear markets ... and the almost-final High of the 2007 Bull market.
Okay, so the coming week is going to have one of those solid red Venus Rx bars ... but it's also going to coincide with the Sun conjunct Jupiter aspect.
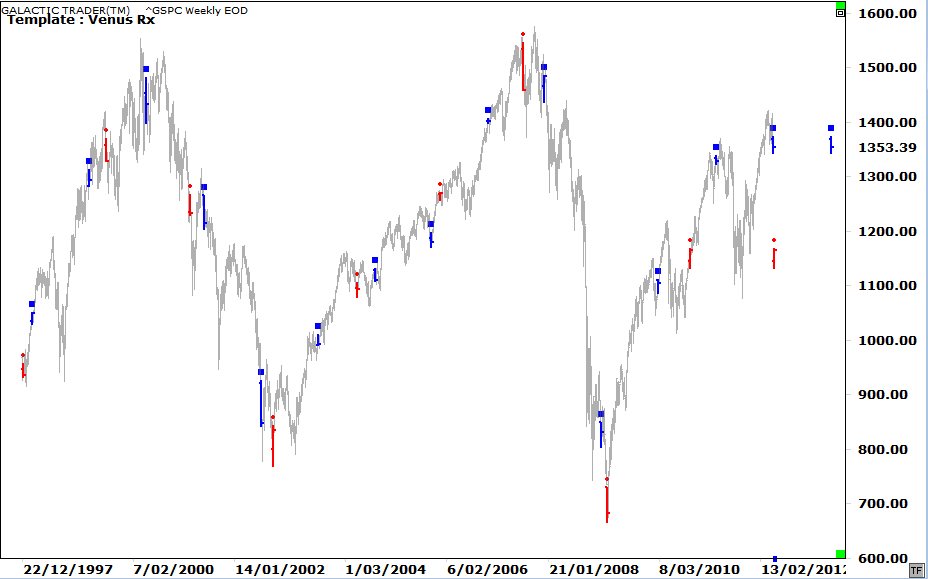
As I've indicated a couple of times in the past few weeks, this is another one of those astrological aspects that has a very high historical tendency to move markets.
In the chart above, the annual Sun conjunct Jupiter weeks are marked with the solid blue bars.
In the chart above, the annual Sun conjunct Jupiter weeks are marked with the solid blue bars.
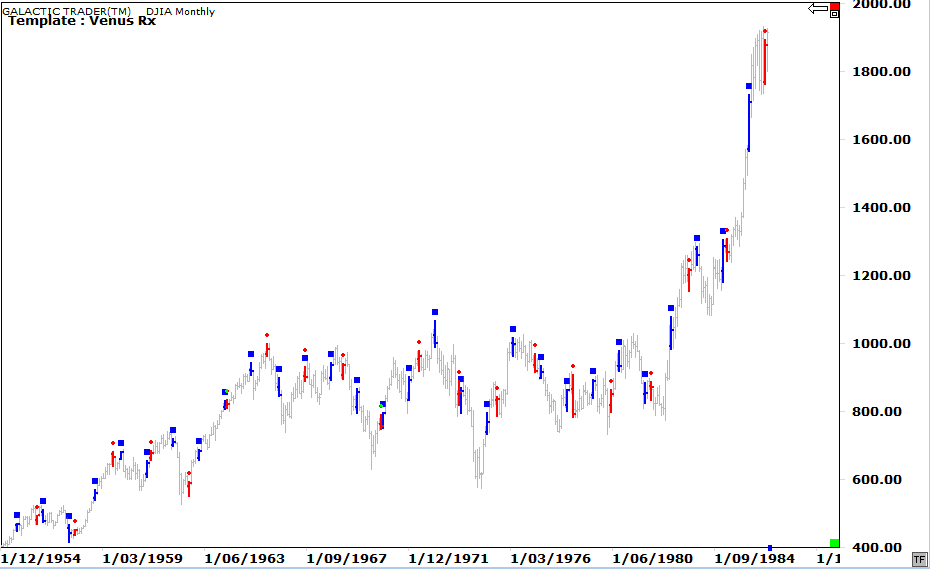
And above is a monthly chart of the Dow Jones Industrial Average spanning from the early 50s into the 1980s ... showing what happened in the months after the Sun met up with Jupiter, or Venus went Retrograde. Both of these aspects have a distinct tendency to be in effect as markets are making important trend changes.
And this week, we get both of them together.
Okay, let's take a quick look at how things went last week.
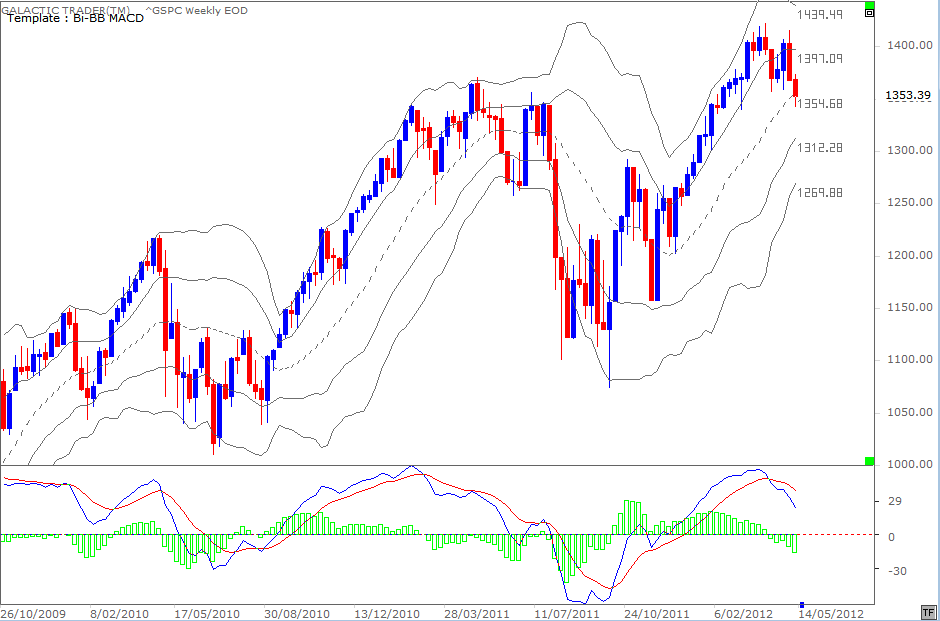
Last weekend, I posted a Bi-BB weekly for Pollyanna ... a technical system outlined in the book and which can be used profitably without relying in any way on The Spooky Stuff. I indicated last weekend it provided alternative weekly price targets for the 500 - and the middle band was then priced at 1350.28
And this week, we get both of them together.
Okay, let's take a quick look at how things went last week.
Last weekend, I posted a Bi-BB weekly for Pollyanna ... a technical system outlined in the book and which can be used profitably without relying in any way on The Spooky Stuff. I indicated last weekend it provided alternative weekly price targets for the 500 - and the middle band was then priced at 1350.28
Polly's Low for the week was 1343 ... so 1350 was a pretty good target to aim for. I mention this merely to emphasise that simple not only works, it actually works great. You do NOT need expensive software and complicated techniques to be able to trade reliably, safely and successfully.
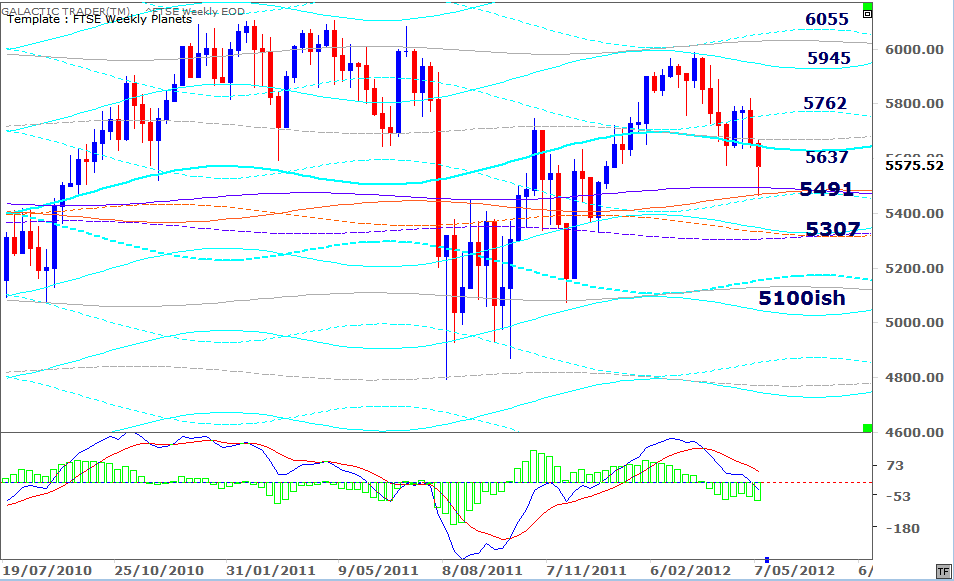
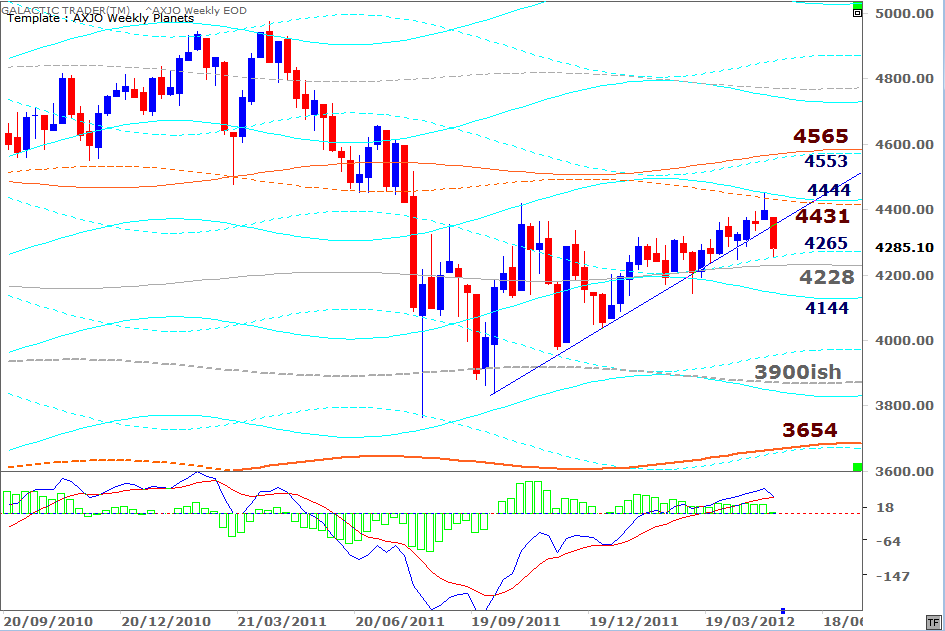
The next couple of charts are the Weekly Planets for the FTSE and the ASX200 and need no explanation.
The next couple of charts are the Weekly Planets for the FTSE and the ASX200 and need no explanation.
Both indices hit weekly price targets and have bounced - and if you consult the Canary on the FTSE daily, you'll notice some positive divergence between the oscillator and the price behaviour.
I'd thought the high astro energy this coming week might produce a secondary High in the markets - and I guess that's still possible.
As you can see from past performance, there's a tendency for Venus Rx and Sun/Jupiter to be present at either High OR Low points.
Whichever one it turns out to be, the odds are it will set the tone for the months to come.