Jupiter hits his historical high point
Week beginning March 5, 2012
Pollyanna's latest rainbow prism party is now in real danger of being crashed by Chicken Little.

Copyright: Randall Ashbourne - 2011-2012
And with Jupiter now at the three-quarter mark of the first decanate of Taurus, the combination of the various technical and astrological factors could create "the perfect storm".
During the week, I extracted a section of Forecast 2012 and brought the major chart up to date. The Jupiter Cycle and its effects on Wall Street is now published as a standalone essay under the Articles button in the main navigation bar.
Last weekend, I chatted briefly about the grand Taurean party due in the next couple of weeks when Venus joins Jupiter in the early degrees of Taurus, favourite site of the Old Goddess - and, also, the sign of material stability and security.
While her opposition to Saturn symbolises very negative energy, the conjunction of the two Benefics in the sign which rules money and values points to a potential final burst of asset price inflation. Nothing inflates like Jupiter.
Early this week, Mercury will shift to Aries and conjunct Uranus - and the Sun has yet to leave Pisces and make the same aspect. So, it is not possible to predict with accuracy that the final rally from the Bear bottom in 2009 has run its course completely.
The SP500 is having major trouble getting past a couple of important Fibonacci extension levels, which happen to coincide with the low of the August 2007 spike down - the last low before the high which brought on the Bear collapse.
This weekend, the Sun opposes Mars and Venus opposes Saturn, either one of which has a high statistical tendency to turn markets.
This weekend, the Sun opposes Mars and Venus opposes Saturn, either one of which has a high statistical tendency to turn markets.


Astrological aspects create an expectation of the Time when change is most likely to occur and careful study of past performance gives a guide to what the impact might be on prices.
But, we need mundane confirmation of the expectations from the technical condition of the charts.
And, I have to tell you, there continues to be one very large elephant in the room. I will come back to it in a little while.
And, I have to tell you, there continues to be one very large elephant in the room. I will come back to it in a little while.
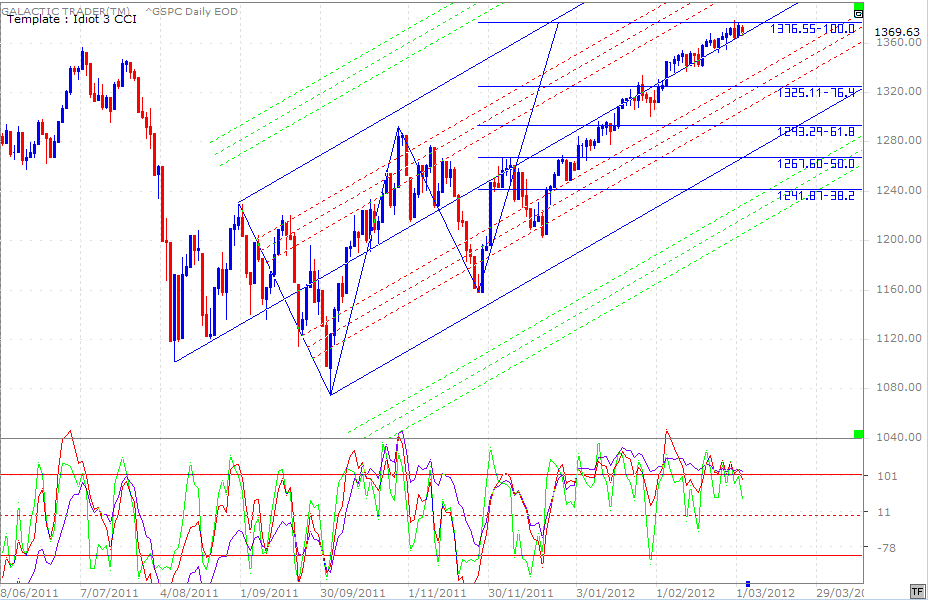
We will begin dissecting the technical entrails with the chart above. Pollyanna continues to hug the central tyne of the pitchfork. Price peaked last week with a small break of the 100% level of a Fibonacci Xt based on the first rally leg and its corrective wave.
And it peaked as all three of the Canaries continued to sing off-key. The oscillator peaks have been in steady decline as Price has been in a grinding incline. And it's quite easy to see that this has been a grind. It has taken 66 days to put on the same amount of price as the initial rebound from the TAS Low produced in 18 days. (3.6 times ... 360 degrees.)
And it peaked as all three of the Canaries continued to sing off-key. The oscillator peaks have been in steady decline as Price has been in a grinding incline. And it's quite easy to see that this has been a grind. It has taken 66 days to put on the same amount of price as the initial rebound from the TAS Low produced in 18 days. (3.6 times ... 360 degrees.)
In this second chart, we see that the current rally leg is a 1.618 Fibonacci Xt of the first leg, which kicked off in late November for a still-running Santa Claus rally. The use of Fibonacci Rx and Xt levels is detailed in The Technical Section of The Idiot & The Moon and if you've never used them, these charts are an example of why you might want to go back over that chapter of the book.
Please take special note of both of these charts ... and study how important some of the Xt levels were in both cases in terms of acting as temporary Support or Resistance during the slow-grind northwards.
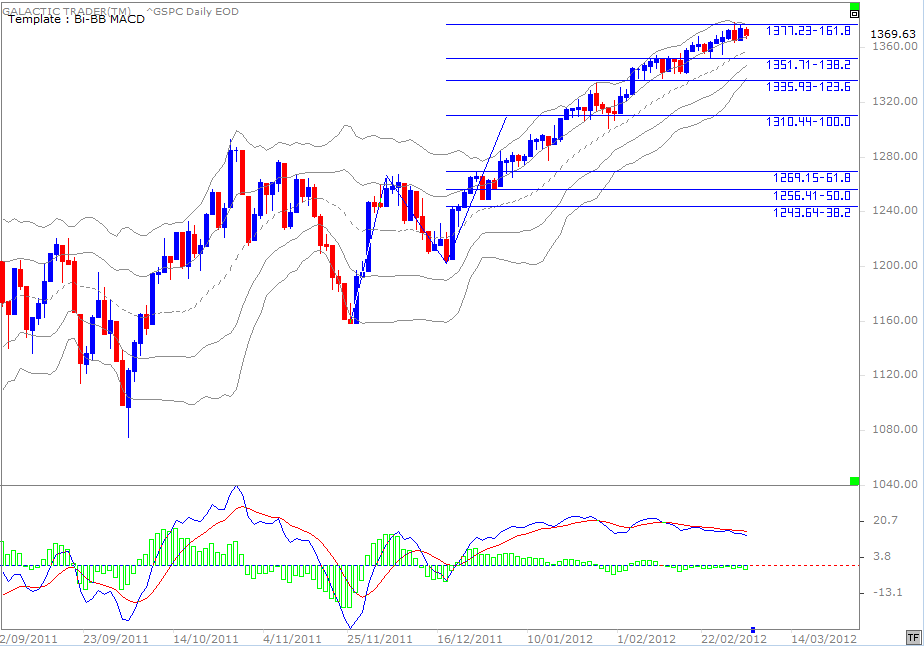
As with the Canaries on the earlier chart, the MACD has been less than enthusiastic - and the histograms even less so.
Now, also covered in The Technical Section is the use of Bi-BB's. Long positions are deemed "safe" for so long as Price hugs the upper tier of the Bi-BBs. Tightening BBs warn of an impending fast move becoming imminent. And the first explosive move is ... frequently in the "wrong" direction.
Putting it all together, the emerging technical conditions from these charts do give some weight to the gameplan we've been talking about recently ... that we're entering what is, historically, a Spooky Stuff danger period, but that the overall "pattern" still allows for a quick correction and final exhaustion run.
Please take special note of both of these charts ... and study how important some of the Xt levels were in both cases in terms of acting as temporary Support or Resistance during the slow-grind northwards.
As with the Canaries on the earlier chart, the MACD has been less than enthusiastic - and the histograms even less so.
Now, also covered in The Technical Section is the use of Bi-BB's. Long positions are deemed "safe" for so long as Price hugs the upper tier of the Bi-BBs. Tightening BBs warn of an impending fast move becoming imminent. And the first explosive move is ... frequently in the "wrong" direction.
Putting it all together, the emerging technical conditions from these charts do give some weight to the gameplan we've been talking about recently ... that we're entering what is, historically, a Spooky Stuff danger period, but that the overall "pattern" still allows for a quick correction and final exhaustion run.
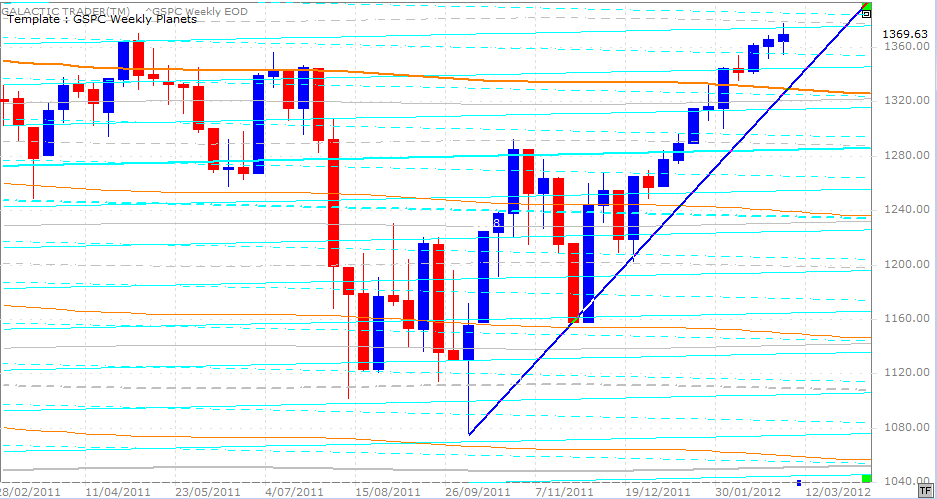
We'll take a quick look now at Polly's Weekly Planets chart (above). The planetary lines on this are closer than I normally use them for intermediate trends. However, it has been a grinding rally and I've been wanting to keep a closer-than-normal check. Just check the last two Price bars and trace the cyan Saturn lines back to the 2011 High.
They were significant then - and may be significant again now. The trendline is yet to be challenged again and I will personally be very interested to see how any correction handles the major long-range power of the primary Node line (orange).
Okay, so technically and according to the symbolism of The Spooky Stuff, we can make a case that Chicken Little is just offstage, clearing his throat. Awoe! Alas! The sky is falling.
So, let me come back to the elephant.
Safe trading - RA
(Disclaimer: This article is not advice or a recommendation to trade stocks; it is merely educational material.)
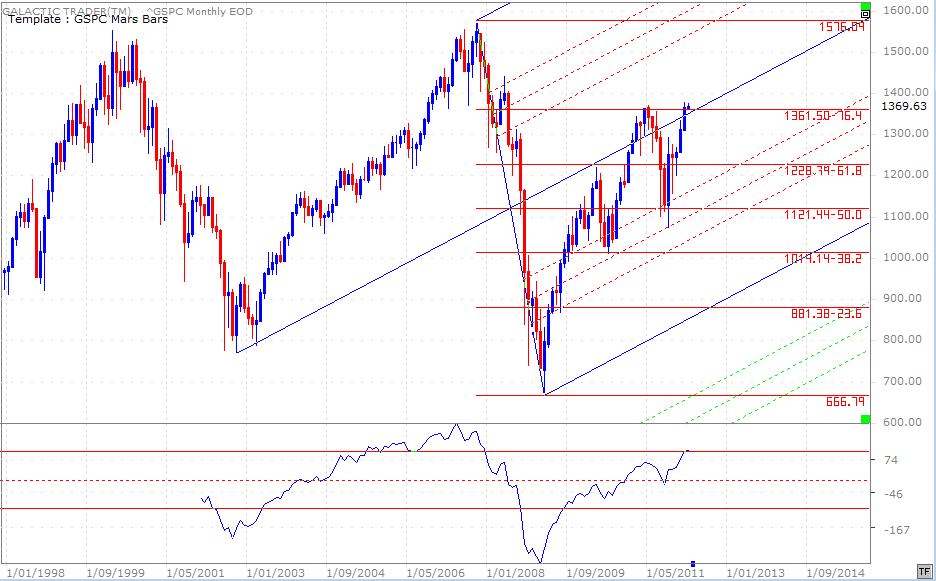
And to put it bluntly ... the elephant in the room is the state of the long-range Canary. There is absolutely NO disagreement that this rally is real. The oscillator has gone higher than it did in 2011, even though Price is around the same level. In fact, it has poked its head above the +100 level for the first time since MIDWAY through the 2002/2007 Bull run.
I wondered if the reading were a false one by having too few bars on the chart - but when I loaded decades of data into the program, the oscillator gave exactly the same reading.
I am surprised because, as many of you will know, it was not how I was expecting the SP500 to behave going into this March timeframe. I had believed the 2011 High should not be broken. But, it has been ... and the fact that it has been does raise the spectre of having to put aside the Bear gameplan and go back to the drawing board for an alternative play.
But, I'm not going to do that until I see what happens at the Venus-Jupiter kissy-smoochy I waffled about last weekend. And it's not just the Spooky Stuff, but the potential Bearish divergence between what Wall Street is doing and some other major international indices.
But! I am quite prepared to come back to a more positive outlook for the months ahead if this gameplan is proven to be broken. It is an election year in the USA and they have a tendency to be positive. Too, another 700-billion fell off the back of a truck outside the European banks last week.
And no, they won't be lending a cent of it to Greek calamari-and-chips shops, Spanish condo developers, Italian anythings. There's only one place that money is going ... the same place QE 1 & 2 money, TARP money and all other funny money went. Stock markets. It's not that I believe in conspiracy theories, y'know. Of course it's just a coincidence that former Goldman Sachs executives run the European Union, the Italian Government, the US Treasury. I mean when nations and banks are in crisis, it's just commonsense to seek advice from the real experts. Cough*splutter*gag*puke.
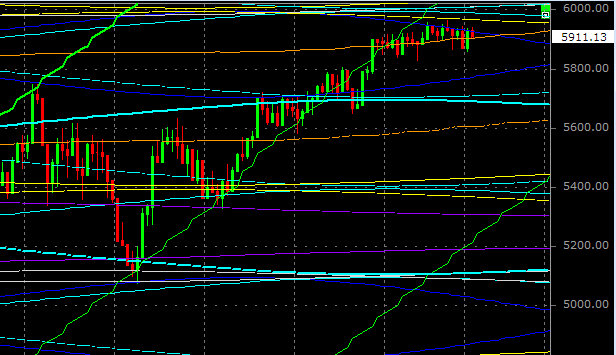
Oh tsk*tsk. Pardon me my incredulity. So, over on the left there we have a little look at the planetary price lines in play on London's FTSE.
It's a lot of Time for not a lot of Price, so it has to break - up or down.
What's interesting is that it can't seem to reach the Saturn barriers.
Have a squizz backwards. The low that started the rally sprang from a false break below a primary Saturn. It bounced to the Node and fell back into Saturn/Uranus territory to build some more steam.
Then ran into trouble at another set of Saturns.
Now, it's using the Node as support, but can't get enough oomph to punch through Jupiter to hit the next level of Saturns.
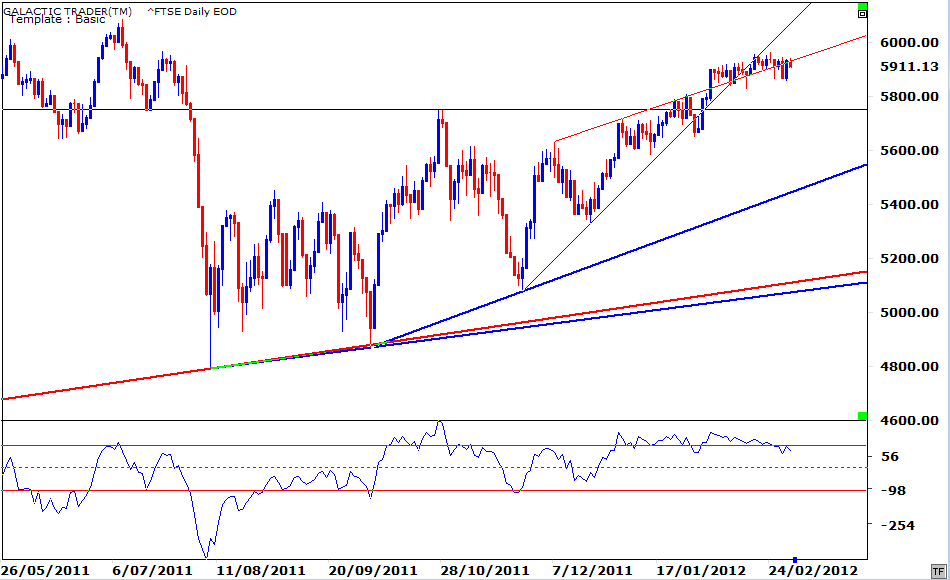
Using the technical chart we've had in play for a while, we can see the congestion hovering either side of the trend line we used to cap what had seemed to be a negative ending diagonal shaping.
More interestingly, considering the earlier blah-blah about astrological aspects, the long-range Canary has been in steady decline and has again fallen below +100.
More interestingly, considering the earlier blah-blah about astrological aspects, the long-range Canary has been in steady decline and has again fallen below +100.
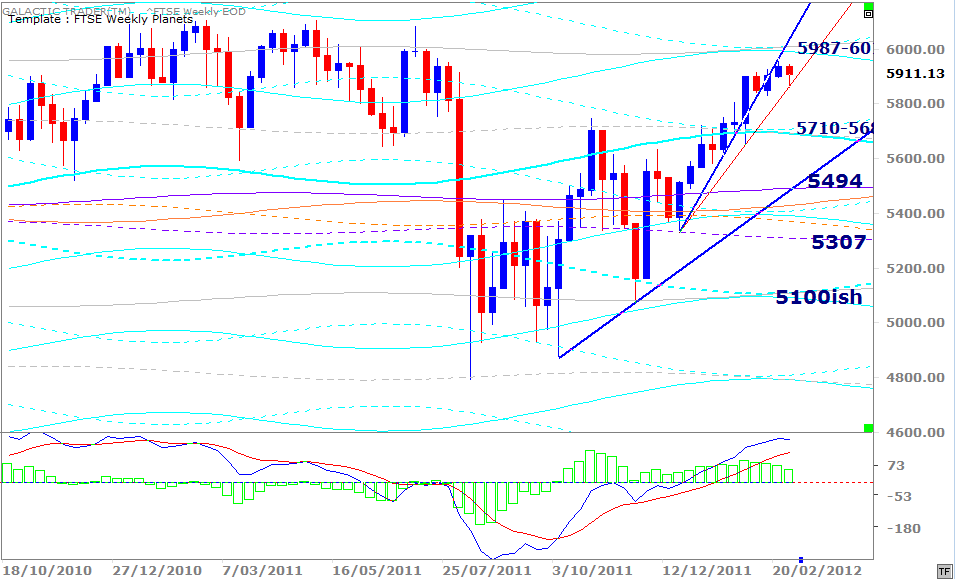
So, let's turn our attention to the Footsie Weekly Planets chart. After attempting to recover the too far-too fast trendline, last week went negative and decided to test a shallower angle. Successfully. So far. But, it reiterates the point about the index's apparent inability to reach as high as the next obvious level of intermediate-trend target prices.
MACD is starting to roll over and the histograms are shrinking.
MACD is starting to roll over and the histograms are shrinking.
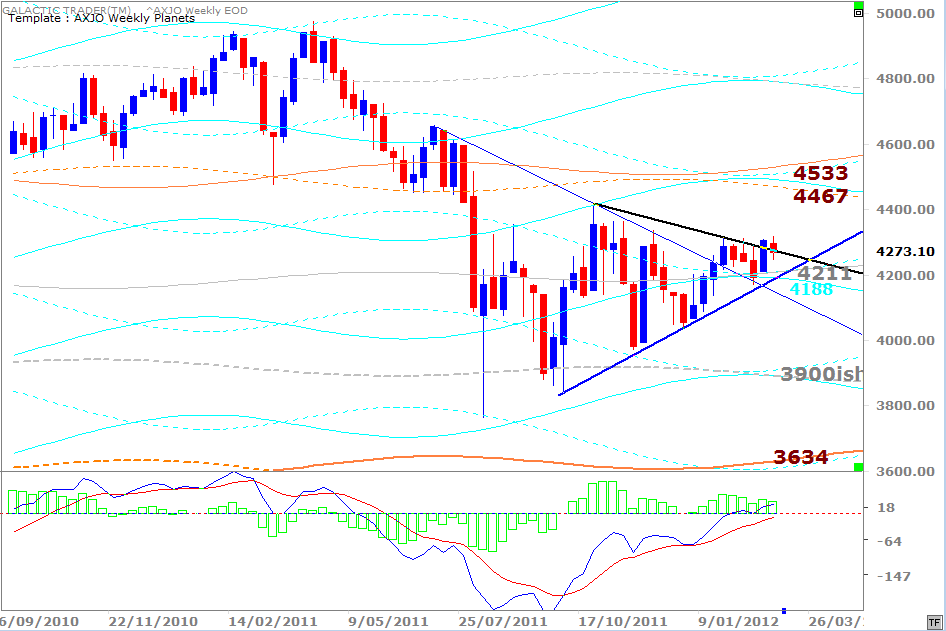
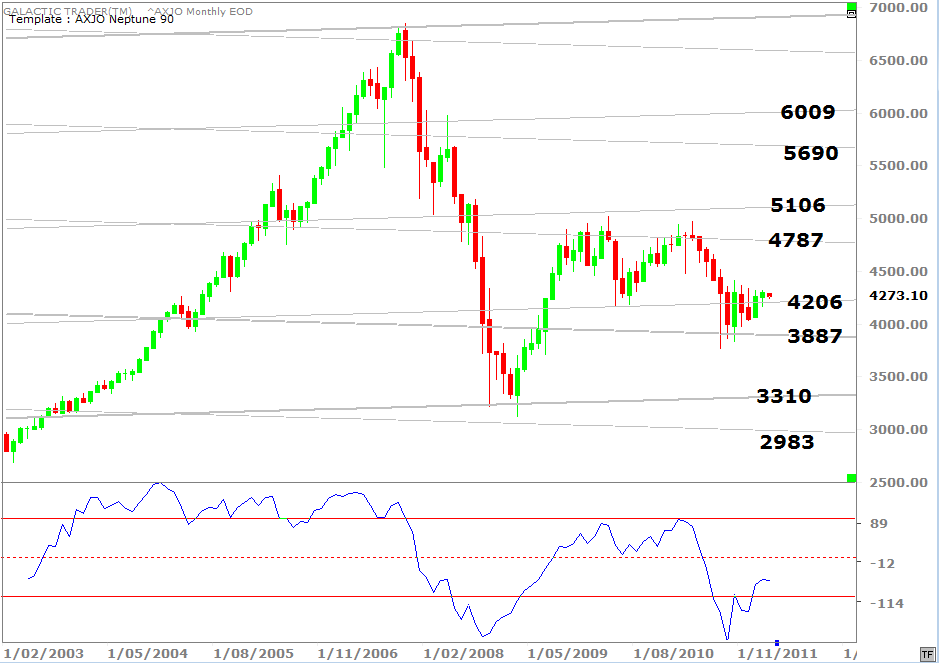
After teasing us with a potential breakout last week, Auntie - the ASX200 - had another fit of the wobbles. The chart above is Auntie's Weekly Planets obviously and the trendlines are there because I've been hoping to see a breakout that would open up the mid-4000 target levels.
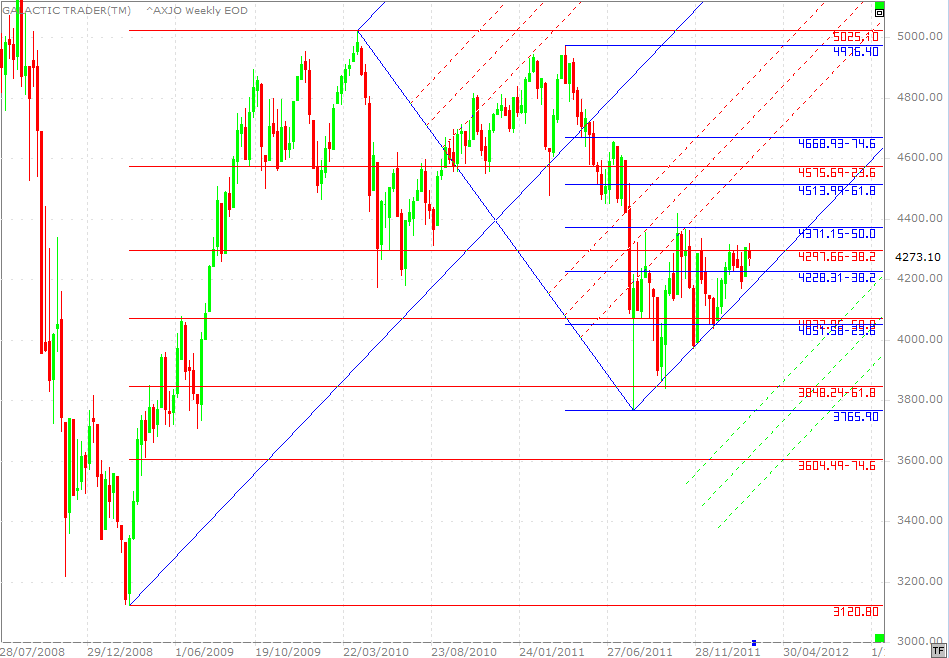
In the last few weeks, I provided a couple of "cheat sheet" Fibolin charts for the 200 and you might want to have a look in Archives 2012. Below is another version of those.
In the last few weeks, I provided a couple of "cheat sheet" Fibolin charts for the 200 and you might want to have a look in Archives 2012. Below is another version of those.
The irritating old bat refuses to break and hold the 4300 level! And yet, again, we have that elephant lurking in the room. The MACD on the Weekly Planets chart is sort of positive. The 50 CCI (not shown on this chart) continues to hold its rising trendline since last August's spike low.
And yet, Price just won't do its thing! Ah well, it is what it is - and as I mentioned recently: Whether it breaks out or breaks down, do NOT stand in front of the move telling it that it's wrong.
And that's because whichever way it goes, all those Fibolin strings and Weekly Planet prices are only the intermediate targets, not the long-range ones.