
Taking a look at Asian markets
Week beginning March 4, 2013
On Wall Street, Miss Polly is bumping her head again; and in Washington they're talking budget blues again ... for the umpteenth time when Mercury is Retrograde.

Copyright: Randall Ashbourne - 2011-2013
For the past few Obama years, however, it seems that every major decision is put off until Mercury is Retrograde; outcomes are difficult to negotiate; and almost invariably nothing real gets done and the can de jour just gets kicked down the road.
We're back on the same old treadmill. It's all too, too depressing for me to make any predictions this weekend.
We're approaching the midpoint of the Merc Rx period and this week goes into the 3Q-NM lunar phase. In terms of the SP 500 last year, only four of these phases were negative.
They tended to be slightly less positive than the FM-3Q phase, which is now ending. This weekend, we'll take a quick look at Pollyanna and the Nasdaq 100 and then take a closer look at the Asian markets because I want to demonstrate something about the Weekly Planets charts.
It's fairly well accepted that during the Reagan presidency, Nancy kept her favorite astrologer handy to help with not just the timing of decisions, but the direction of decisions.
Just maybe that's part of the reason Ron and Nancy enjoyed a lot more support at the end of Reagan's time in office than was evident at the start.
Just maybe that's part of the reason Ron and Nancy enjoyed a lot more support at the end of Reagan's time in office than was evident at the start.


Safe trading - RA
(Disclaimer: This article is not advice or a recommendation to trade stocks; it is merely educational material.)
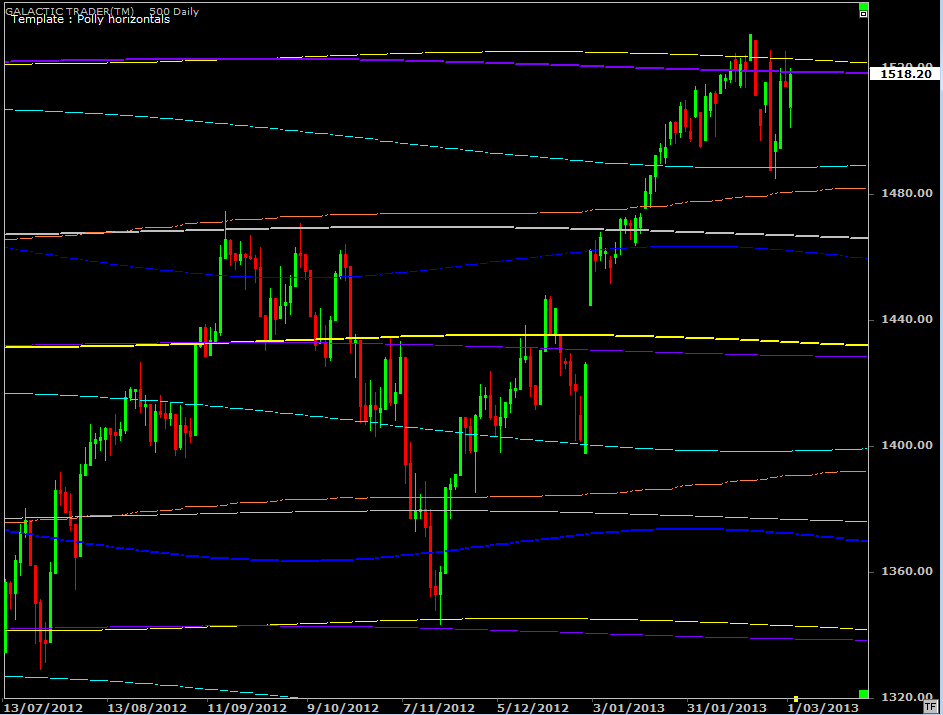
Almost boringly, we'll use the same 500 and NDX charts I've used over the past couple of weekends.
Polly is back at the breakout-or-breakdown barriers of the planetary lines which capped the 2000 and 2007 Bull markets. To be frank, I have no idea at all which way this is going to go.
Overcoming that overhead Uranus/Pluto hurdle opens targets in the range from about 1548 to 1572. If things go the other way, my best guestimate for the downside would be the grey Neptune at 1466.
Overcoming that overhead Uranus/Pluto hurdle opens targets in the range from about 1548 to 1572. If things go the other way, my best guestimate for the downside would be the grey Neptune at 1466.
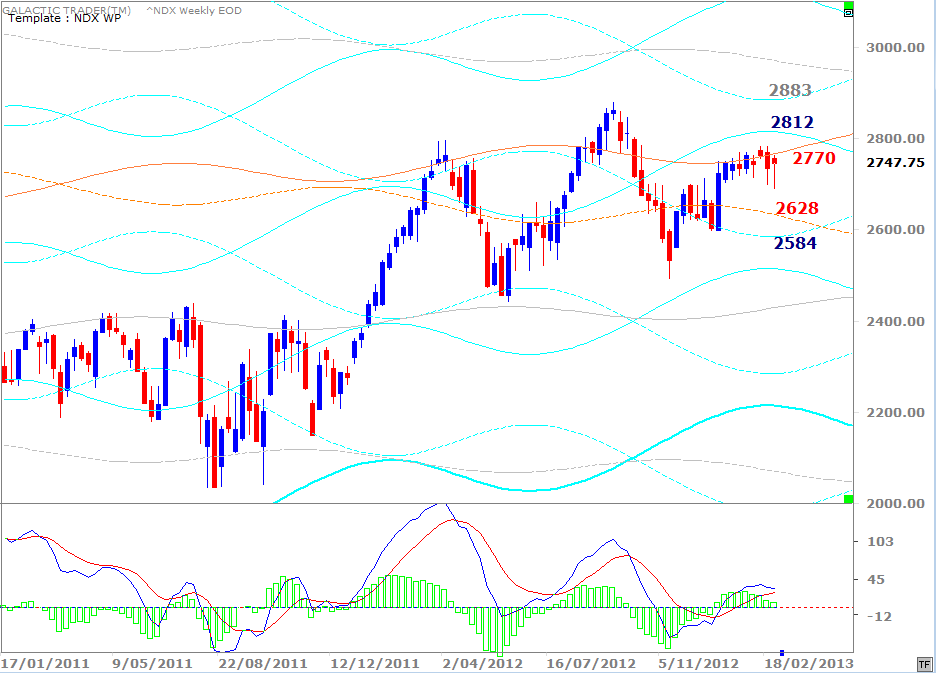
The NDX, above, continues to be stalled by the Uranus barrier now at 2770 ... and continues to make what might, or might not, be the right shoulder of a head & shoulders formation. If it plays out, it's again Neptune I'd expect to stop the drop - at a price around 2440.
Anyway, I really don't know and I want to look at the Asian markets instead, because I want to show you something about my Weekly Planets charts.
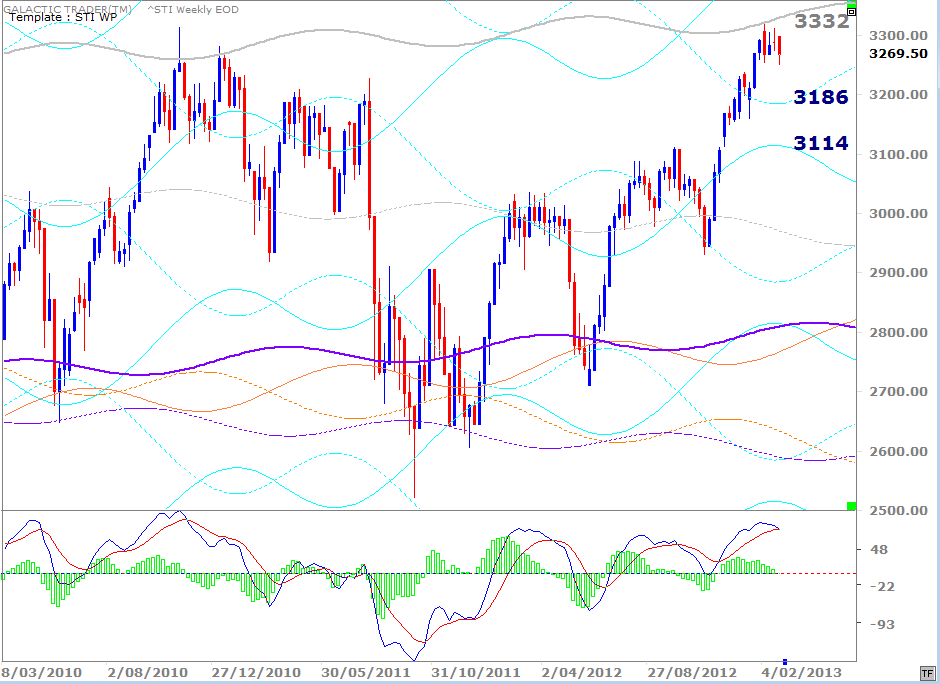
The last time we looked at the Straits Times Index, Singapore, I think was in late January and if you check the Archives, you'll see the upside target was listed as 3319.
Anyway, I really don't know and I want to look at the Asian markets instead, because I want to show you something about my Weekly Planets charts.
The last time we looked at the Straits Times Index, Singapore, I think was in late January and if you check the Archives, you'll see the upside target was listed as 3319.
Well, the high for the STI came in a 3319.19 - and the index has been in correction mode since it was hit. In other words, the hit was quite precise.
That Neptune line, which also capped the 2010 peaks, is currently priced a tad higher at 3332 and I've also updated the two most likely downside targets.
It's also been several weeks since I published Shanghai charts.
That Neptune line, which also capped the 2010 peaks, is currently priced a tad higher at 3332 and I've also updated the two most likely downside targets.
It's also been several weeks since I published Shanghai charts.
Forecast 2013 is now available for sale and download.
Click the button on the right for more details.
Click the button on the right for more details.

NEW:

Forecast 2013 is now available for sale and download.
Click the button on the right for more details.
Click the button on the right for more details.
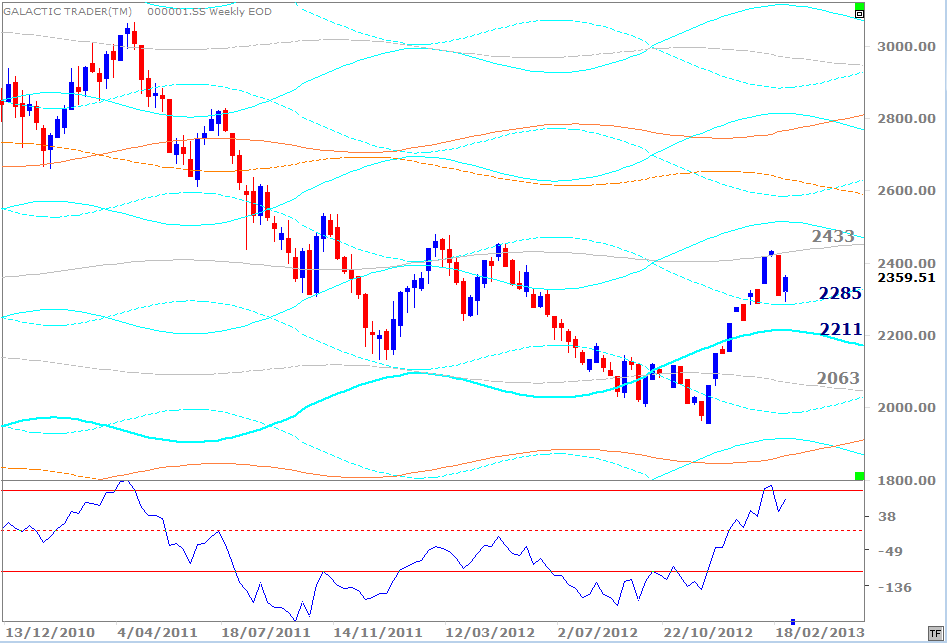
The last time I published this one, the Neptune line was priced at 2407. There was a slight overshoot when Shanghai topped at 2434.48 and then went into correction.
Given the positive divergence which appeared in the oscillator as Shanghai made its final low, and because of the strong rise in that oscillator since then, I'd think the index is far more likely to breakout and the next upside targets are in the range from 2600 to 2800.
If you're a regular reader, you probably already "get" the value of these Weekly Planet charts in helping determine Entry and Exit levels for some very profitable trades. If you're one of the recent arrivals, these two serve as a good example of how it works - and you might want to trawl through the Archives to find your favorite index if it's not in this weekend's edition.
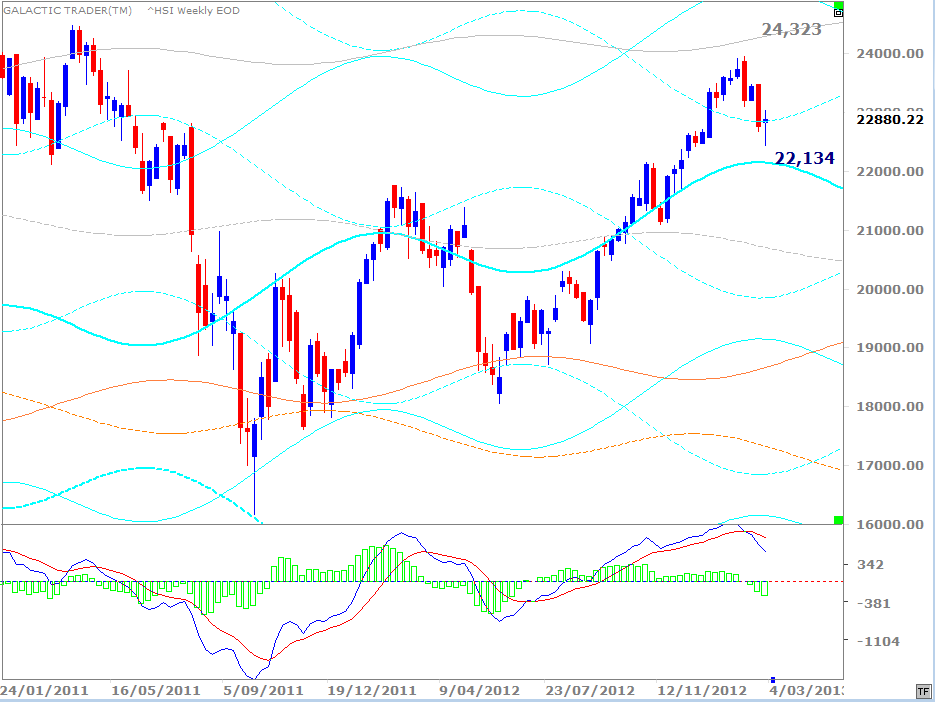
Hong Kong ...
Given the positive divergence which appeared in the oscillator as Shanghai made its final low, and because of the strong rise in that oscillator since then, I'd think the index is far more likely to breakout and the next upside targets are in the range from 2600 to 2800.
If you're a regular reader, you probably already "get" the value of these Weekly Planet charts in helping determine Entry and Exit levels for some very profitable trades. If you're one of the recent arrivals, these two serve as a good example of how it works - and you might want to trawl through the Archives to find your favorite index if it's not in this weekend's edition.
Hong Kong ...
The Hang Seng is one of those which didn't reach the target on the last attempt and the fast MACD has rolled over. Still, there was no really major negative divergence at the high and the index is trying to hold an interim Saturn line as Support.
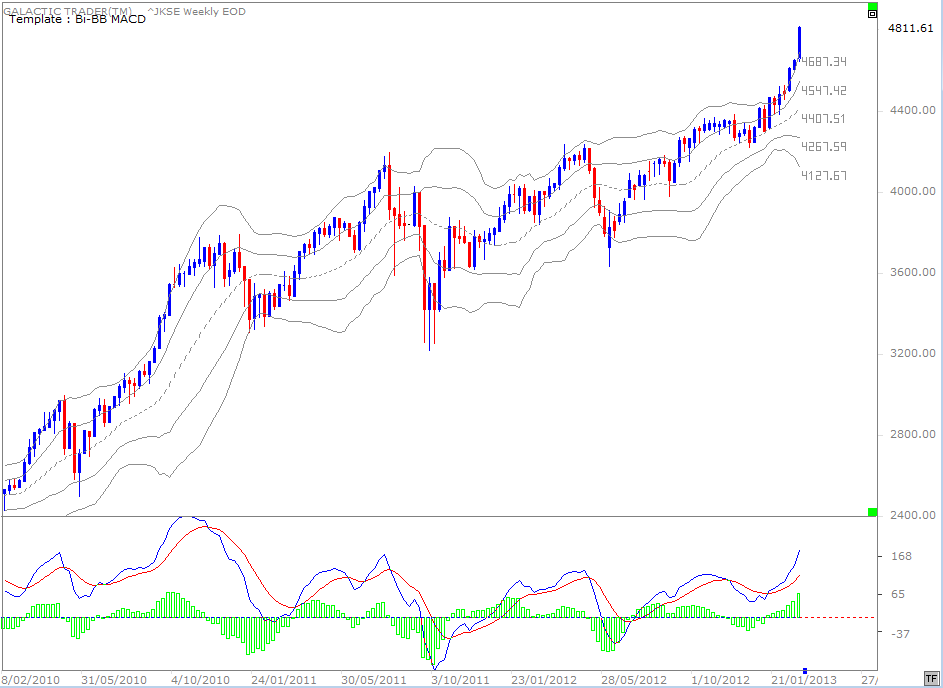
Indonesia ...
Indonesia ...
Jakarta has been on a roll, one of the strongest indices in the region. I haven't created planetary charts for the index yet ... and I'm not sure the number of Indonesian readers warrants it. If the information really is of strong interest to you, drop me a line and I might work it out for future editions.
Just technically in the meantime ... this romp outside the upper boundaries of the Bi-BBs can't be sustained for long, despite approval from the fast MACD. Breaking the BBs normally means a sideways move, or downside correction, is not very far away.
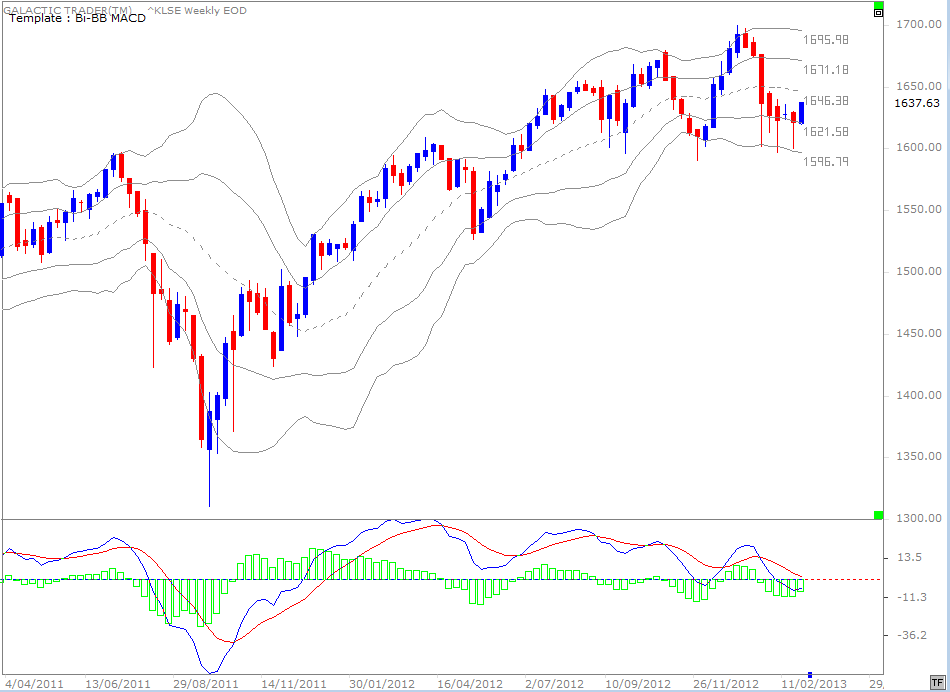
Malaysia ...
Just technically in the meantime ... this romp outside the upper boundaries of the Bi-BBs can't be sustained for long, despite approval from the fast MACD. Breaking the BBs normally means a sideways move, or downside correction, is not very far away.
Malaysia ...
And there's a good current example of precisely how that works in the Kuala Lumpur index. Just cast your eyes back to look at what happened with the price on previous occasions when the top layer of BBs was broken.
Australia ...
Australia ...
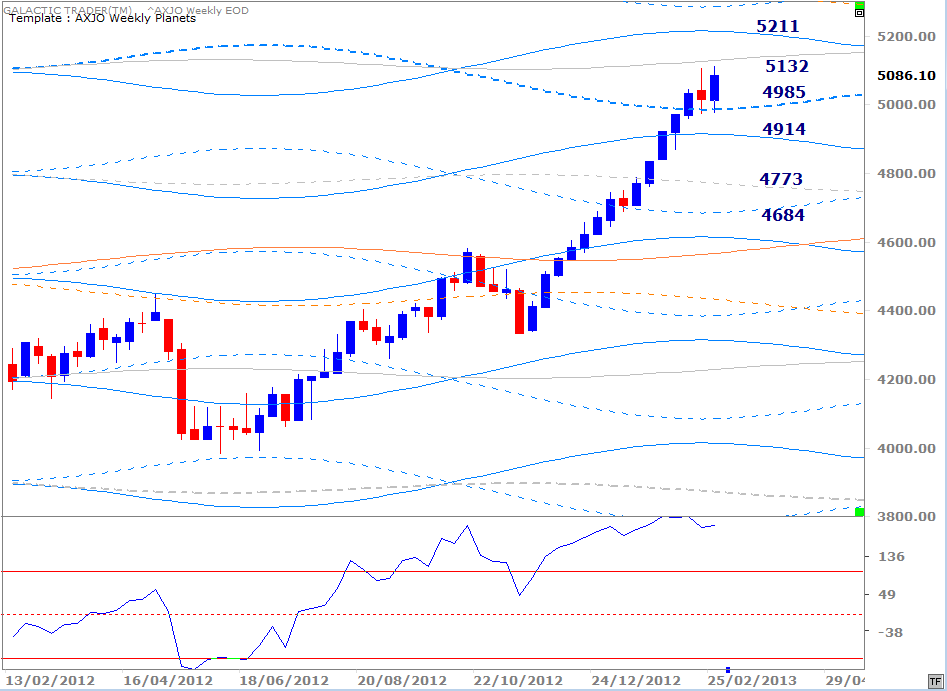
We'll finish, as usual, with the ASX200. The 4985 Saturn level held up as Support for the second week running. A rather mild case of negative divergence is developing in the oscillator, but it's not so bad yet that it sets alarm bells ringing. So far, I see nothing to change my mind that another strong rally is coming before we need to be really cautious about Auntie, even if the index corrects further before launching that rally.