WP: USA, TSX, FTSE, DAX & ASX
Week beginning March 25, 2013
This weekend I'll update the Weekly Planets charts for a range of Western stock indices ... and do the same for Asian markets next weekend.

Copyright: Randall Ashbourne - 2011-2013
Basically, it pits the forces of rebellion and radical change against the entrenched status quo protected by ruling elites. Pluto is big money and big power, big debt and big taxes; Uranus is the voice of "the people", though with the old weirdo in Arien mode these days, the voice is a little like Mao's dictum: Political power grows out of the barrel of a gun.
Squares are always an "action" aspect in astrological symbolism ... and even more inclined that way when the action signs, the Cardinal signs, are involved.
We've been seeing the signs everywhere since the aspect began; from the Arab Spring rebellions to the changes in China, from political angst virtually everywhere to banking crises almost everywhere.
And with Mars, now in its primary home sign Aries, being joined by the Sun and Venus, it adds a potentially explosive charge to the mix in the coming week.
We have a highly critical week ahead going into the Easter break, with the Sun, Venus and Mars all making aspects to the Uranus-Pluto square.
We've discussed the implications of the Uranus-Pluto square at length over the past year or two.
We've discussed the implications of the Uranus-Pluto square at length over the past year or two.


Safe trading - RA
(Disclaimer: This article is not advice or a recommendation to trade stocks; it is merely educational material.)
So, we will take a look this weekend at some intermediate-range Weekly Planets charts for a range of Western indices. I'm not sure anyone can predict reliably what the Plutocrats have in mind for the Wall Street markets.
While the Dow has been making new highs and the SP500 keeps trying to, other markets ... and even the NDX ... display uncertainty.
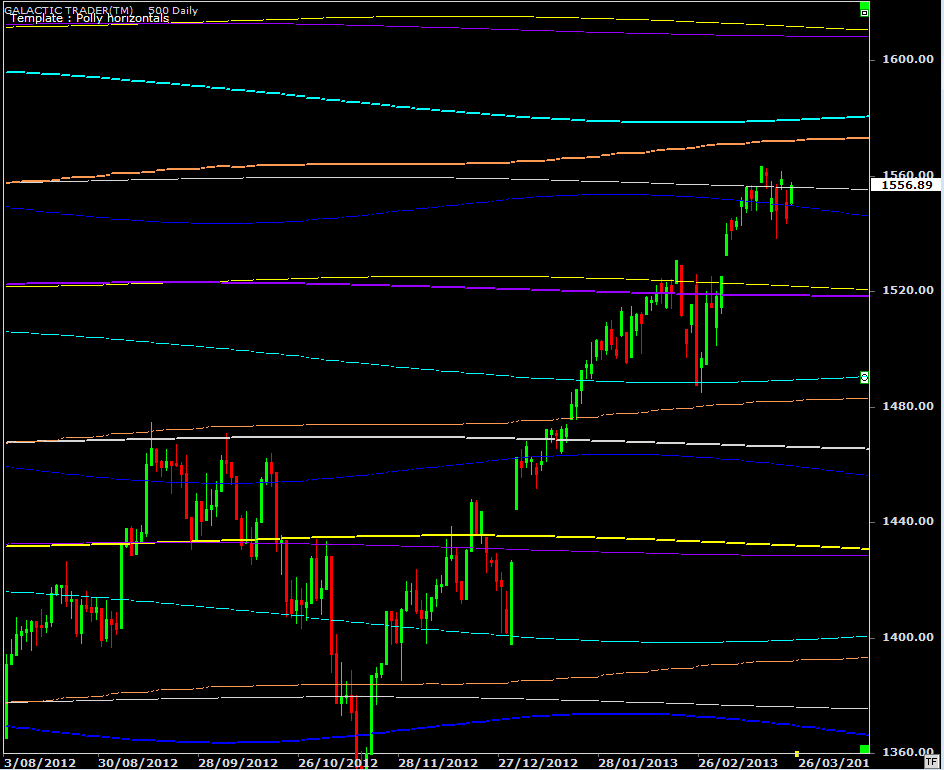
Our first chart this weekend shows important planetary barriers which have a long-term impact on Pollyanna's prices.
While the Dow has been making new highs and the SP500 keeps trying to, other markets ... and even the NDX ... display uncertainty.
Our first chart this weekend shows important planetary barriers which have a long-term impact on Pollyanna's prices.
Miss Polly has huge price gaps all over the place and you might want to consult last weekend's edition in the Archives if you missed it.
The media always promotes these surges as "investors piling back into the market". It's nonsense. "Investors" aren't sitting at their computers at 4.30am forcing a huge gap in opening prices. No, no ... that job falls to the computers run by the big banks.
Basically, the big banks which own the US Federal Reserve; and that would be the Fed that's printing $85 billion a month to deposit with its owners, while the political system struggles to make an annual cut of $85 billion to spending programs.
However, let's not concern ourselves with a political polemic. For the past couple of weeks, the SP500 has been stalled around a Jupiter-Neptune level ... and there are two primary (ie: strong) planetary lines not far overhead. The orange Node line is at 1572 and the cyan Saturn is at 1579. I would expect either of these to provoke a fierce reaction downwards if they're hit before there's a deeper correction.
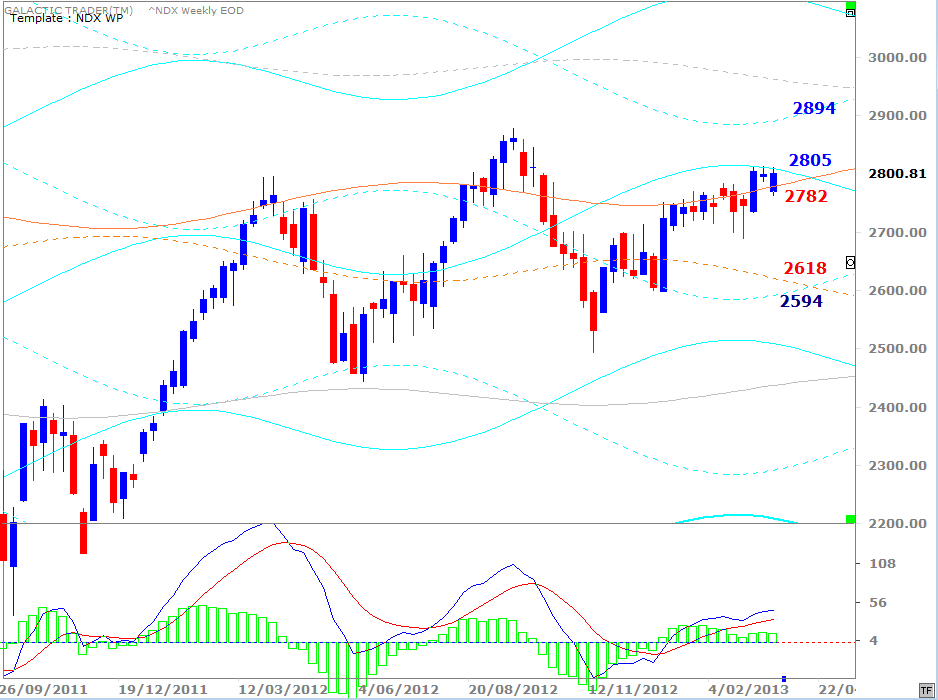
The Nasdaq 100 remains below its peak from October last year - despite the optimisim of the DJI and Pollyanna. Both the signal line and histogram peaks in the fast MACD continue to send warning signals as the NDX continues to be stalled by an overhead Saturn.
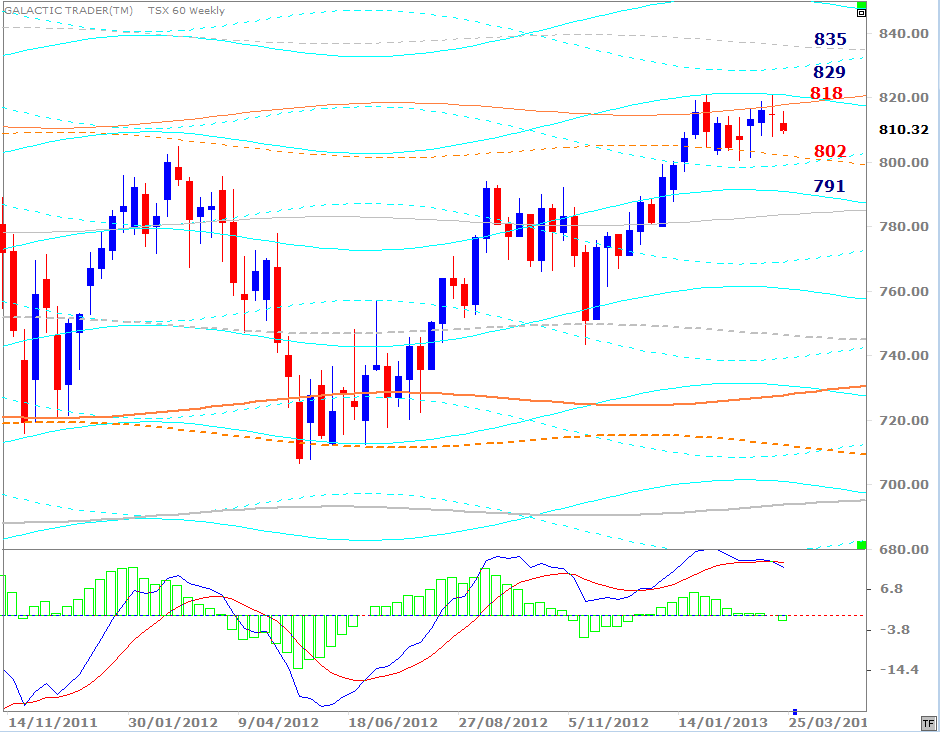
Canada has been stalled for even longer than the Nasdaq - and, again, it's a combined Saturn/Uranus zone that's blocking a breakout.
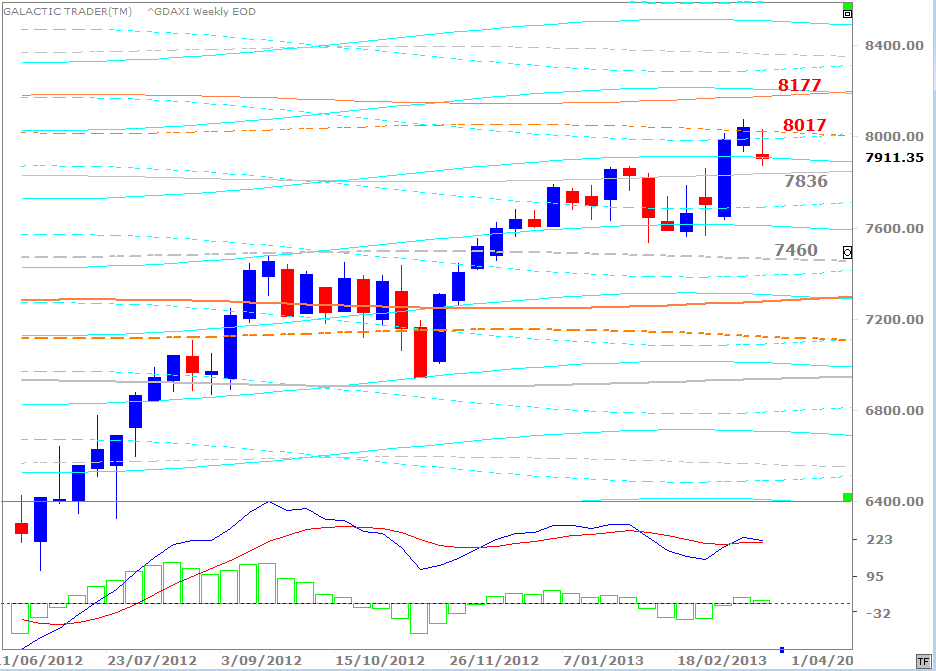
And ditto with the DAX ...
And ditto with the DAX ...
Forecast 2013 is now available for sale and download.
Click the button on the right for more details.
Click the button on the right for more details.

NEW:

Forecast 2013 is now available for sale and download.
Click the button on the right for more details.
Click the button on the right for more details.
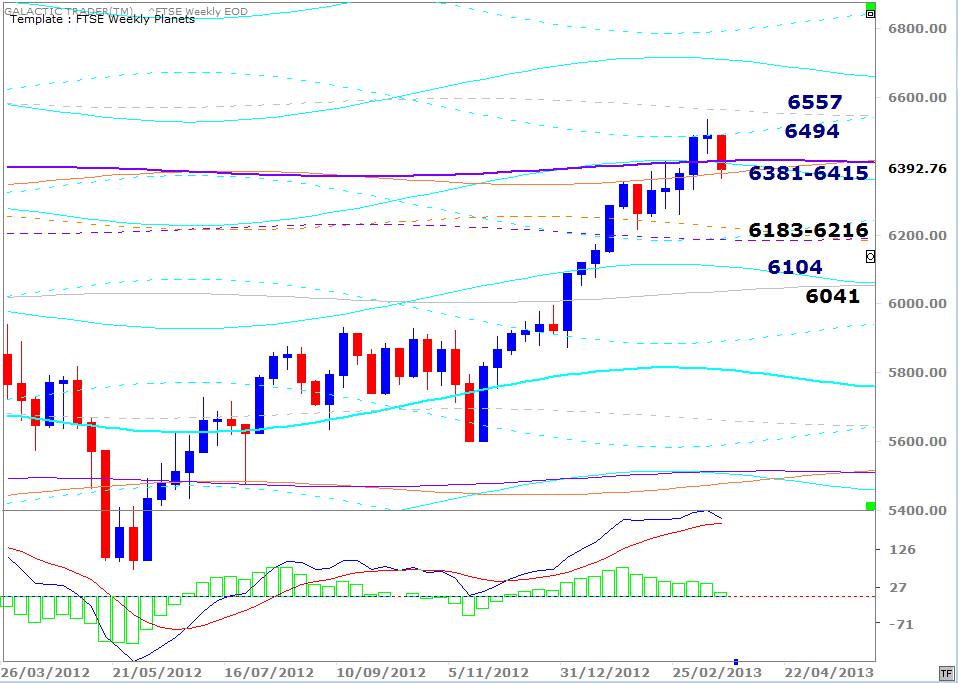
London's FTSE is below. Note the difference in the state of the MACD. While the DAX is showing the same warning signals as the NDX, we're not seeing that build-up yet in the FTSE.
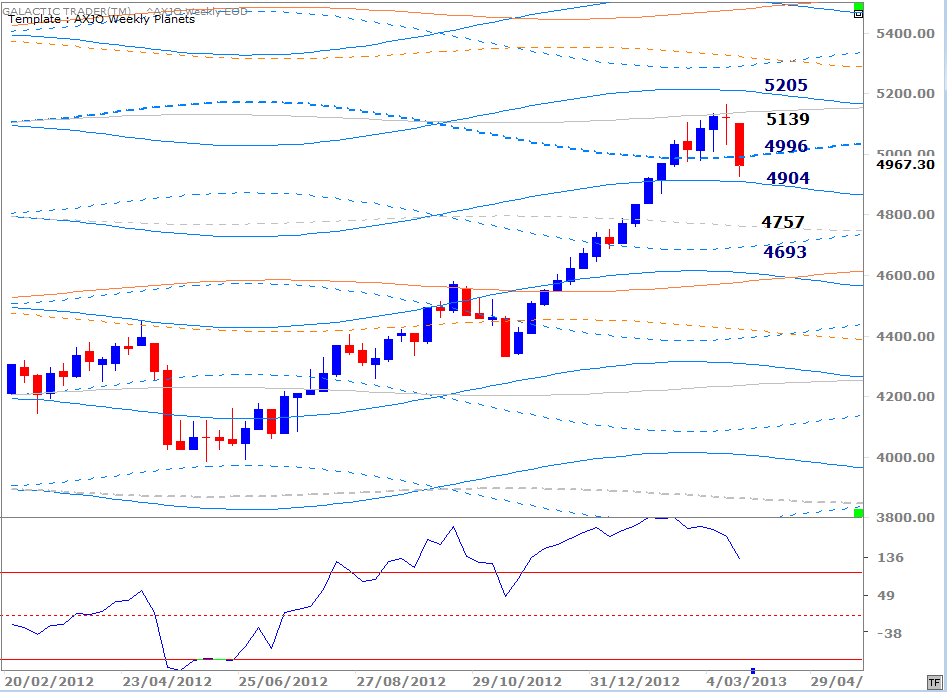
And the ASX 200 is below ...
I've mentioned in the past couple of weeks the negative divergence being displayed by the Canary on this index and regular readers will know this is a Neptunian index, so the false break and drop from the 5139 line isn't really an unexpected surprise.
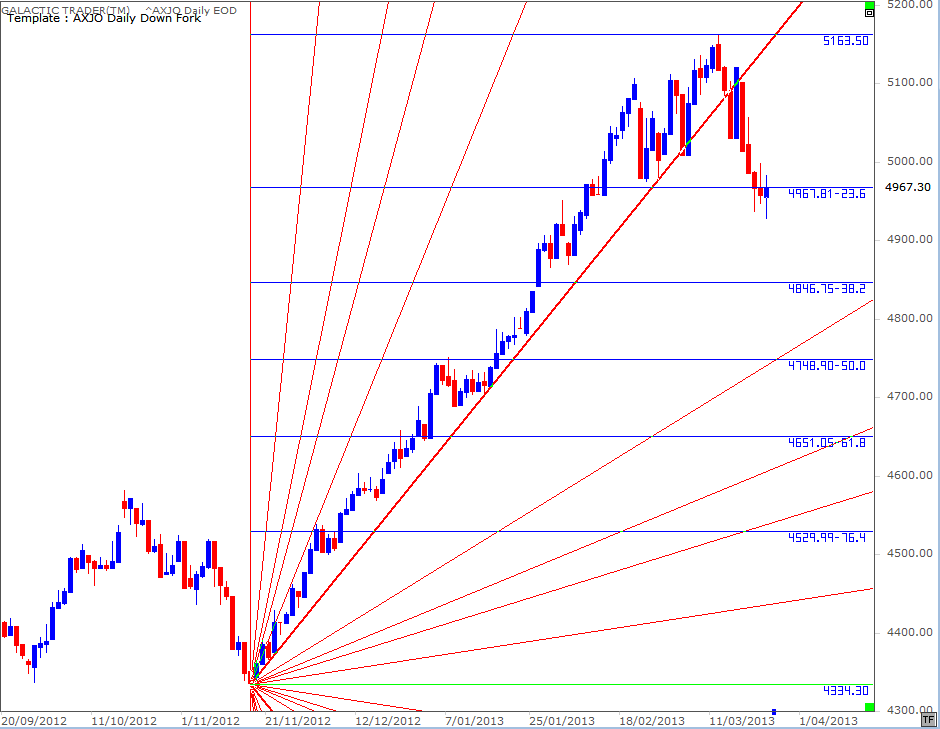
And nor should be the price level which stopped the drop ...
And nor should be the price level which stopped the drop ...
It serves as a good example of applying, in real time, the technical lessons about gaps, Fib Rx and Fib Xt levels I went through last weekend.
I finished last weekend with these words: "You might not get a nice gold star from the teacher. Learn the lesson well, though, and you just might get a few gold bars - real ones ... that you earned for yourself!"
There are know-it-alls out there who'll happily bore you witless with their opinion that there is no such thing as "a Holy Grail" when it comes to making stock market profits. In fact, there are probably at least 100 of them. There isn't one that will guarantee you the exact top and precise bottom of every rally and decline.
But, I stand by what I said last weekend ... learn a few simple lessons really well and you'll learn how to make money.
Next weekend ... an update on Asia.