A lesson in gaps, FibRx and FibXt
Week beginning March 18, 2013
Hello, boys and girls ... this weekend we're going back to school, putting aside most of The Spooky Stuff to revisit some lessons about the techie stuff.

Copyright: Randall Ashbourne - 2011-2013
Last weekend, I showed you the normal behaviour of the Wall Street markets during Mercury Retrograde phases, which occur for about 3 weeks 3 times a year.
This one did not follow the usual pattern and, instead, most markets rallied throughout the period after a quick dive right at the start.
It is possible that markets will now change direction, along with Mercury. The DJIA has broken above its 2007 peaks and the SP500 is very close to doing so - but the Nasdaq stalled out many weeks ago.
This coming week, the Sun and Venus move out of Pisces into Aries and we enter the 1Q-FM lunar phase. The sign change puts the Sun and Venus into a coming conjunction with Uranus and a square to Pluto - and these two have a more reliable track record of forcing a mood shift than does Mars conjunct Uranus.
Oh, don't groan! We all know you peek inside the fortune teller's tent for a weekly planetary fix ... but you're becoming too addicted to the mystical and mysterious.
It's time for a dose of the real world, though we will have a brief look at some of the astrological transits coming up.
It's time for a dose of the real world, though we will have a brief look at some of the astrological transits coming up.


Safe trading - RA
(Disclaimer: This article is not advice or a recommendation to trade stocks; it is merely educational material.)
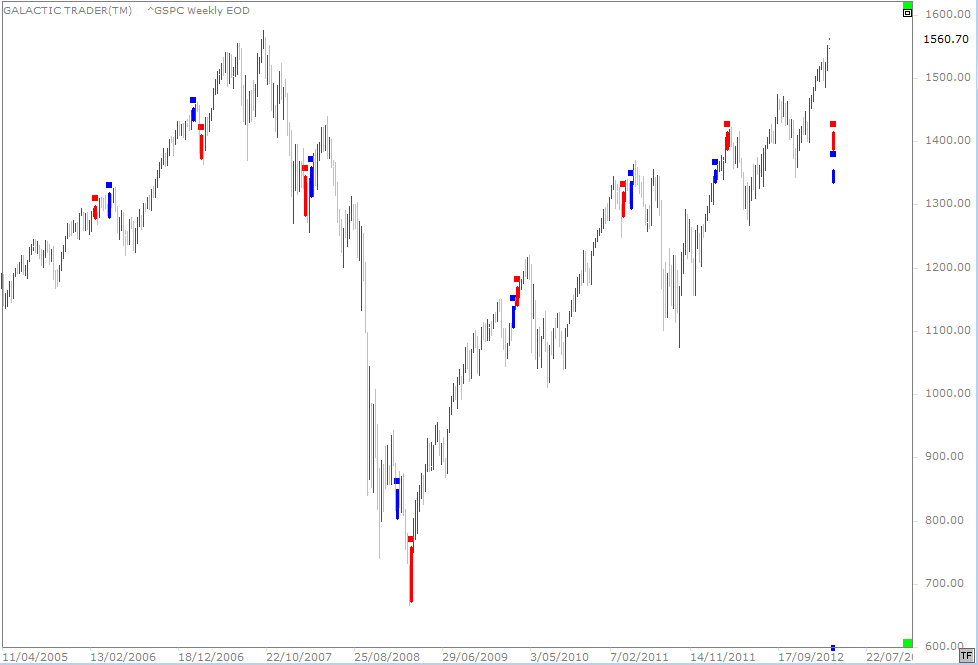
Last weekend, I published a chart showing the history of Mars conjuncting Uranus and squaring Pluto and warned you off listening to anyone who started raving on about "the Mars-Uranus crash cycle".
The Sun and Venus each conjunct Uranus once a year ... and the impact is, usually, more reliable as a potential trend turner than Mars.
The Sun and Venus each conjunct Uranus once a year ... and the impact is, usually, more reliable as a potential trend turner than Mars.
In the chart above, Sun-Uranus conjunctions are the red bars; Venus-Uranus conjunctions are the blue bars ... and there are 7 of them, not counting the one coming this week.
Which is interesting, because 4 of them are right at tops, or very close to, and 2 of them are at, or very close to, bottoms. Have a look; there are 5 or 6 trend changes out of a possible 7 instances. Not a tendency to be ignored lightly.
Now let's have a quick look at Miss Pollyanna's Merc Rx performance ...
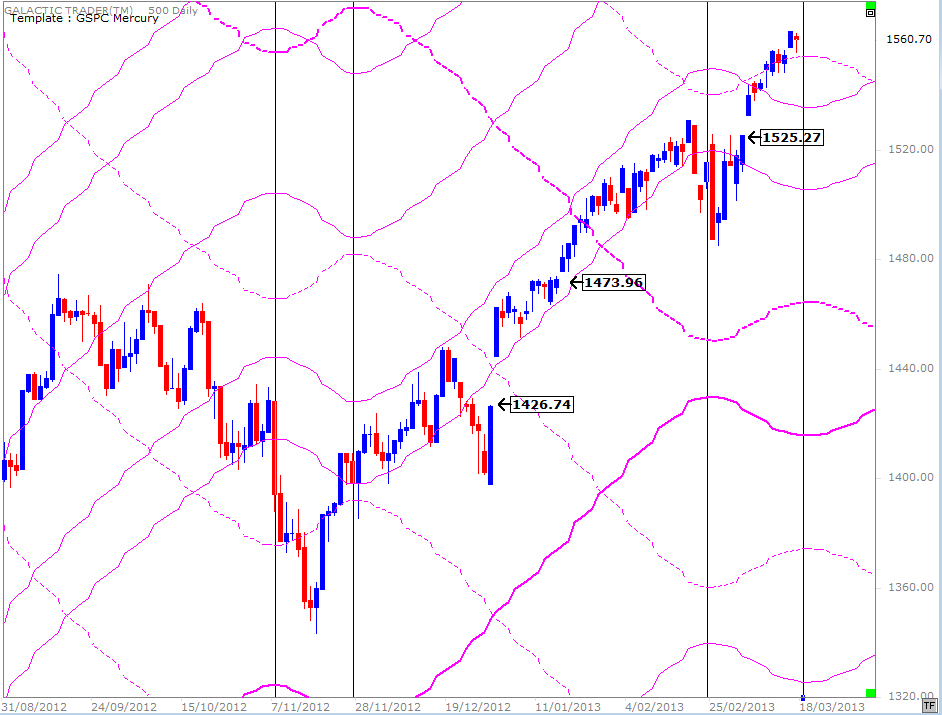
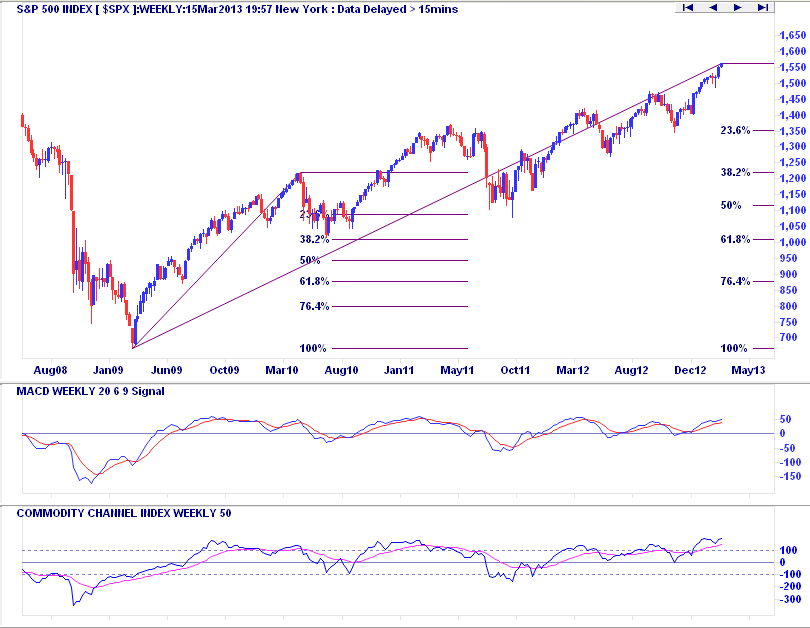
Ignore, for the moment, the boxed prices. I used this chart last weekend to show the spurt-and-reverse tendency which is normal during the Merc Rx phases. The current phase started out that way ... for just one day. It does create the danger that the Merc Rx rally will be undone as the planet goes Direct again, especially with the money-and-values planet, Venus, moving out of the comfortable territory of Pisces.
If you remember the Greek mythology, Saturn cut Uranus's dangly bits off and threw them into the ocean - causing a bit of froth and bubble until Venus popped forth, where Neptune created a special chariot for her to be drawn safely back to shore. So, Venus and Neppy are good buddies and Venus tends to be at her best while travelling through Pisces.
But, look ... enough of les Spookies for this week. What I want you to look at are the price gaps. Firstly, look at the last 3 bars. There was a gap open on Thursday which jumped above Wednesday's close. On Friday, that gap was filled. There are three other downside gaps which remain. There may even be four. I can't remember exactly when I started keeping a manual chart of the index to overcome the NYSE's lies about the real Open price on any given day.
Now, why is it important to know where the gaps are?
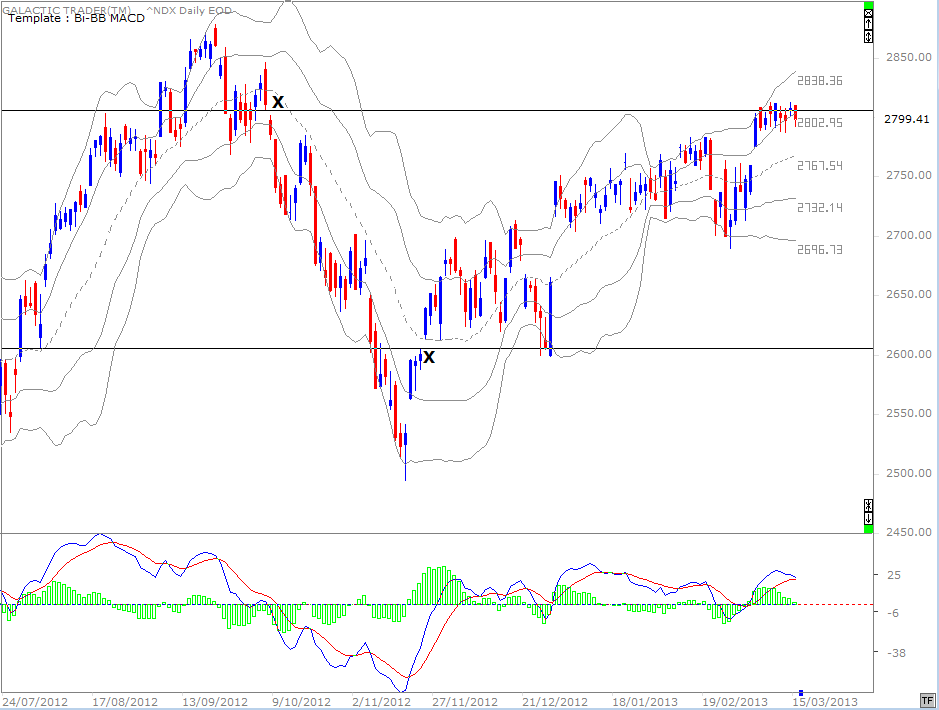
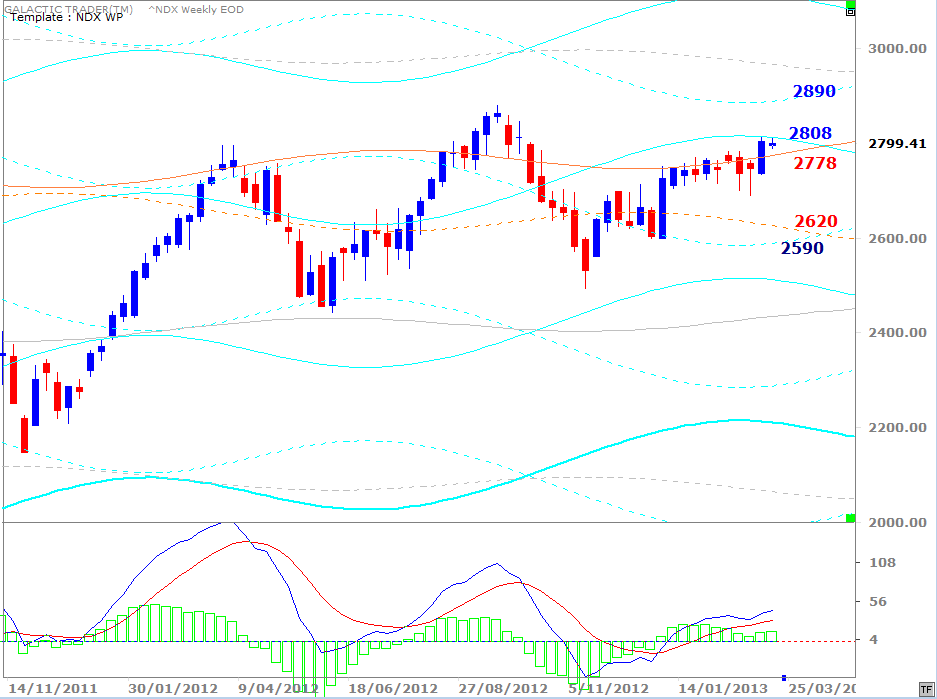
Let's look at the Nasdaq 100 ... which, does NOT tell dirty little lies about its real Open price.
If you remember the Greek mythology, Saturn cut Uranus's dangly bits off and threw them into the ocean - causing a bit of froth and bubble until Venus popped forth, where Neptune created a special chariot for her to be drawn safely back to shore. So, Venus and Neppy are good buddies and Venus tends to be at her best while travelling through Pisces.
But, look ... enough of les Spookies for this week. What I want you to look at are the price gaps. Firstly, look at the last 3 bars. There was a gap open on Thursday which jumped above Wednesday's close. On Friday, that gap was filled. There are three other downside gaps which remain. There may even be four. I can't remember exactly when I started keeping a manual chart of the index to overcome the NYSE's lies about the real Open price on any given day.
Now, why is it important to know where the gaps are?
Let's look at the Nasdaq 100 ... which, does NOT tell dirty little lies about its real Open price.
Now, when clear gaps open up in a price chart, regardless of whether it's an index or an individual stock, they are ALWAYS filled and often retested, at some point in the future.
I've put a black horizontal to mark a gap which opened to the downside on the NDX when it went into dive mode last September and marked the relevant gap with an X. We can see the stalling action over the past couple of weeks has been filling and retesting that gap.
There is a lower black horizontal and X on the chart ... and we can see how it was closed and tested a few weeks later. Now, these are not, of course, the only gaps on the NDX chart - and many have yet to be filled.
I go through this exercise because it is a valuable lesson in the techie side of things.
We'll turn our attention now to that dead Italian guy ... and the maths lessons he picked up from Arab scholars, who got it from Alexander's Greeks, who undoubtedly picked it up from Indian gurus in those brief periods Alex's boys weren't being trampled by war elephants.
Forecast 2013 is now available for sale and download.
Click the button on the right for more details.
Click the button on the right for more details.

NEW:

Forecast 2013 is now available for sale and download.
Click the button on the right for more details.
Click the button on the right for more details.
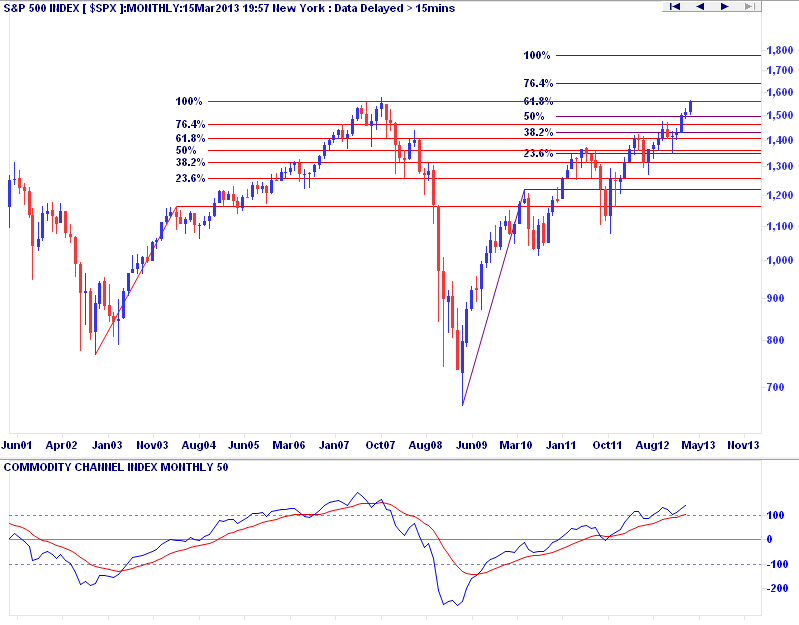
We will deal firstly with Fibonacci Extensions. There is a whole chapter on this in The Technical Section of The Idiot & The Moon, but a lot of you reading the Eye of Ra don't have the book and many of you who do, I'm sure, wouldn't mind a refresher on up-to-date charts.
Please note I'm using the free-or-cheap Incredible Charts software for this exercise. You can download it from the links under the "software" button in main navigation menu.
Firstly, go to the red FibXt levels on the left of the chart. I've linked the bottom of the 2002/03 Bear with the high before the first major correction of the post-Bear rally. You will see there was stalling at key Fibonacci projections into the future ... and that the Bull run topped out with a short-lived false break above the 100% extension of the first rally leg.
Now, on the right of the chart, I've repeated the exercise; linking the Bear bottom with the last high before the first significant correction. Once again, we can see the price stalling which occurs as the rebound meets each Fibonacci extension into the future.
The current, blue 618 Xt level corresponds with the 2007 High in Pollyanna.
Now for the next part of the lesson - the long-range Canary, or what I sometimes call the Big Bird. No croaking! The signal line is positive, it is holding above the +100 line, and there is no negative divergence between the oscillator peak and the current price peak.
Which tells us an important something. It is very, very unlikely that the rally is finished. We would expect to see at least one instance of clearcut negative divergence before this is all over.
Or, for those of you who have Forecast 2013 ... Saturn in Scorpio may be negating the influence of Jupiter past Taurus.
If we take the implications from the past Bull run, it would seem that Miss Polly has two further targets in mind ... the 764 Xt at 1642, or the 100% extension at 1773.
From 666 to 1773 ... the sign of the Devil to the Boston Tea Party. Hmmmmm ... now that would be truly Spooky Stuff, eh?!
Okay, so having looked at where we are with the FibXT levels, let's review the Fibonacci Retracement tool. On the left, we again see the Bear bottom and the top of the first rally leg. There's a lot of stalling at the 236 Rx and the correction finally stops at the 382 level.
So, we would expect - once the entire Bull run is finished - that there will be a minimum FibRx down to the then 236 or 382 level. IF the current rally leg is finished and in need of an intermediate correction, there is a chance the downside is as low as about 1350. To get a more refined handle on the depth of any correction, I'd be more inclined to adopt the safer option of drawing the Fib Rx levels from the bottom in 2011, rather than using the 2009 Bear Low.
So that, boys and girls, concludes the lesson in gaps, Fib Rx and FibXt. It is, I hope you will agree, every bit as interesting and a whole lot more reliable than ... oh, Mercury Rx, for example!
As I keep saying - astrological expectations do NOT over-ride technical conditions. Everyone who wants to trade safely, reliably and profitably needs to give more weight to learning a few tech-head skills than the mystical stuff I often waffle on about!
But ... *ahem* ...
Why, yes ... it IS my Weekly Planets chart for the NDX. Last week the Saturn was still at 2812 - again the Nasdaq 100's High for the week. One is not so much a zombie that one can live on tech-head brains alone, y'know!
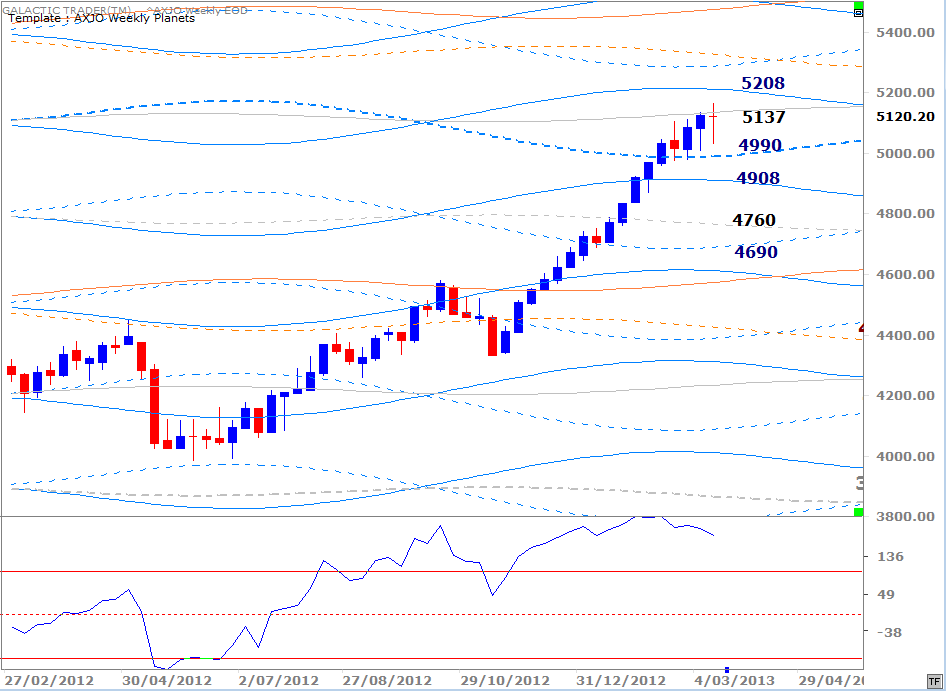
And Auntie, my home index, the ASX200. Negative divergence still building in the oscillator, too.
Okay, that's it for the week! Don't wander off whining that I haven't put up Weekly Planets charts for the rest of the indices. Time for you to do your own damn homework and go play with price gaps, Fibonacci numbers, and Canaries singing sweetly or croaking hoarsely.
You might not get a nice gold star from the teacher. Learn the lesson well, though, and you just might get a few gold bars - real ones ... that you earned for yourself!