Wall Street, Europe, India - and Mars
Week beginning March 11, 2013
Three things for the week ahead - the fishy New Moon, Mars entering Aries, and the final week of the current Mercury Retrograde period.

Copyright: Randall Ashbourne - 2011-2013
Since I published a variety of Asian markets charts last weekend, I thought I'd swap back to Europe and India in this edition.
Last weekend, I highlighted a couple of exact hits in the Asian indices on my Weekly Planets charts targets. I'll show you a couple of other exact hits in the NDX and ASX during the rallies over the past week.
This week kicks off with the statistical high period of a New Moon and with Mars changing signs into Aries, which launches a new Martian cycle through the zodiac over the next couple of years.
And we will be in the final week of the current 3-week Mercury Retrograde phase.
Those of you who have bought Forecast 2013 may wish to consult the chapter on market performance as Mars travels through Cardinal signs ... and, in particular, what has tended to happen with Mars in its primary home sign.
And it would also be worth consulting the Moon chapter, starting on Page 17, to see exactly how your favorite index performed during the lunar phases for the first few months of last year.
And it would also be worth consulting the Moon chapter, starting on Page 17, to see exactly how your favorite index performed during the lunar phases for the first few months of last year.


Safe trading - RA
(Disclaimer: This article is not advice or a recommendation to trade stocks; it is merely educational material.)
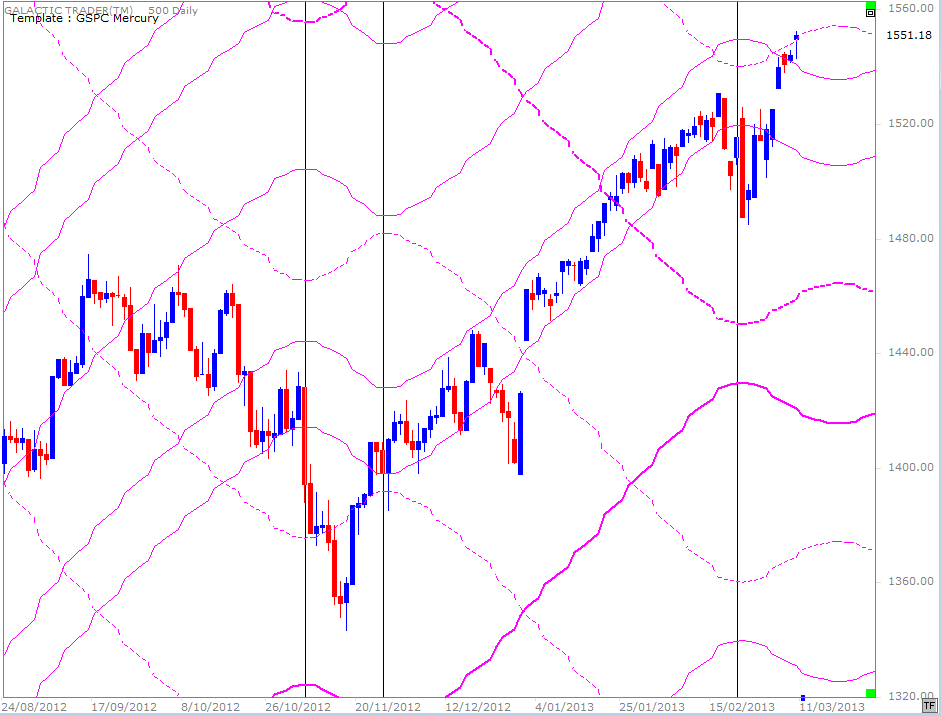
It's Mercury we'll start with this weekend. As the phase was coming up, I indicated that what tends to be normal is that markets will start a trend at the Rx date which changes course halfway through ... and by the time of the Mercury Direct date a few weeks later, prices are often back within 1% of where they were on the Rx date.
You can see this tendency at work on the chart above where I've marked the Mercury Rx period late last year with black vertical lines; the Rx date starts a downward plunge ... which does a complete turnaround halfway between the two black lines ... to finish the phase with price back within the range of the bar at play on the Rx date.
Now, as I said, this is the "normal" behaviour of at least the Wall Street markets. It doesn't work every single time ... but we need to be aware of the possibility for markets to reverse course in the coming week; particularly since we enter the statistically negative phase between New Moon and Full Moon.
The other major astro event of the coming week is Mars moving out of Pisces into Aries, which means it will soon conjunct Uranus and square Pluto. We're almost certain to see more armed rebellions making headlines in the next few weeks.
If you happen, though, to come across any strident astrologers screeching about "the Mars-Uranus crash cycle", please consult last year's Archives.
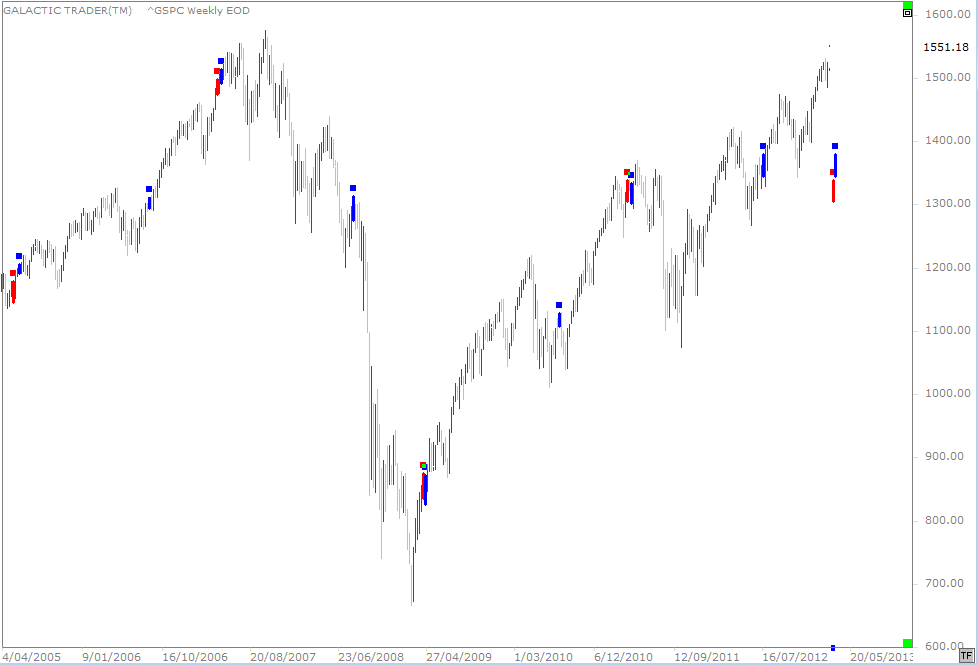
On the chart above, previous conjunctions between Mars and Uranus are marked with the thick red bars; the squares to Pluto are marked by the heavy blue bars.
Some of them occur sort-of, more-or-less, near highs ... and some of them don't do diddly. Conclusion - there is no reliable prediction that can be made about what will happen just because Mars is making Uranus/Pluto aspects.
Now, onto the Nasdaq 100 ...
Some of them occur sort-of, more-or-less, near highs ... and some of them don't do diddly. Conclusion - there is no reliable prediction that can be made about what will happen just because Mars is making Uranus/Pluto aspects.
Now, onto the Nasdaq 100 ...
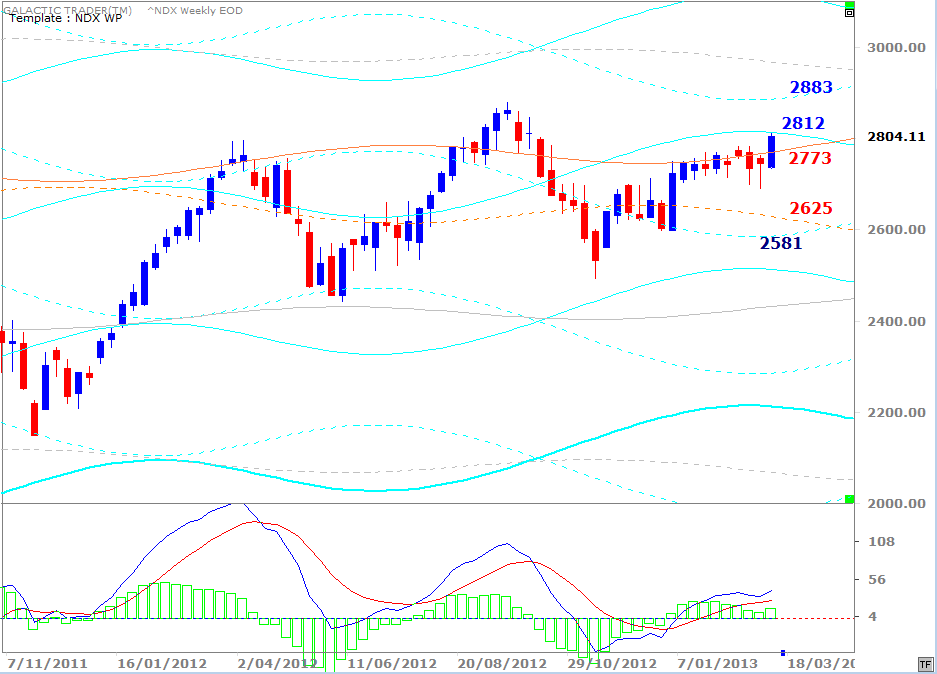
I indicated last weekend that I really had no idea whether Pollyanna and the NDX were going to breakout northwards, or break down. About the SP500, I said: "Overcoming that overhead Uranus/Pluto hurdle opens targets in the range from about 1548 to 1572."
Pollyanna's high for the week was at 1552.48, inside the lower end of the stated range. And I published the NDX Weekly Planets chart, showing the upside targets if it managed to finally breakout above the Uranus line now priced at 2773. The high for the NDX came in at 2812.73 - basically an exact hit on the 2812 target which has been marked on the Weekly Planets chart for the index for ages.
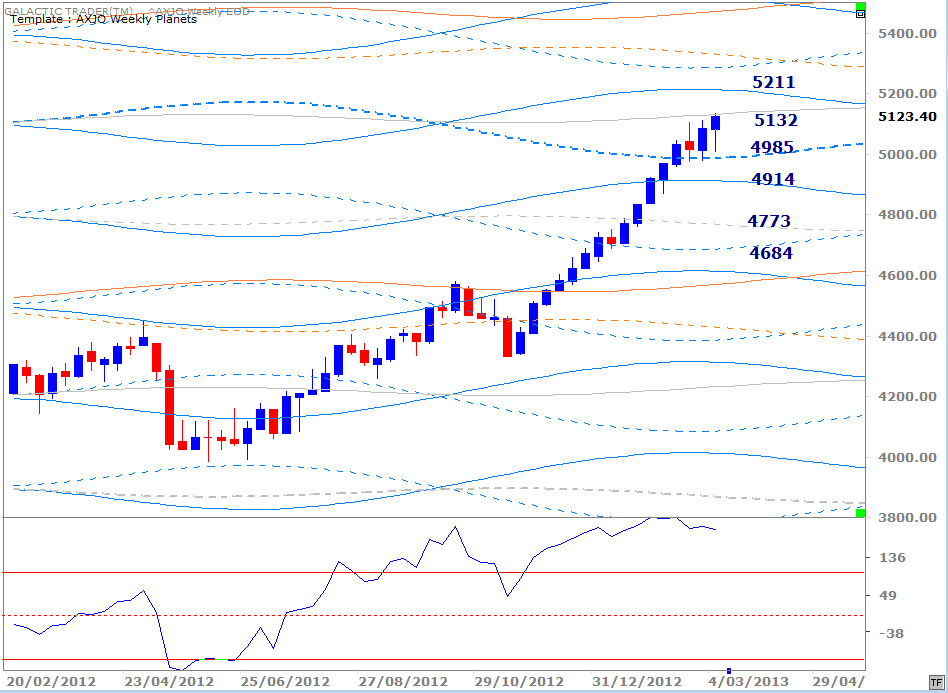
The ASX 200 put in a similar performance.
Pollyanna's high for the week was at 1552.48, inside the lower end of the stated range. And I published the NDX Weekly Planets chart, showing the upside targets if it managed to finally breakout above the Uranus line now priced at 2773. The high for the NDX came in at 2812.73 - basically an exact hit on the 2812 target which has been marked on the Weekly Planets chart for the index for ages.
The ASX 200 put in a similar performance.
Forecast 2013 is now available for sale and download.
Click the button on the right for more details.
Click the button on the right for more details.

NEW:

Forecast 2013 is now available for sale and download.
Click the button on the right for more details.
Click the button on the right for more details.
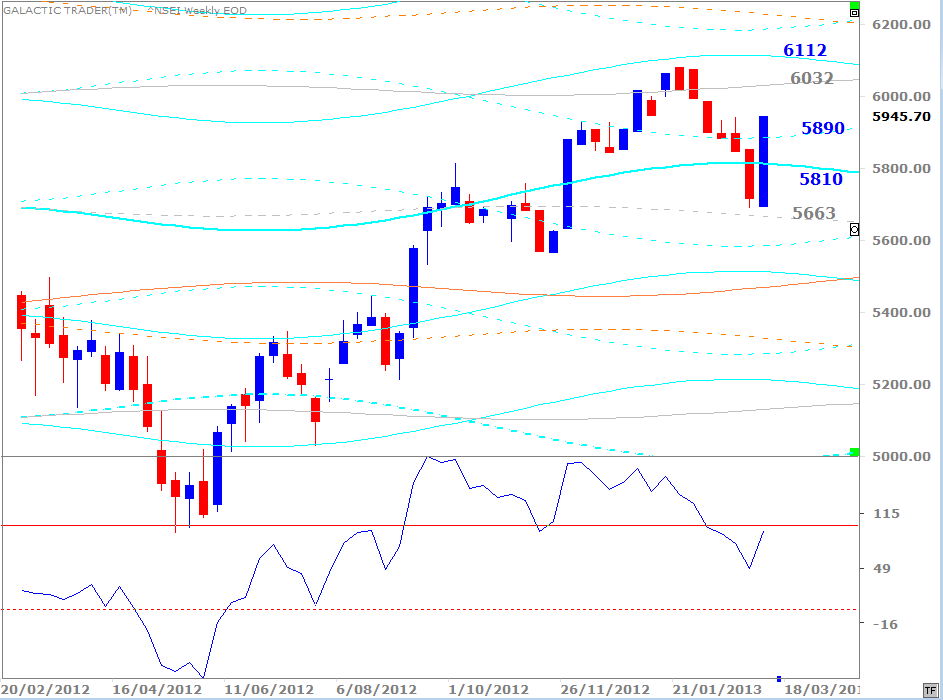
The 5132 target has been marked on Auntie's charts for weeks - and she obliged last week, making a small overshoot to 5135.7 before backing off.
Obviously, in both cases, if the rally mode ignores the Merc Rx tendency, the next obvious targets are marked.
Now, since it has been a while since I updated the European charts ...
England:
Obviously, in both cases, if the rally mode ignores the Merc Rx tendency, the next obvious targets are marked.
Now, since it has been a while since I updated the European charts ...
England:
The FTSE finally broke through the 6412 level and came to a halt at a weekly Saturn line.
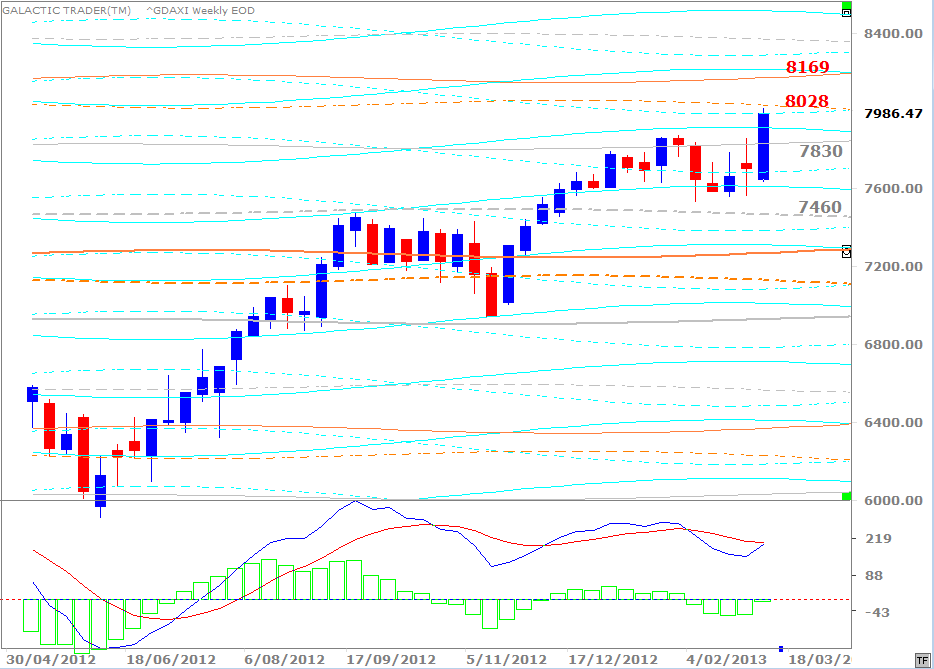
Germany:
Germany:
The DAX cracked the Neptune ceiling - and like London, was stopped by Saturn. I would think, given the consolidation in the index within a Neptune/Uranus zone last year, that it probably wants to reach the overhead Uranians in the range from 8028 to 8169.
France:
France:
India:
There is no need to explain these. I've given examples last weekend and this edition of just how precise these targets are. Those of you who have Forecast 2013 should also consult that section which details the exact long-range targets for the key American, European and Asian indices for this year.
Have a look, even if you're not Australian, at the ASX chart on Page 43, and compare where the index was in early January and where it closed this past week. Shocking, eh?!
And the DAX ... and the FTSE ... and the CAC ... and Pollyanna ... and the NDX. You'd have to be pretty pleased, surely, that those targets alone were worth the $20 price tag! And now that you KNOW they work, don't ignore the portents for the rest of the year!