
Only 2 options ... bottom now or crash
Week beginning June 4, 2012
There are only two probable outcomes for stock markets in the week ahead - either they will form a low for at least a second degree bounce ... or they have already entered the worst stage of the first stage of a Bear crash.

Copyright: Randall Ashbourne - 2011-2012
I also showed a research chart on the impact of Lunar Eclipse Full Moons on the SP500 over the past decade or so.
Well, the Full Moon arrives early Monday, US time, and it will be a significant day in the markets. For starters, it's a Sagittarian loony - and you may recall that I've mentioned in the past that the Moon in Sadge frequently brings wide-range days where either the optimism OR the fear gets wildly exaggerated.
Europe and Wall Street displayed the fear side on Friday. The question is: Is it the start of the worst stage of the first stage of an all-out crash, or will it be a near-term exhaustion?
And to try to get some sort of guide, we need to turn our attention to what the charts are telling us.
Last weekend I poured cold water on the then-popular theories that the correction was over or, at a minimum, a significant bounceback had started.
Neither the pattern of trend, nor the state of the charts, warranted any optimism last weekend.
Neither the pattern of trend, nor the state of the charts, warranted any optimism last weekend.


Safe trading - RA
(Disclaimer: This article is not advice or a recommendation to trade stocks; it is merely educational material.)
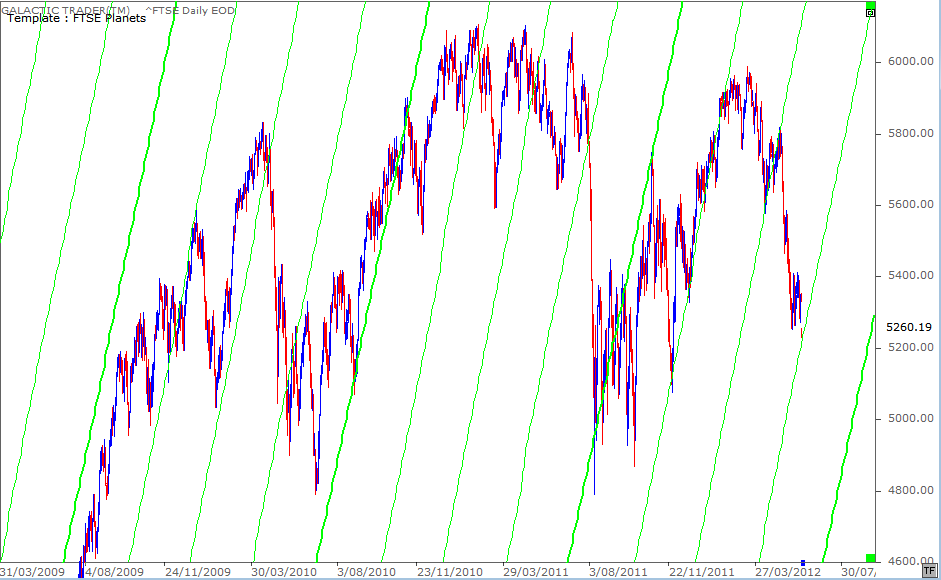
We will begin the exercise by taking a look at the FTSE.
I want to begin with this chart because it highlights the potential for an optimistic outcome. It shows the impact of rising Sun lines on price moves in the FTSE since the Bear bottom in 2009.
The index has had a distinct tendency to attach itself to one of these rising Sun lines during almost all of its uptrends, even the ones which have been relatively short-lived.
So, are we going to get a case of deja vudoo in the coming week?
The index has had a distinct tendency to attach itself to one of these rising Sun lines during almost all of its uptrends, even the ones which have been relatively short-lived.
So, are we going to get a case of deja vudoo in the coming week?
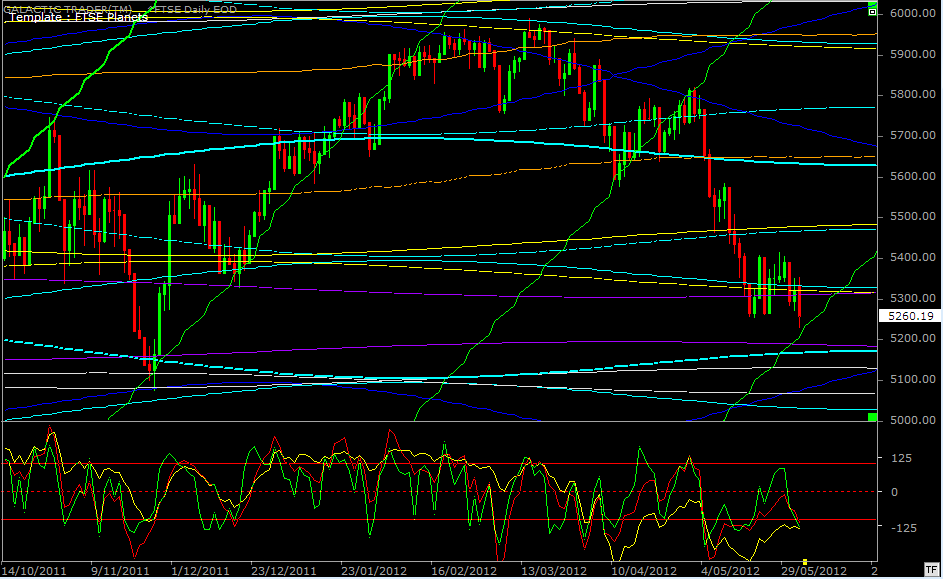
You'll just have to excuse my use of a black chart. If you're trying to copy and paste this edition for printing, I suggest you delete this chart or you'll run out of black ink.
As y'can see, the FTSE has potential planetary support from the Sun coming back into play from early next week ... and there is some positive divergence in the long-range yellow Canary, which lends some technical backing to the idea (it's rising, while Price is lower).
No cast-iron guarantees here, of course ... but the chart does show some potential to bounce from one of the horizontal planetary price levels and attach itself, even if only for a second-degree bounceback, to the rising Sun angle, as it has so often in the past.
Okay, there's the optimistic outlook. No need to repeat the exercise with other indices, since the FTSE isn't about to buck the overall trend and go it alone.
We are approaching a Full Moon, which has a statistical tendency to bring in a low; there is a little bit of positive divergence on the FTSE's daily Canaries; and this index has had a fairly reliable habit of attaching itself to the Sun.
And now for the very big but!
I pointed out last weekend with the research chart that Lunar Eclipse Full Moons are NOT a reliable stop-and-turn signal.
Worse than that, we are now on countdown for the first exact hit of Uranus square Pluto later in June. I discussed all of this in Forecast 2012 - along with the cyclical implications of Jupiter in Taurus.
It is entirely possible that we are now in crash phase and that Friday's huge drops marked the start of the biggest drops ... what, in Elliott Wave terms, would be iii of 3 of 1. Or to put it simply ... the downtrend waves are subdividing and the first of the big drops is only just starting and there won't be an exhaustion until late in the month.
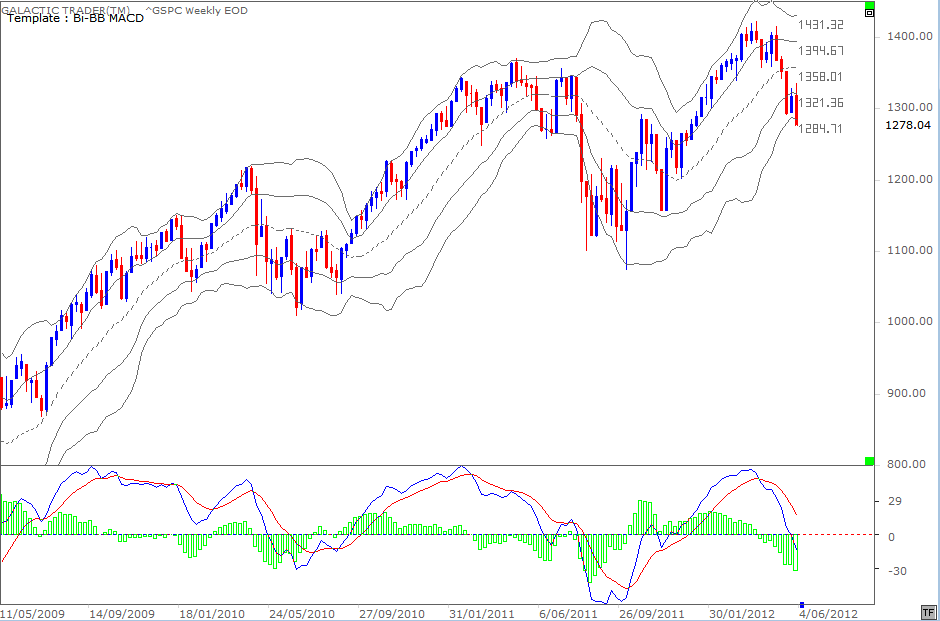
It would mean this week's break of the bottom barrier on the SP500's weekly Bi-BBs is not going to hold and that we are going to see a plunge similar to, or worse than, last August. Given the divergence which appeared in the height of the MACD histograms at the top, and the drop last week, it looks as if the Chicken Little roadshow is ready for rave reviews.
No point in waffling on about this. Do you see any sign of deceleration in the MACD signal lines or histogram plunges? No? Nor do I.
No point in waffling on about this. Do you see any sign of deceleration in the MACD signal lines or histogram plunges? No? Nor do I.
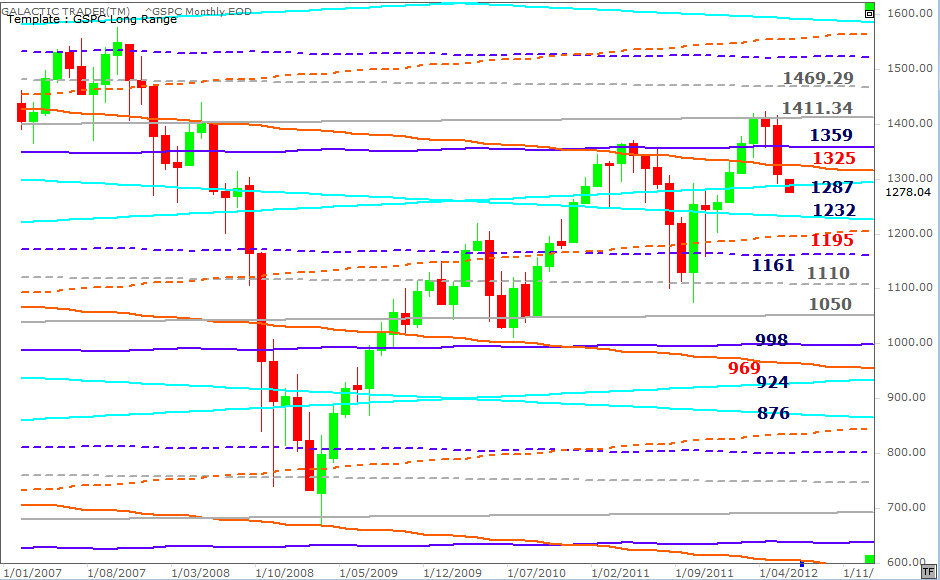
So, let's take a look at Pollyanna's long range planetary price chart. What transpired last week was a potential retest of, and very strong rebuff from, the Node barrier at 1325, when Polly started its shortened week with a manipulated run to the high 1324s.
It closed the week below the important Saturn barrier at 1287. The close was also below the level of last October's High, which rules out the Bull's view that this correction is merely a Wave 4 of an impulsive rally run to much higher Highs.
At some stage, I'm sure we can count on Ben Bernanke and Co to start stealing from the taxpayers again to prop up the markets.
So, there are some numbers to work with, eh? IF this is a nearly-completed wave structure, there should be a turn higher in the coming week and it should close back above 1287.
IF it's the start of a crash, there'll be only a temporary pause at 1232.
Now, lest you think we can ignore the implications of the accelerating bad news bears on Miss Polly's MACD signals, let's take a look at how Auntie, the ASX200, is holding up.
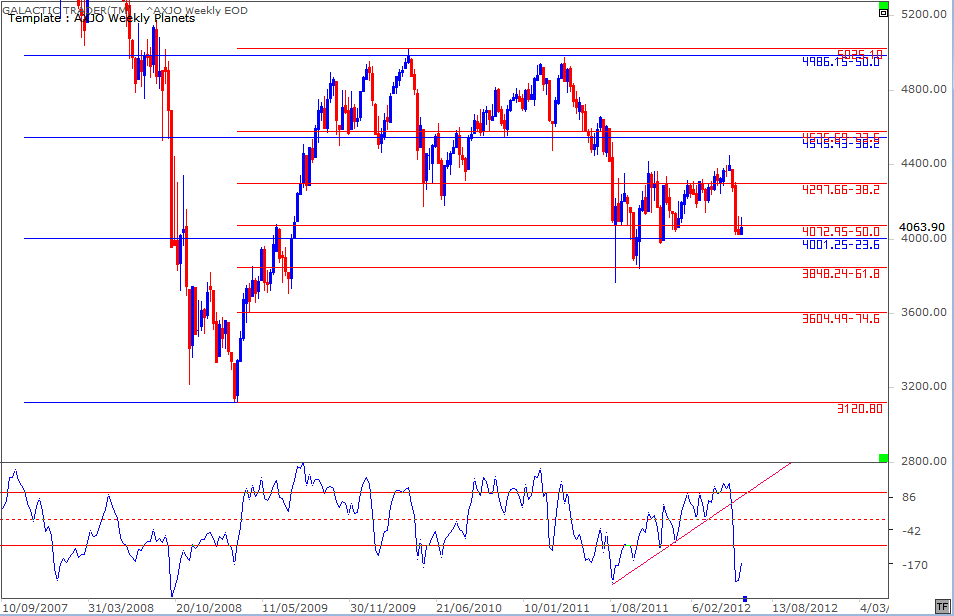
Earlier in the year, I described this chart as a sort of Fibonacci cheat sheet and we were watching the long-range Canary's slow climb up a trendline.
Well, folks ... the Canary's dead. Croaked. Stuffed. Fell off its perch, spluttered in the dust ... and died.
The heading on last weekend's edition was Price may be near, Time probably not. Auntie's chart is an indication of why I was thinking that way. As y'can see, Price held up reasonably well ... but it certainly wasn't Time for an end to the correction, or even a significant bounceback.
And the depth of the Canary's death dive is what warns us worse may now be directly ahead. And so does the next chart.
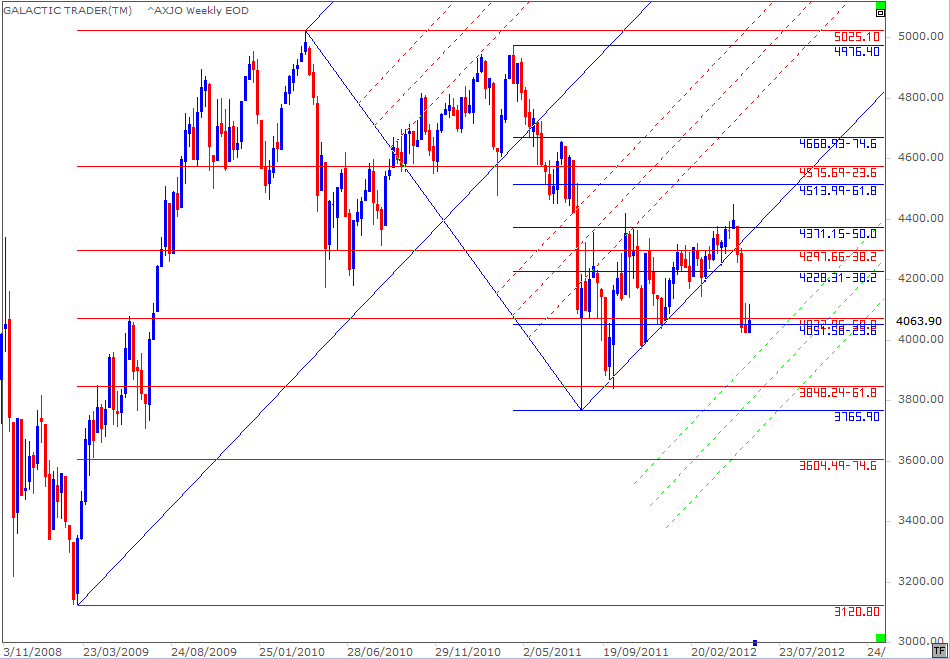
Of interest here is the relationship between Price and the Pitchfork, drawn from the 2010 High to the August 2011 spike down and anchored at the 2009 Bear bottom.
Once the spike was in ... and we discussed the technical mechanism known as Trading Against a Spike (TAS) at the time it happened ... Auntie attached herself to the bottom tyne of the fork and didn't look back.
Ahem* Until recently.
Okay, that's it. Y'all know my view from the Forecast. I expected markets to top out in mid-March and begin a Bear ... and I reviewed the preview a couple of weeks ago.
I think there are only 2 ways markets can go in the next week ... my next predicted turning point doesn't come until late in June.