

Copyright: Randall Ashbourne - 2011


World markets in Time phase
Week beginning June 27, 2011
Firstly, a plug - The Idiot & The Moon is now online. You can buy, download and begin reading in a few minutes. My warm thanks to the first buyers - and to the Canadian reader who wrote to tell me: "This book has already become one of my treasures."
Trading conditions in world markets remain dangerous. The final chapter in The Technical Section of the book is one of the most important because it deals specifically with the issue of Price and Time phases. We are now within a Time phase, and as the book explains, trying to trade these phases is what causes the most serious mistakes and leads rapidly to burnout.
Profits are certainly possible, but expectations have to be shifted dramatically and one needs to be very quick and very nimble because the danger levels are high.
There is much media talk that the problem is Greece. Tsk*tsk. I ask you ... do you own a Greek car, oven, washing machine, air conditioner, computer, software, lounge, carpet - or anything? No? The fact is even the olives in a martini aren't Kalamata, so even the Manhattan bar trade isn't unduly affected, or surprised, by the idea that the Greek economy hasn't had much of an impact on anything for around 2000 years.
No, the real elephant in the room is the one kicking ass; that is, it's the ongoing brawl between Republicans and Democrats in the US and what measures will be taken to prevent not a Greek debt default, but an American one.
Even then, it's not an issue which really needs to befuddle our brains in terms of what the stock markets are doing.


The simple fact is that world markets have reached Price levels which require a period of consolidation and reflection. That's the best case scenario; the worst case is - the USA does a Greece and the world goes into a recession.
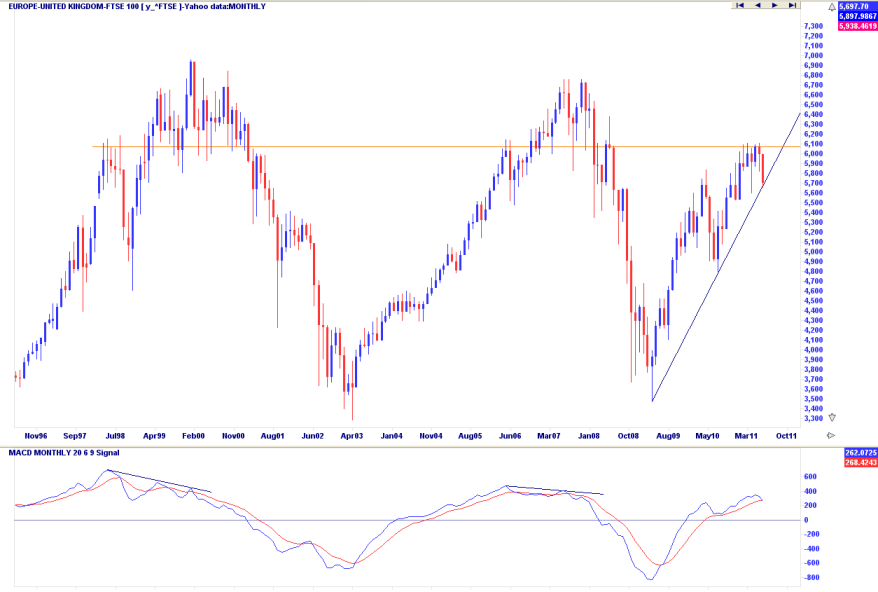
Above is the long-term monthly chart of the FTSE, showing the 1999-2000 peak, the 2007 peak - and recording the fact that the recovery rally from the March, 2009, Low is now facing strong Resistance.
If we consider that the blue trendline rising from the 2009 Low is a linear reflection of Time, in that the angle indicates "speed", it is very easy to see current conditions have nothing to do with "news".
Time and Price have simply hit a barrier. Any price level above that orange barrier is what Alan Greenspan infamously termed "irrational exuberance". Mr Greenspan made that remark while economies were growing much more strongly than they are now.
It is clear from the multi-decade view that the angle of trend is too steep to be sustainable for very much longer. As I point out in the book - this isn't exactly rocket science.
The only hope for further rally from this point is that there is no negative divergence signal yet from the fast MACD - which did give quite clear warnings at the 2000 and 2007 topping patterns.
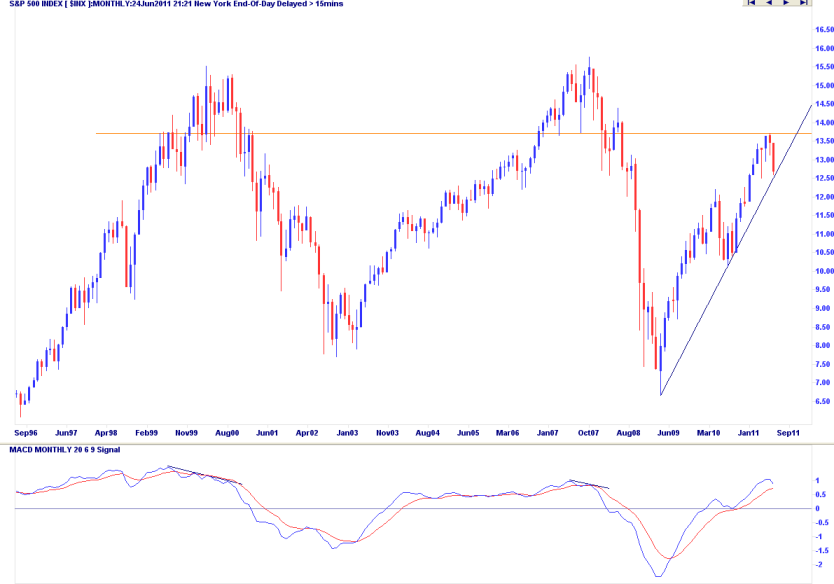
And this chart, above, is the primary Wall Street index, the SP500, which is basically in exactly the same position as the FTSE - it is AT very strong Resistance in terms of both Price and Time - retesting the primary uptrend angle from the 2009 Bear market Low - but, not yet, showing negative divergence in the oscillator.
This is also a point I make very strongly in the book: Turn off the news, tune out the opinions and pay attention to your charts. The first two will confuse you and run the very real risk of prompting you to stay Long for too long when you should be preparing to exit and park your cash on the sidelines.
This is also a point I make very strongly in the book: Turn off the news, tune out the opinions and pay attention to your charts. The first two will confuse you and run the very real risk of prompting you to stay Long for too long when you should be preparing to exit and park your cash on the sidelines.
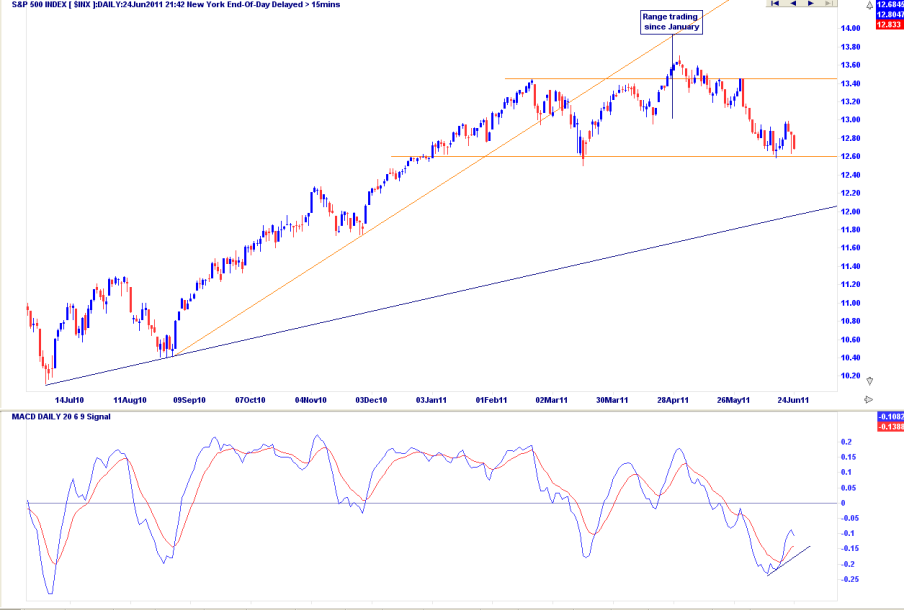
Having checked the long-range monthly charts to get an overview of the forest, we can turn our attention to a closer view of what's happening now. Immediately we can see the SP500 has been rangebound since early this year - prices are trapped within a horizontal layer.
This is a classic and certain indication of a Time phase, as I describe in the book. We can see there is potential for a short-term bounce within this range - with some confirmation from positive divergence developing in the oscillator. But we have to look at this potential within the context of the long-term overview - and adjust our expectations accordingly.
This is a classic and certain indication of a Time phase, as I describe in the book. We can see there is potential for a short-term bounce within this range - with some confirmation from positive divergence developing in the oscillator. But we have to look at this potential within the context of the long-term overview - and adjust our expectations accordingly.
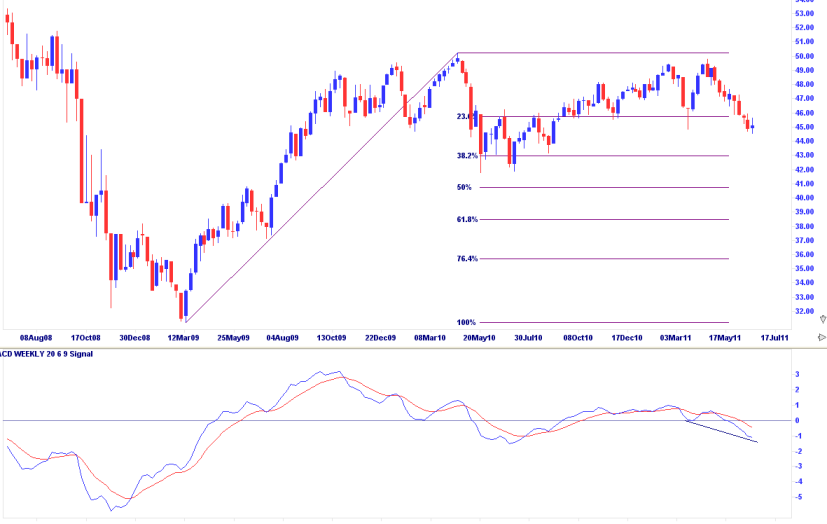
Turning our attention to the ASX 200, we see further warning signs. While this latest decline has had a shallow angle, compared with the much steeper declines in other parts of the post-2009 recovery rally, the MACD is starting to cut deeply below the Zero line.
I've indicated in the past couple of weeks that "struggling" trends, regardless of which direction, are resolved one of two ways - a panic capitulation in the same direction, or a sharp reversal in the opposite direction.
There is a possibility of a sharp rally starting, but the big picture overview raises some serious questions about how far it can go and for how long it can be sustained.
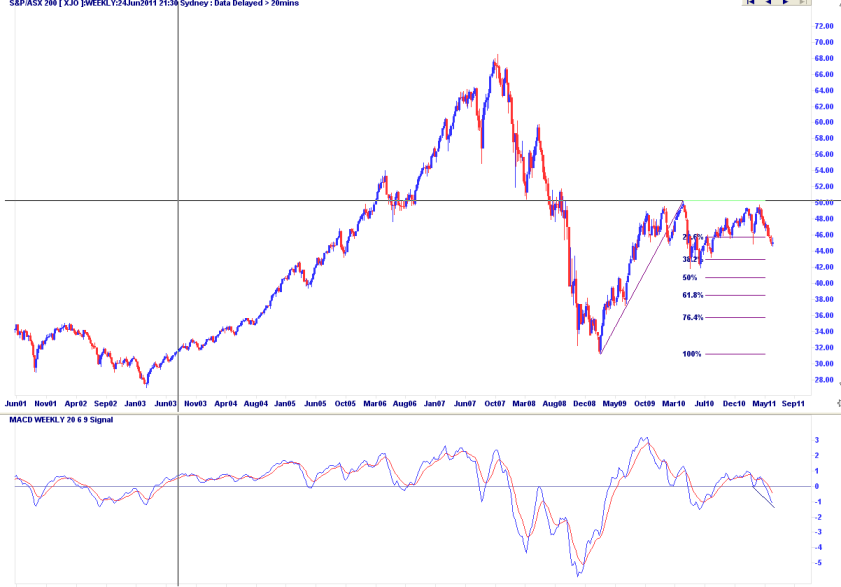
And that is something which becomes much clearer when we view that same chart of the ASX 200 - but over a much longer timeframe.
We can now put the angle of this latest MACD drop into some sort of proper context.
The warning signs are clear - not across one index, but across three.
Safe trading - RA
We can now put the angle of this latest MACD drop into some sort of proper context.
The warning signs are clear - not across one index, but across three.
Safe trading - RA