Panic stations ... the bounce is done
Week beginning June 25, 2012
The bounceback may have completed - hitting precise Time and Price targets expected for a 2nd degree countertrend.

Copyright: Randall Ashbourne - 2011-2012
However, with a range of high-energy astrological aspects now starting to become exact in the coming week (see last weekend's edition, Entering countdown for The Big Bang), there's an even stronger chance markets will continue dropping.
The trigger for a continued drop would be the Sun's highlighting of the Uranus-Pluto square, which is now exact.
We'll review the technical charts in a moment and look at the potential downside targets, depending on whether we're now in wide-range shuffle mode - or we see more of the panic which put itself on display last Thursday.
The mood of the markets is shifting again - and this one's likely to be one of the year's most dramatic shifts.
The timespan of trends and countertrends is detailed in The Technical Section of the book (Price & Time, Page 69) and may be worthwhile your re-reading since most indices appear to have made the perfect pattern for a 2nd degree bounce.
There is a pattern possibility which allows a sideways shuffle to develop to eat more Time, but it's likely to be a shuffle with a wide price range - about 100 points on the SP500.
There is a pattern possibility which allows a sideways shuffle to develop to eat more Time, but it's likely to be a shuffle with a wide price range - about 100 points on the SP500.


Safe trading - RA
(Disclaimer: This article is not advice or a recommendation to trade stocks; it is merely educational material.)
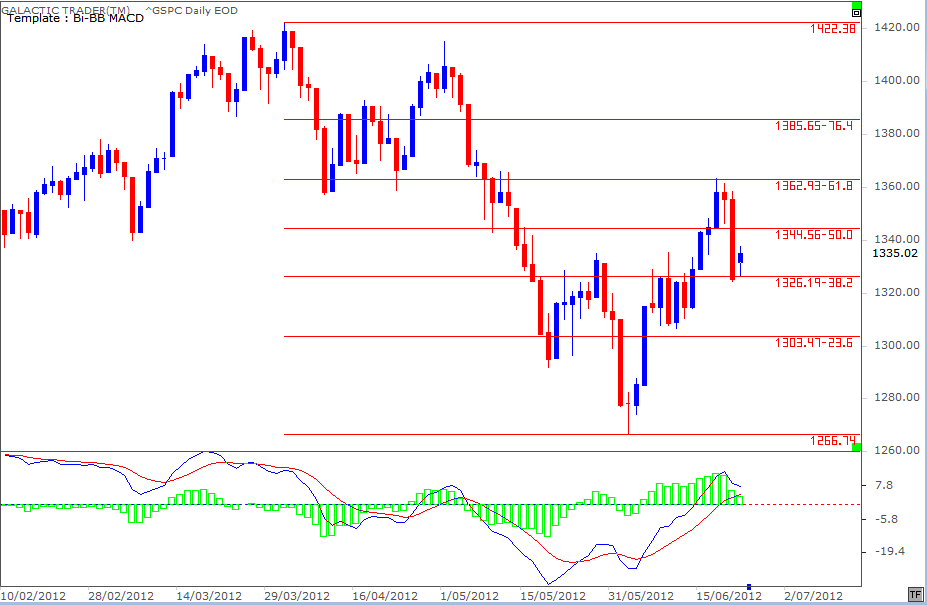
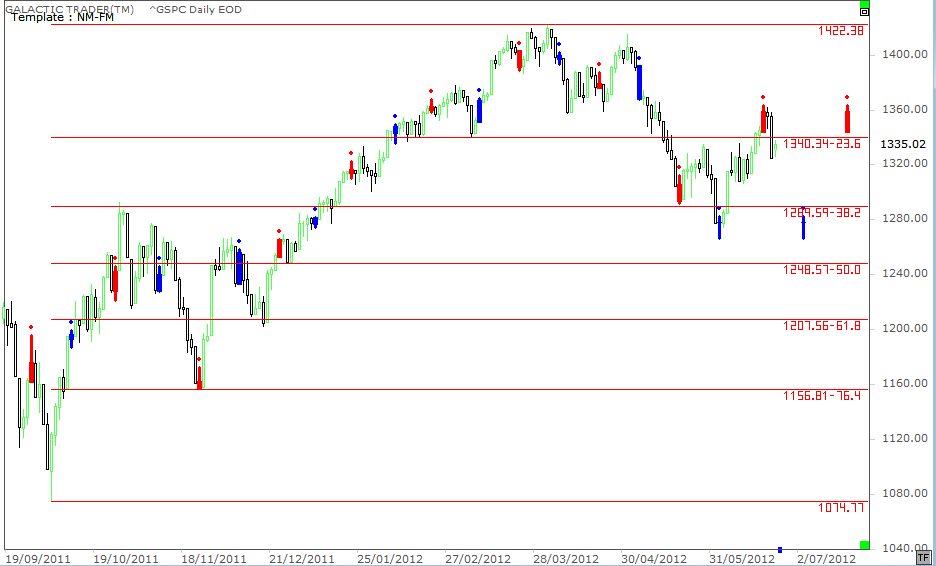
We will begin this week by reviewing Pollyanna, the SP500. Over the past couple of weekends, I've used a daily chart showing the Fibonacci retracement levels - putting the view that if Pollyanna could overcome the strong planetary barrier at 1325, technical resistance would come into play at the 1340s and 1360s.
From low day to high day, the index rallied for 12 days - exactly the outside limit of a 2nd degree countertrend bounce. And it played the Fibolin strings also fairly precisely. As I indicated earlier, the bounceback may now be done and finished since it has hit the Time and Price targets with precision.
In the optimistic scenario, the 12-day rally might have been only the first wave, meaning the downleg which appears to be underway now would be unlikely to significantly break down below the previous low at 1266 before making another bounce. That pattern would allow the Masters of the Universe to unload more over-priced stock.
One needs to be wary of it, especially given Goldmans' alert last week to Short the market.
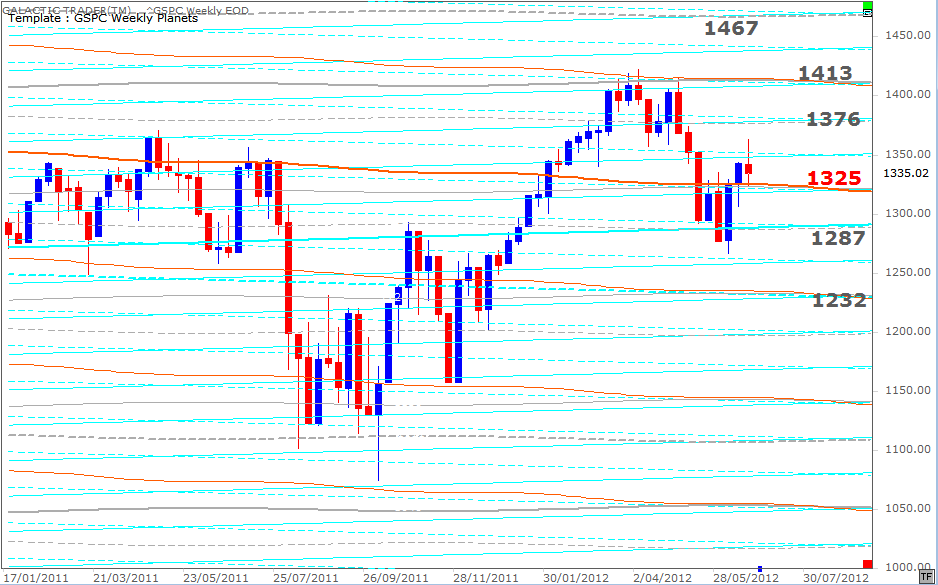
However, to be sure either of the scenarios is in play, we need to see a decisive daily close below the 1325 Node planetary price shown above on Polly's Weekly Planets chart.
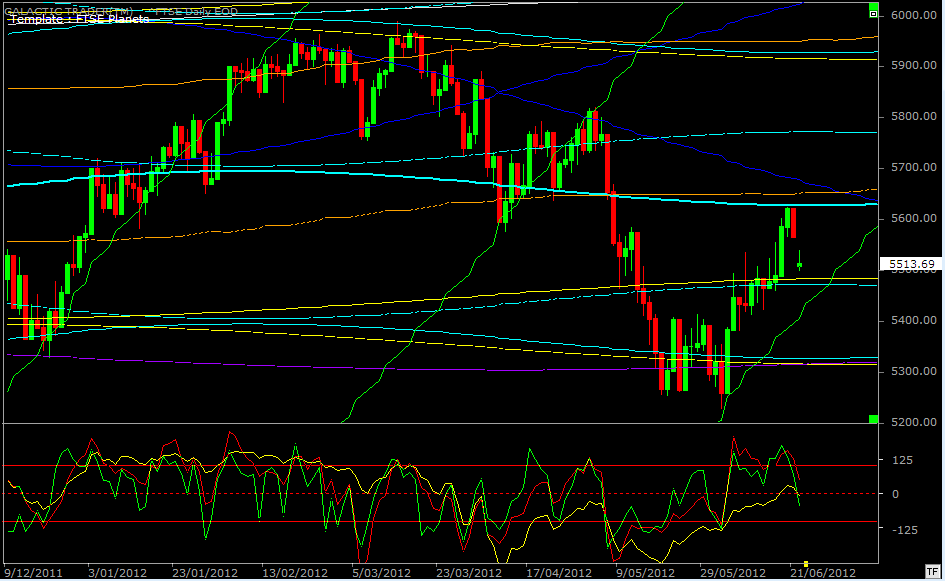
The FTSE, too, has hit both Price & Time targets.
The FTSE, too, has hit both Price & Time targets.
I first used this chart in early June, indicating the FTSE had a solid track record of bouncing when it made contact with a rising Sun line (the green diagonals). We also discussed the index's tendency to shuffle sideways immediately following the sort of spike we saw in the red Canary in the oscillator panel.
It all played out pretty much as anticipated ... with the temporary shuffle stalling the rally around the level of some planetary barriers, before jumping sharply again to stall out at the next planetary level. Last week's price high produced a lower peak in the red Canary, which is a warning of at least intermediate weakness.
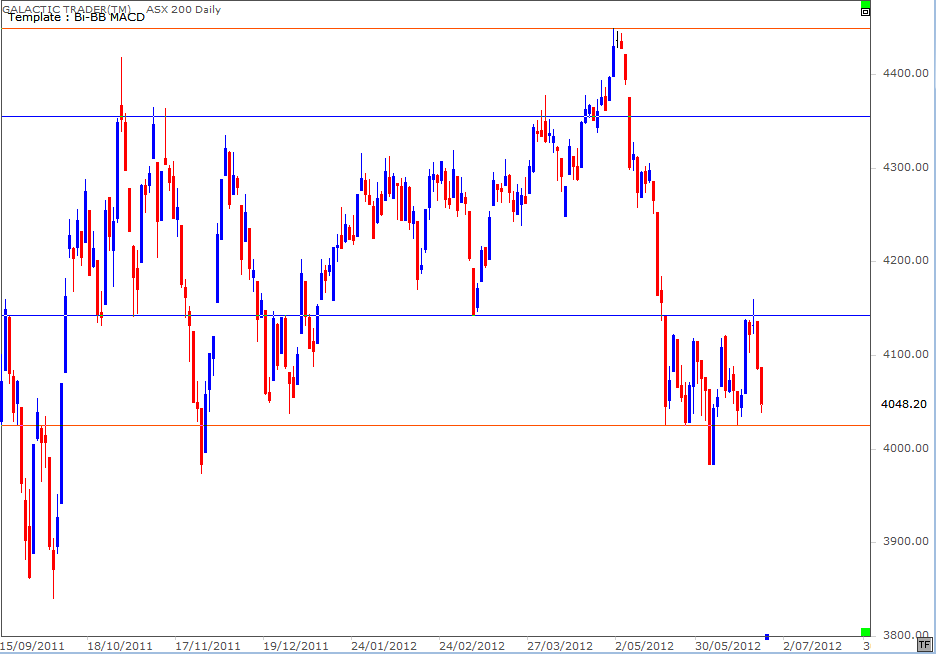
And last weekend, I introduced the following chart for the ASX200, as a real-time example of how to apply some of the lessons from The Technical Section.
It all played out pretty much as anticipated ... with the temporary shuffle stalling the rally around the level of some planetary barriers, before jumping sharply again to stall out at the next planetary level. Last week's price high produced a lower peak in the red Canary, which is a warning of at least intermediate weakness.
And last weekend, I introduced the following chart for the ASX200, as a real-time example of how to apply some of the lessons from The Technical Section.
Last week's behaviour of the ASX200, in reaching for and being turned down from one of the Support/Resistance lines we'd drawn is a good example of just how simple you can make your charts and still gain a lot of valuable knowledge about what's likely to happen.
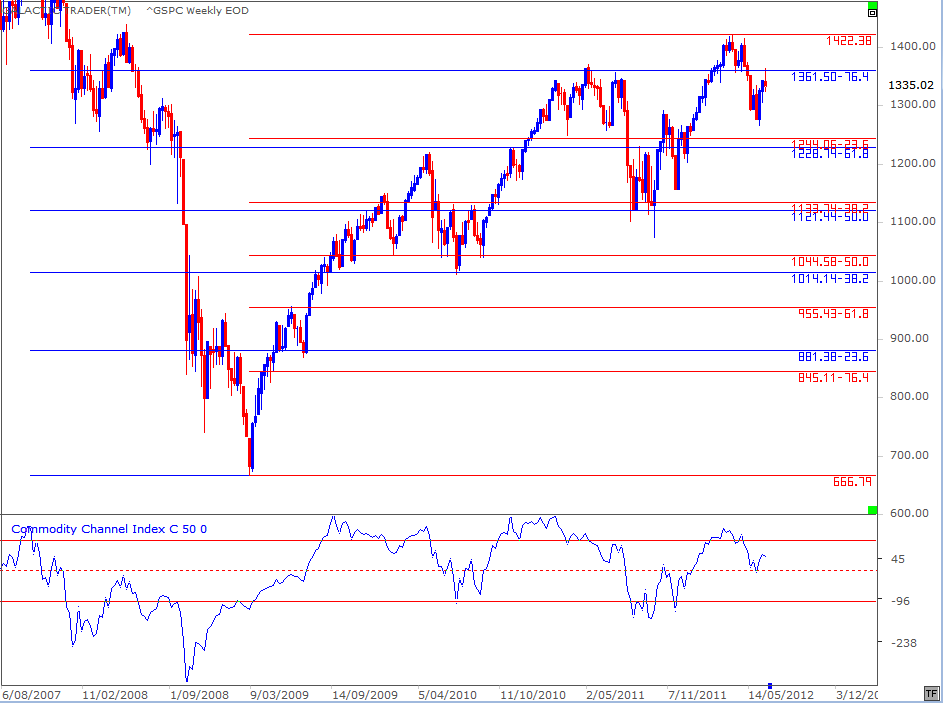
However, if the pessimistic outlook is the one now in play, the June 4th low will be broken decisively and there is little to stop the freefall until the lower half of the 1200s - 100 points down from last week's close. And, even that would be only a temporary stop.
Given the level of negative divergence which has built up in the oscillator throughout the recovery rally from March 2009 (lower oscillator peaks for each new price peak), the odds favour a decline likely to take out the price lows of last August/October.
Given the level of negative divergence which has built up in the oscillator throughout the recovery rally from March 2009 (lower oscillator peaks for each new price peak), the odds favour a decline likely to take out the price lows of last August/October.
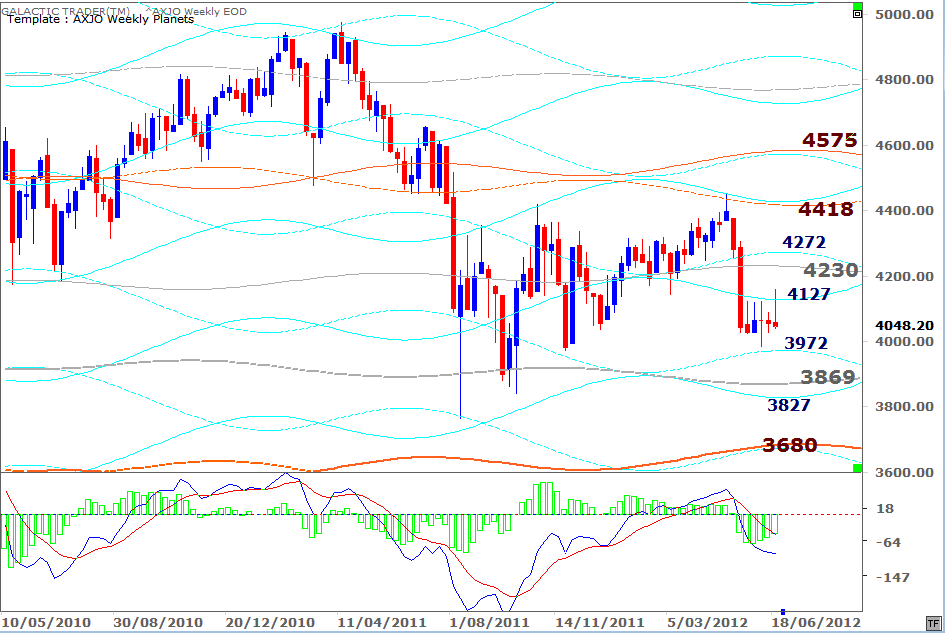
Auntie's Weekly Planets chart is shown above. The index has been in a holding pattern for five weeks now - with only one exact touch of the upside Saturn price barrier and from which it was knocked back down rather severely.
This is an index which could now lose 5% or 10% of its value in only a few days of panic. The first major price support doesn't appear until the 3800s, along the primary (grey) Neptune line which helped stall the August/October plunges. Below that, there's no major support until the primary Uranus line in the 3600s.
And our final chart for this weekend brings us up-to-date on where we are within the monthly lunar cycle.
We had the unusual condition during the past few weeks of having two New Moons occur within the same sign - Gemini, which I've remarked from time to time has the ability to produce big swings in both directions.
The first produced a decline from Full Moon to New Moon, which is the reverse of the "normal" tendency for markets to rise during that lunar phase. The second instance produced a textbook rise from Full Moon (blue bar) into New Moon (red bar).
Statistically, price will now be lower going into the next Full Moon than it was at the New Moon last week.