
Entering countdown for The Big Bang
Week beginning June 18, 2012
You've got to love Geminis - they always have two answers for everything.

Copyright: Randall Ashbourne - 2011-2012
The Sun will soon shift signs to Cancer, firing up the Uranus-Pluto square which is about to become exact; Venus and Saturn are about to turn from retrograde to direct; Jupiter is heading to a square with Neptune; and we're about to get a second New Moon ... in Gemini.
In terms of The Spooky Stuff, it means an extreme high-energy fireball is about to be lit. There's always the possibility it'll send markets on a wild rocket ride.
But, the probability is it's all just going to blow up.
I'll spend a few minutes this weekend, explaining some of the astrological symbolism involved, before we head to the charts for the techie heads up.
Perhaps it's the Scorpio in me which holds the view both answers are usually ... wrong.
We saw it at work last week, especially Friday, when American traders apparently decided Greek voters would accept austerity this weekend ... or, if they didn't, the Fed and other central banks will ride to the rescue anyway.
Well, wake up and smell the reality.
We saw it at work last week, especially Friday, when American traders apparently decided Greek voters would accept austerity this weekend ... or, if they didn't, the Fed and other central banks will ride to the rescue anyway.
Well, wake up and smell the reality.


Safe trading - RA
(Disclaimer: This article is not advice or a recommendation to trade stocks; it is merely educational material.)
Firstly, astrological symbolism has to be weighted. Having Uranus square Pluto is a much bigger deal than having the Moon make the same aspect.
I mentioned last weekend the symbolism of the Uranus-Pluto square as being an Aries/Capricorn confrontation of aggressive rebellions against "the powers that be" ... and I discussed in Forecast 2012 how this had started with the so-called Arab Spring uprisings, which would continue to spread as they have in Syria and Bahrain, but how the same sort of energy would also manifest in other parts of the world.
And it's fairly obvious almost everywhere. There are all sorts of power struggles going on in China. Dissidents are getting bolder. Greece is an obvious Western example, but so is the growing angst in Germany. In terribly polite Britain, Prime Ministers former and current, have been called into the public forum to explain their relationship with the Murdoch empire and whether policy was traded for publicity.
Uranus represents an energy which demands change, reform and radical restructuring of everything it considers "wrong". In Aries, the demands are aggressive and, if thwarted, will turn to direct action ... from taking over the streets to taking up arms.
Pluto represents great power and great wealth concentrated very narrowly. In Capricorn, it is very much all about control by the plutocrats. There are nuances between nations in exactly how it manifests. In some of the Arab nations, it's pretty easy to pick the dictators.
Power and control issues tend to be more insidiously Scorpionic (Pluto's home sign) in other nations ... like buying Congress and the Senate, or like arranging to have the Italian Prime Minister be ... Gee, golly, a former Goldman Sachs executive! Nor is he the only one of that banking clan put directly into control of European political levers.
There have been some numbers out recently highlighting the concentration of American wealth. Nine heirs of the Wal-Mart fortune, for example, have more wealth than the bottom 30% of Americans.
It doesn't matter whether you or I approve or disapprove; it's all about the symbolism of an Arien Uranus demanding a total overhaul.
And, to be frank, in terms of the Old Gods, Uranus was a nutbag! GeeZeus, he locked his own kids up in the bowels of the earth simply because he didn't like the look of them.
Now, the thing is ... this energy is just getting warmed up. We ain't seen nuttin' yet! The first exact square is now only a week away ... and it's going to be highlighted, almost literally, by the Sun making a T-square soon after it enters Cancer. A T-square, on its own, is a high-energy aspect.
While in Gemini, the emphasis is on "talk" ... let's "discuss" the problem. In Cancer, a Cardinal sign associated with action (as are Aries and Capricorn), the "time" for talk is over. And it is the nature of Cancer to act to protect itself. The sign is associated with the crab - which either scuttles away from danger, or turns aggressively and brings out the big claw.
Perhaps the second most significant symbolism of the upcoming astrological events is Saturn turning direct again - because it means he's heading for a sign change. For the past couple of years, Saturn has been travelling Libra, the sign in which he is held to be "exalted" and acts almost like a benefic, rather than a malefic influence.
Once he turns, he'll be on a charge into Scorpio. The velvet gloves come off and the iron fist emerges, wrapped in venom-tipped brass knuckles.
In all, the astrological weather (and probably the actual weather!) is about to turn really, really nasty. Okay, enough with the story-telling. It's time to go techie.
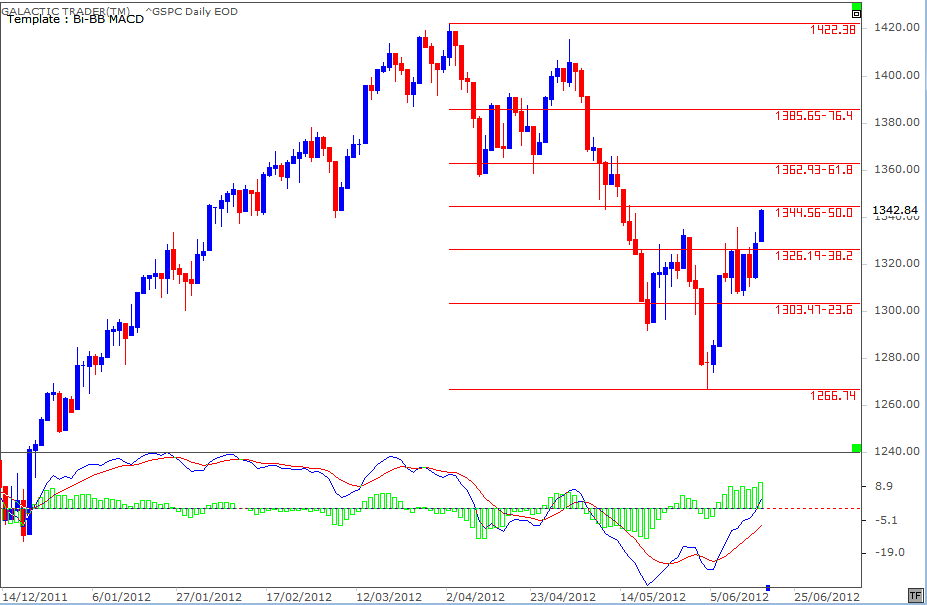
Let's begin with a review of Miss Pollyanna's daily chart. In last weekend's edition, I introduced this chart, indicating that if the SP500 could break above the Node planetary barrier at 1325, we would expect strong resistance to the bounceback to start showing up in the 1344-1360s region.
The odds tend to favour this rally being nothing more than a bounceback within a now-developing Bear market. Most of the other major world indices have not jumped as strongly as Wall Street.
If this is a 3-wave corrective pattern unfolding, it's likely to start to die in the next few days and if the Fibonacci Rx levels don't cap the rise, there's a longer-term level which might.
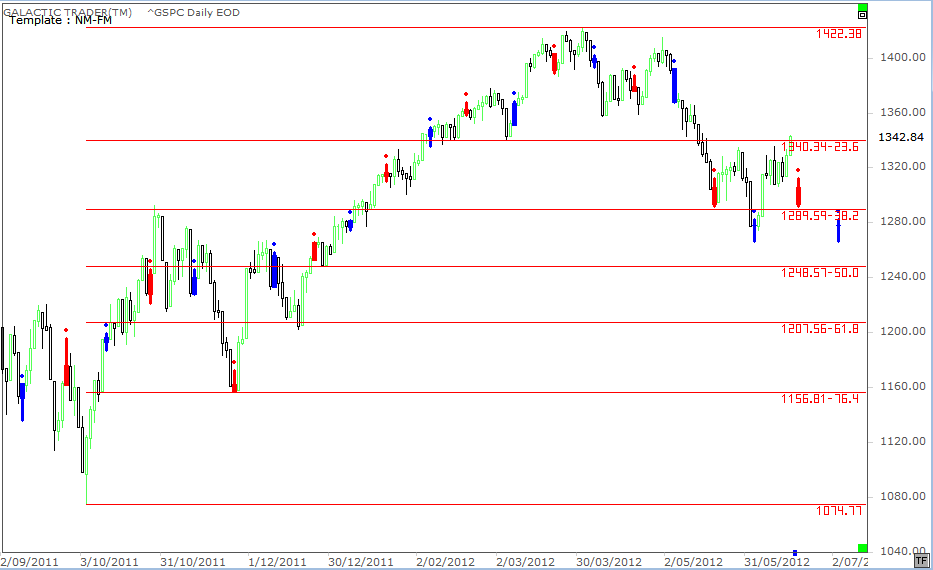
The third chart is the New Moon - Full Moon template applied to the index. Late morning, on Tuesday, in New York we get a second New Moon in Gemini. The first one was a temporary low. In fact, price dropped severely from Full Moon to New Moon (blue bar to red bar), in a complete reversal of the normal statistical tendency.
The lunar phase appears to have reverted to "normal" mode ... a low at Full Moon (blue), rising towards New Moon (red). Gemini. Both ways!
The lunar phase appears to have reverted to "normal" mode ... a low at Full Moon (blue), rising towards New Moon (red). Gemini. Both ways!
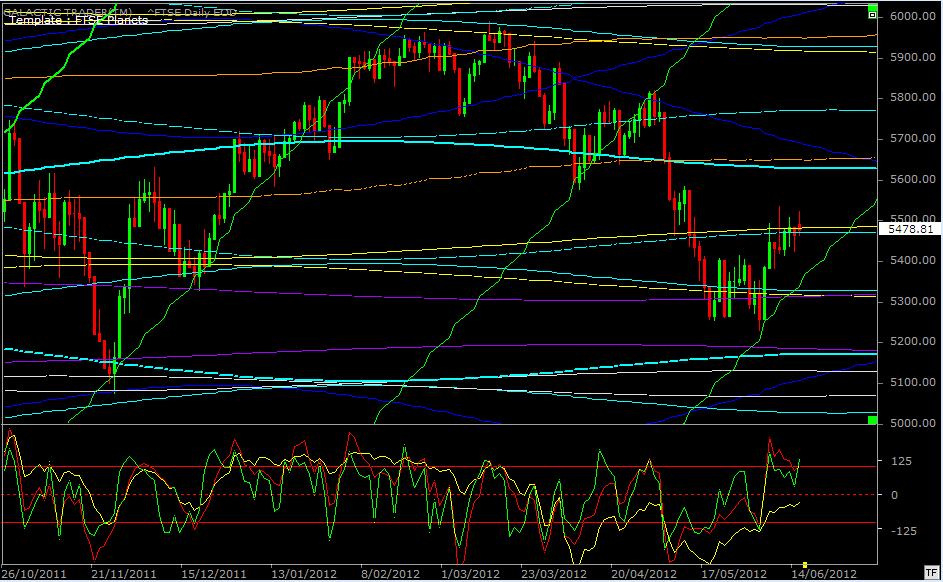
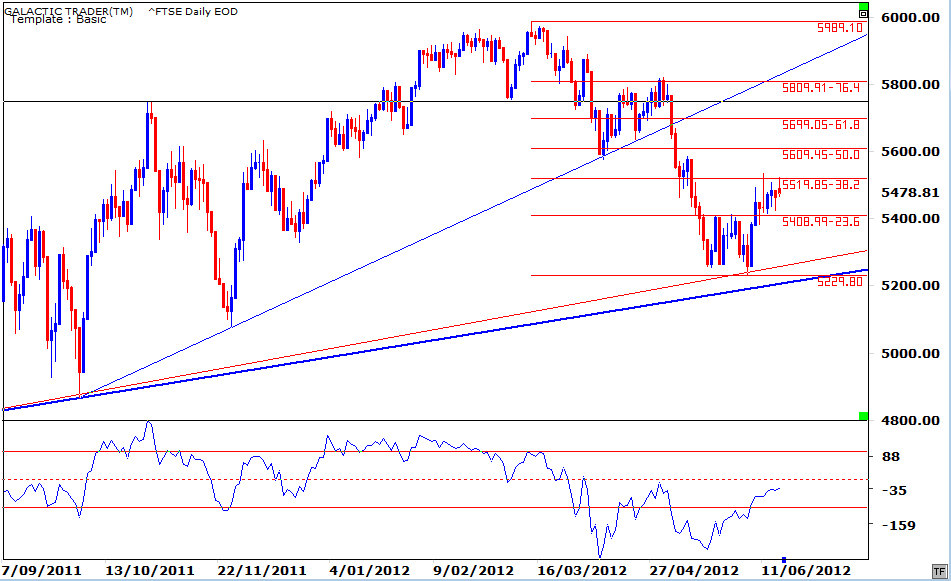
We've discussed this daily planetary chart for London's FTSE over the past couple of weeks. Last weekend, I said: "Pay special attention to the state of the red Canary in the oscillator panel. We've had a few of these strong spikes since last November's Low ... and in each case, they've caused Price to stop the rally temporarily and go into a sideways shuffle."
There was an attempt to goose the index above resistance at last Monday's Open, but the attempt failed and the index went into the expected shuffle. You might want to check last weekend's edition for the FTSE's Weekly Planets chart to see the target levels for either breakout or breakdown.
I'm a little more interested, though, in the FTSE's relative weakness in comparison with the Wall Street bounce.
While Pollyanna has already gone close to hitting the 50% Rx level, London has stalled at a lower level. Technically, the bounceback doesn't "look" to be complete.
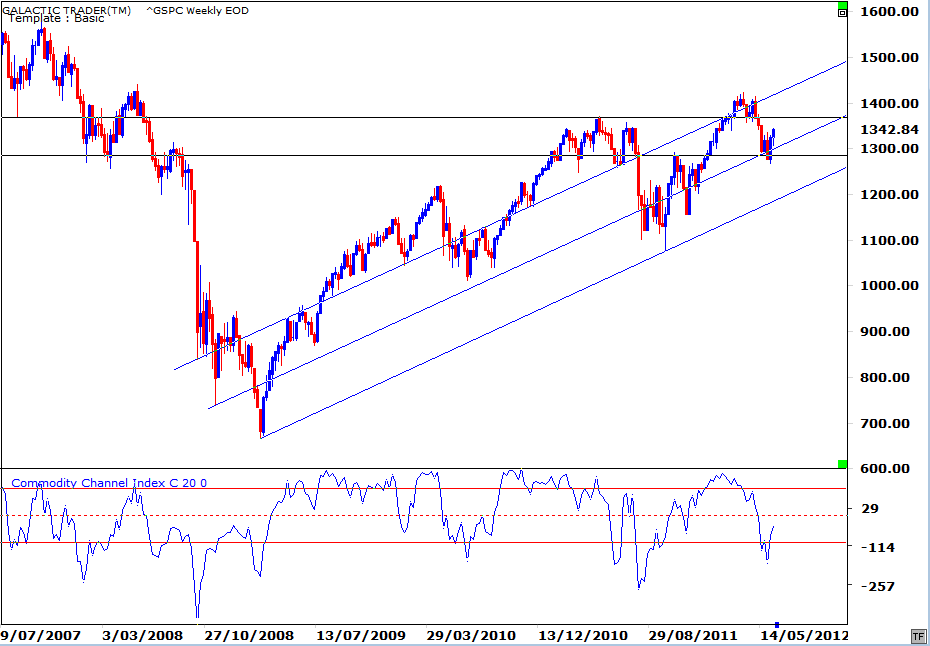
The chart above is the 500's weekly, showing the entire rally since the 2009 Bear bottom. The black horizontals are "obvious" levels of considerable importance. Polly broke the bottom level a couple of times during last year's topping process before the August/October dive.
The Bulls have defended this line again. Now, IF the recent low was a legitimate "false break" of that level, the bounceback should be hard and fast and easily reach the higher level - around 1370. Any weakness with that level ... failure to reach it, or being knocked down strongly ... is probably a sign to abandon ship.
For the moment, though, the index is maintaining an uptrend over the multi-year range - even though the angle is now slower than it was for the initial year or two of the rally from the 2009 bottom.
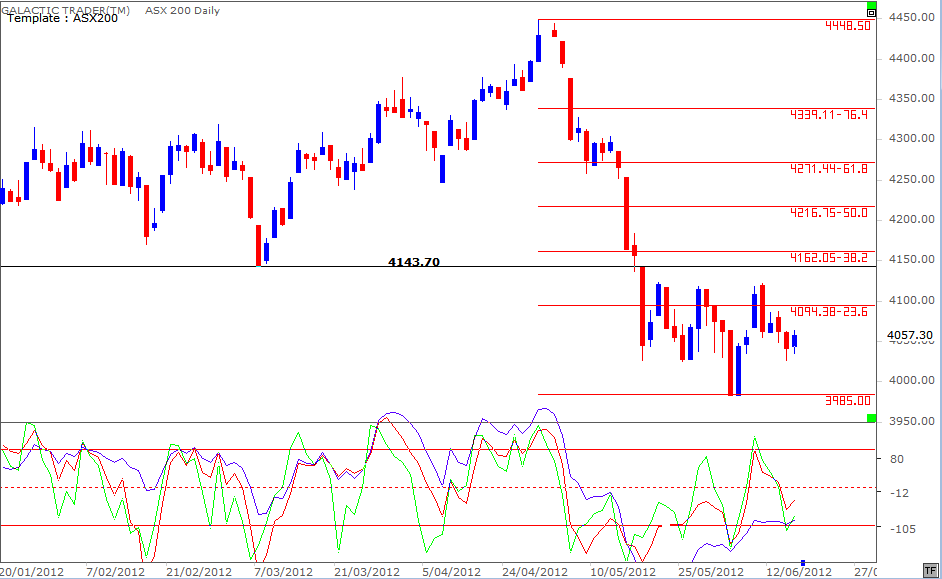
The Australian stock market is even weaker, not even holding a 236 Fibo Rx level, even with some positive divergence building in the state of the oscillators.
Instead of using planetary and Fibonacci levels, I'd like to point out another way of looking at the ASX200.
Instead of using planetary and Fibonacci levels, I'd like to point out another way of looking at the ASX200.
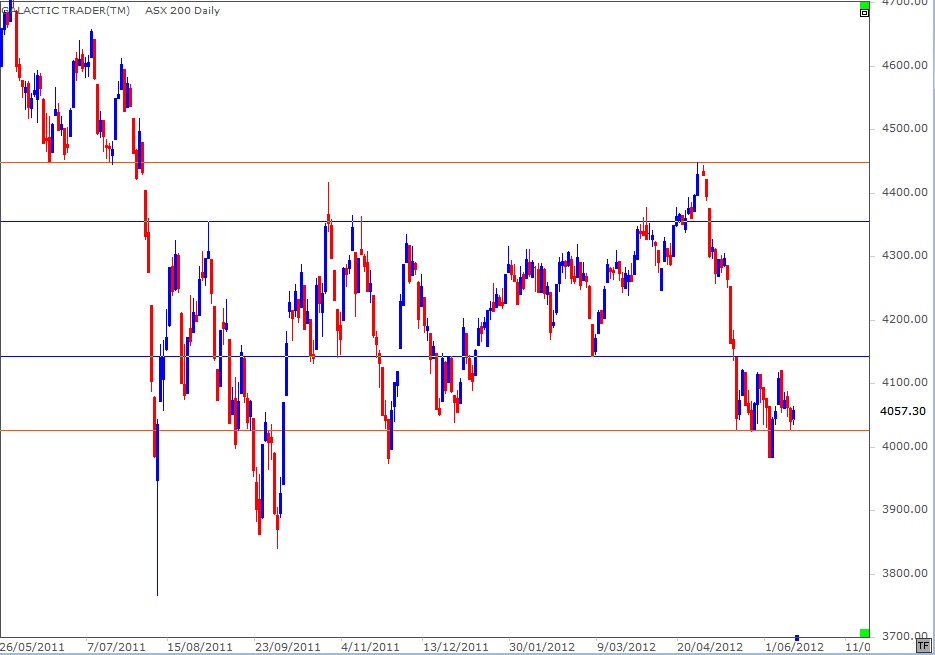
I draw your attention to this chart simply because ... it's simple. I realise that my discussion of The Spooky Stuff so often, conflicts with the basic tenets of The Idiot & The Moon, which is to adopt some simple technical methods to trade profitably, safely and reliably.
I don't think "safe and reliable" and astrology belong in the same sentence when it comes to investing your boodle. It's interesting, it's colourful, it's often even right.
But, it is NOT the safest, most reliable method of making profits trading stock markets. As I point out in The Technical Section, your own ability just to draw a few straight lines is worth far more to you than almost anything else.
The chart above defines the broad range the ASX200 has been trading in since the August/October lows. It's quite clear where the lines of both Support and Resistance are ... and, therefore, the potential Entry and Exit levels are.
So, enjoy the tales of Old Gods and their shifting battles in the skies ... read a newspaper or web blogs if you like ... but put ALL of that out of your head when you're making your trade decisions.
Get yourself a good chart, use a FEW technical tools you've become familiar with ... and shut out the noise.