

Headwinds, Mercury Rx, Bradley date
Week beginning June 1, 2015
There has been little worth talking about since the last edition in April.
Copyright: Randall Ashbourne - 2011-2015
June kicks off with Mercury halfway through a Retrograde phase and it's not unusual for a trend change to develop at that halfway mark.
We also have another of the year's major Bradley Model turn dates approaching, around June 8. The details of the Bradley dates were provided in Forecast 2015, which you can read, or re-read, in the Archives.
In this edition, we'll take a look at exactly how Pollyanna has been coping with the long-range planetary price lines.
And, also, how the greenback gold price is holding up.
I indicated then that the SP500 faced strong headwinds as it ran into primary planet downtrend lines and that even if it overcame those, there was a stack of resistance to overcome in "the next 20 to 30 points"
At that time, the Pollyanna index was at $2102. It ended last week at $2107 ... after putting in some sort of top at $2134.
At that time, the Pollyanna index was at $2102. It ended last week at $2107 ... after putting in some sort of top at $2134.


Safe trading - RA
(Disclaimer: This article is not advice or a recommendation to trade stocks; it is merely educational material.)
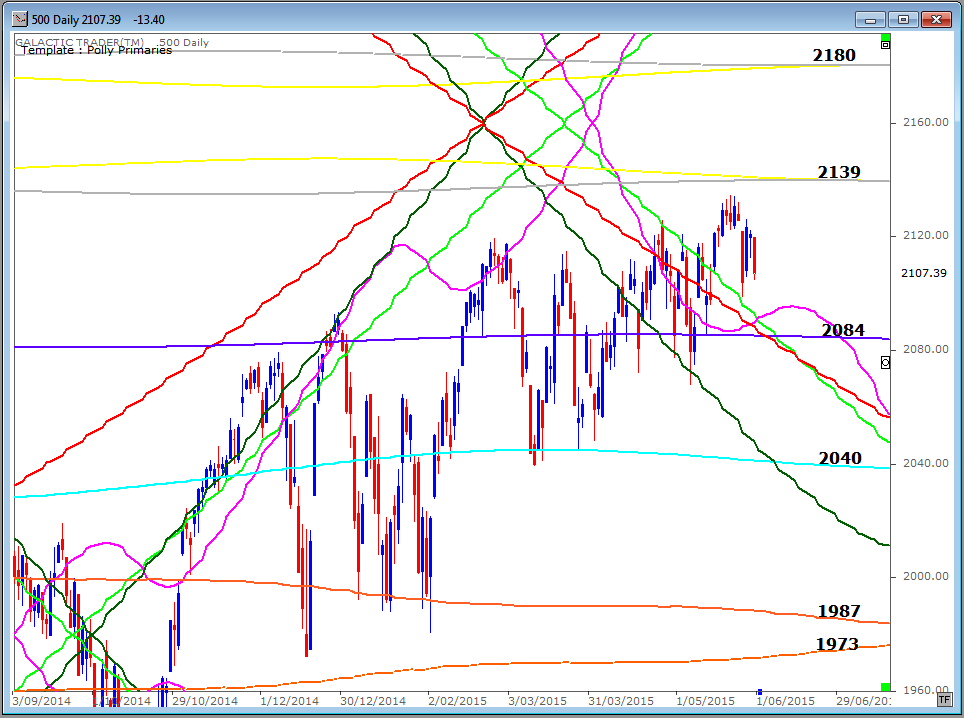
In the April edition, I showed how the 500 had started to bump into primary downtrend lines. The track record of contact with these lines was dealt with in the March 30 edition.
We expected that price would get caught up in that downtrending planetary jumble. And it did ...
We expected that price would get caught up in that downtrending planetary jumble. And it did ...
In the past couple of weeks, the index has tried to break northwards from the downward pressure, but has been unable to reach as high as strong, horizontal resistance provided by Uranus and Neptune price lines around 2140.
The Pluto line at 2084 has provided support in the past during this churning, sideways grind and should be watched closely in the days ahead.
The grind has been going on for months and it's likely that this month will see the issue resolved with either a breakout or a breakdown.
Many commentators are leaning heavily towards a breakdown. The only problem with that is when people are expecting a breakdown, the market usually bursts northwards.
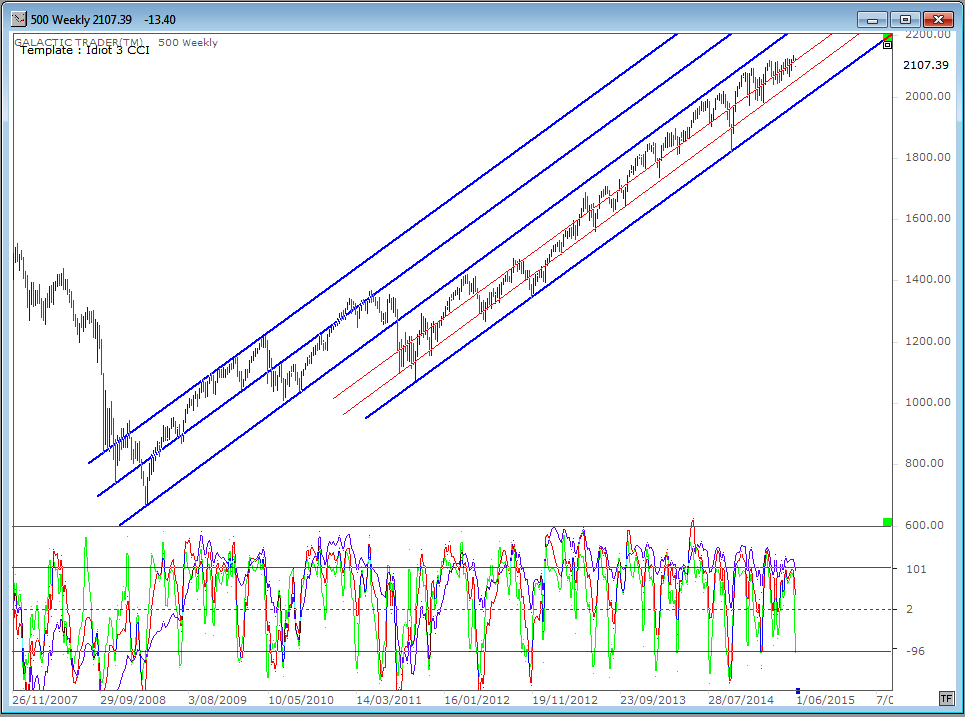
In The Technical Section of The Idiot & The Moon, I showed you how to create a simple, hand-drawn trendline and use that as the basis for creating channels which can be used to forecast future price moves.
The basis is that indices and individual stocks have a strong tendency to repeat a particular angle over-and-over again and that by taking parallels of the original line you can create a reliable roadmap.
Well, let's see how well that idea has worked out since the Bear bottomed in 2009 ...
The Pluto line at 2084 has provided support in the past during this churning, sideways grind and should be watched closely in the days ahead.
The grind has been going on for months and it's likely that this month will see the issue resolved with either a breakout or a breakdown.
Many commentators are leaning heavily towards a breakdown. The only problem with that is when people are expecting a breakdown, the market usually bursts northwards.
In The Technical Section of The Idiot & The Moon, I showed you how to create a simple, hand-drawn trendline and use that as the basis for creating channels which can be used to forecast future price moves.
The basis is that indices and individual stocks have a strong tendency to repeat a particular angle over-and-over again and that by taking parallels of the original line you can create a reliable roadmap.
Well, let's see how well that idea has worked out since the Bear bottomed in 2009 ...
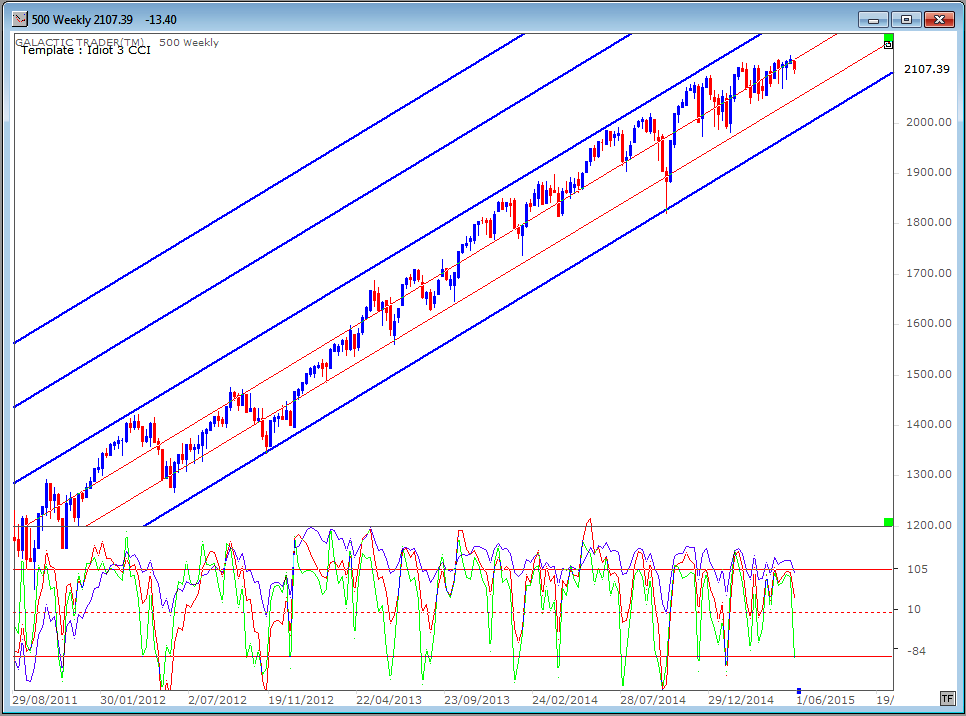
As we can see, it has been quite useful in determining the angle which is repeatedly in play for this long Bull run.
The 500 closed out last week falling off one instance of that rising angle ... and with the green Fast Bird dropping deeply, warning of the potential for more downside to come in the short-term.
Obviously, further price gains in the index are getting more and more difficult. Negative divergence continues to build in many monthly oscillators and the danger of a large correction continues to grow.
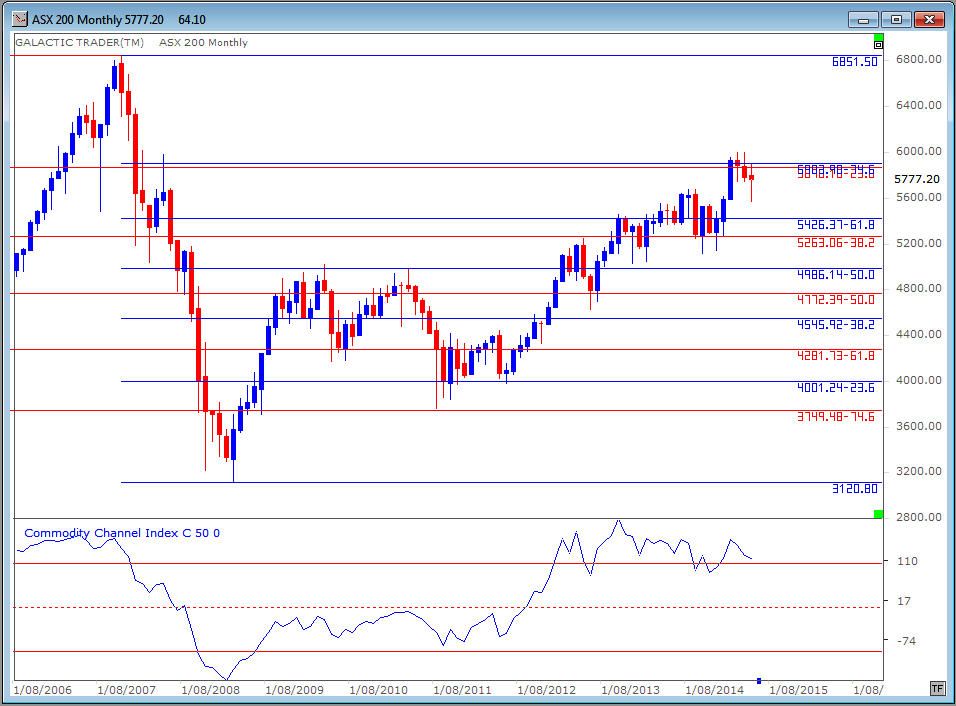
The ASX 200 has been stalled for the past 3 months at a double Fibonacci barrier and its recent price highs have arrived with negative divergence in the Big Bird oscillator. The oscillator has not yet declined below the +100 upper red line in the indicator panel and the May monthly price bar has ended in mid-range, indicating a high level of indecision between both buyers and sellers.
Obviously, further price gains in the index are getting more and more difficult. Negative divergence continues to build in many monthly oscillators and the danger of a large correction continues to grow.
The ASX 200 has been stalled for the past 3 months at a double Fibonacci barrier and its recent price highs have arrived with negative divergence in the Big Bird oscillator. The oscillator has not yet declined below the +100 upper red line in the indicator panel and the May monthly price bar has ended in mid-range, indicating a high level of indecision between both buyers and sellers.
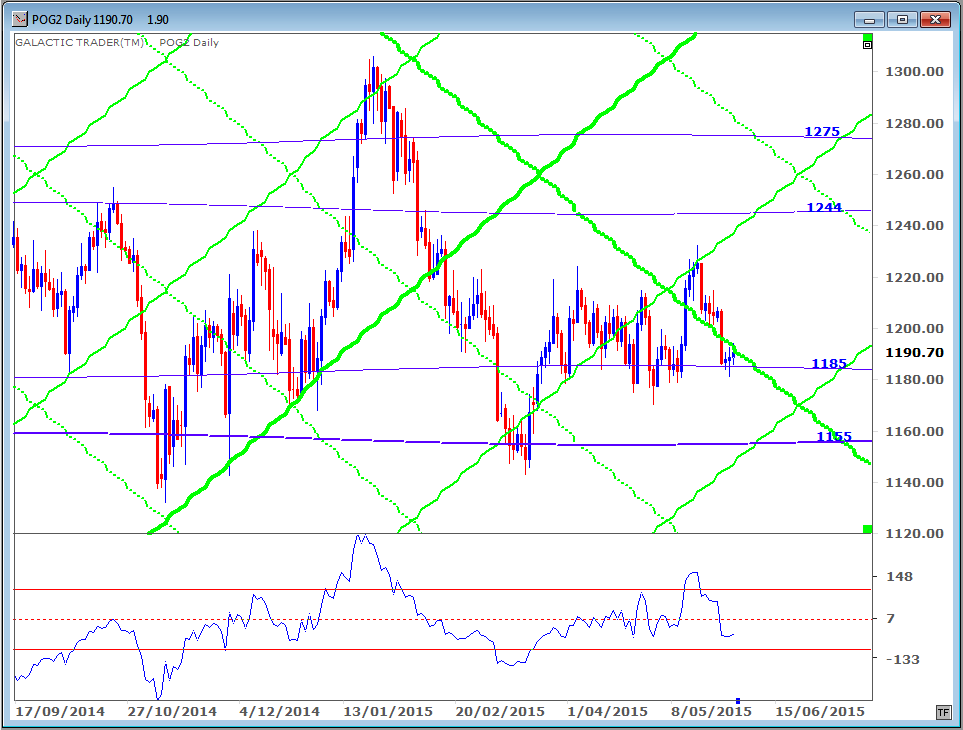
Now let's take a look at the price of gold measured in US dollars, starting with the daily Sun/Pluto chart.
The minor Pluto price line at $1185 continues to provide reasonably strong support, which is even more obvious when viewed on a weekly chart ...
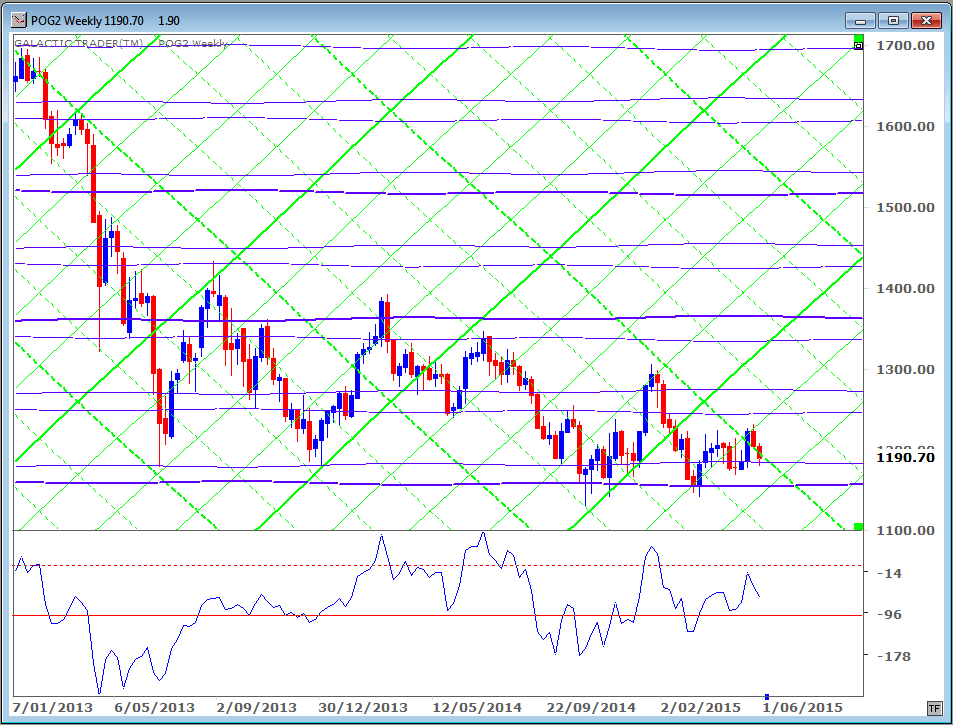
We can see this line first came into play in June 2013. What is interesting is that each subsequent visit to this line, and the stronger, lower one around $1155, has been met with higher troughs in the Big Bird oscillator. That's positive divergence, a sign that internal strength continues to build, despite the constant shenanigans with the price, especially on the futures market.
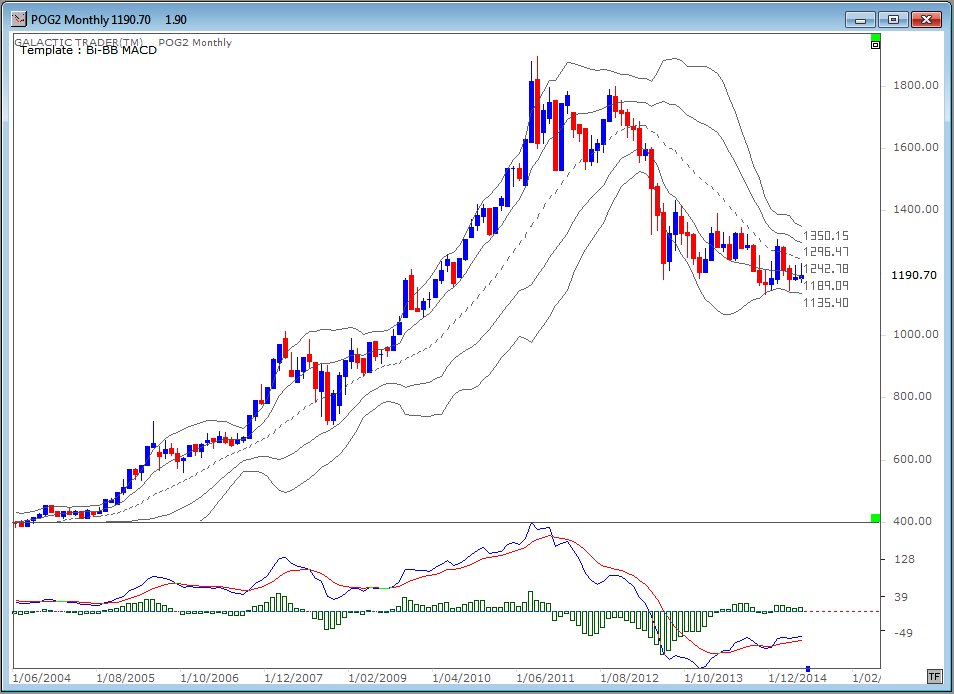
And that positive divergence is even more obvious on a monthly Bi-BB chart, using a fast MACD as the oscillator. Pressure for a major gold price rally has been building. It's certainly worth keeping a close eye on individual gold mining stocks, especially those with a relatively low cost-of-production.
And that positive divergence is even more obvious on a monthly Bi-BB chart, using a fast MACD as the oscillator. Pressure for a major gold price rally has been building. It's certainly worth keeping a close eye on individual gold mining stocks, especially those with a relatively low cost-of-production.
Well, I think that's enough for this edition. As I said in The Idiot & The Moon, the smartest thing you can do in trading is shut-up and shut out the constant barrage of noise. This sideways churning is probably driving a lot of people totally nuts ... and that's not a good state of mind for making rational decisions.
Still, it has been going on now for so long that a big move, one way or the other, is becoming imminent.
Still, it has been going on now for so long that a big move, one way or the other, is becoming imminent.