Jupiter to Gemini ... the big sector shift
Week beginning June 11, 2012
The head honcho of the heavens changes signs in the coming week, shifting the emphasis of money flows into the markets over the coming year.

Copyright: Randall Ashbourne - 2011-2012
It also means the money flow starts to move more rapidly into different sectors. The late Kaye Shinker, from www.astrologicalinvesting.com and the author of several textbooks on financial astrology, researched this effect at some length.
With Jupiter in Taurus, for example, the emphasis has been on banking and debt - the Taurus/Scorpio axis; and also on technology and gold, the Aquarius/Leo axis. I think most of you will agree that banks, brokers, Apple and gold have been the topics de jour for all the time the FatBoy has been in Taurus.
Slowly, you'll see a change; transportation, travel, health, labour and oil will begin to fill the news pages. It does not mean the bank problems are about to disappear. All of that will continue because of the longer-term Uranus square to Pluto ... the Aries/Capricorn confrontation of aggressive rebellions against "the powers that be".
According to ancient symbolism, Jupiter is weakened in Gemini. The Old God we associate with expansion ... he whom I call the FatBoy ... goes on a diet and expansion loses some weight.
It's part of the rationale behind The Jupiter Cycle (see Articles); markets have an historical tendency to peak with Jupiter in Taurus and decline until Jupie enters Leo, a Fire sign which sparks him up again.
It's part of the rationale behind The Jupiter Cycle (see Articles); markets have an historical tendency to peak with Jupiter in Taurus and decline until Jupie enters Leo, a Fire sign which sparks him up again.


Safe trading - RA
(Disclaimer: This article is not advice or a recommendation to trade stocks; it is merely educational material.)
There are a few other, more minor, astrological events also coming this week ... the 3Q Moon, Mercury squaring Uranus and opposing Pluto (GeeZeus! Yet more bank blabber.) And the Sun will trine Saturn mid-week.
Still, it's Jupie's sign change that's the big event and I needed to give you the heads-up on that so you can trawl through your sector charts and consider adjusting where you have your boodle invested.
Now let's have a wander through some charts. Last weekend, I indicated markets had to "bottom now" or they were likely to continue crashing badly ... and I showed a couple of FTSE charts to highlight the potential for the optimistic outcome, even though Lunar Eclipse Full Moons didn't have a particularly reliable record of bringing in a bottom.
I confess I'd completely forgotten the English cousins were going to shut down for a bit of pomp. Not that it made any difference; the signals were there ... and, as it happened, played out.
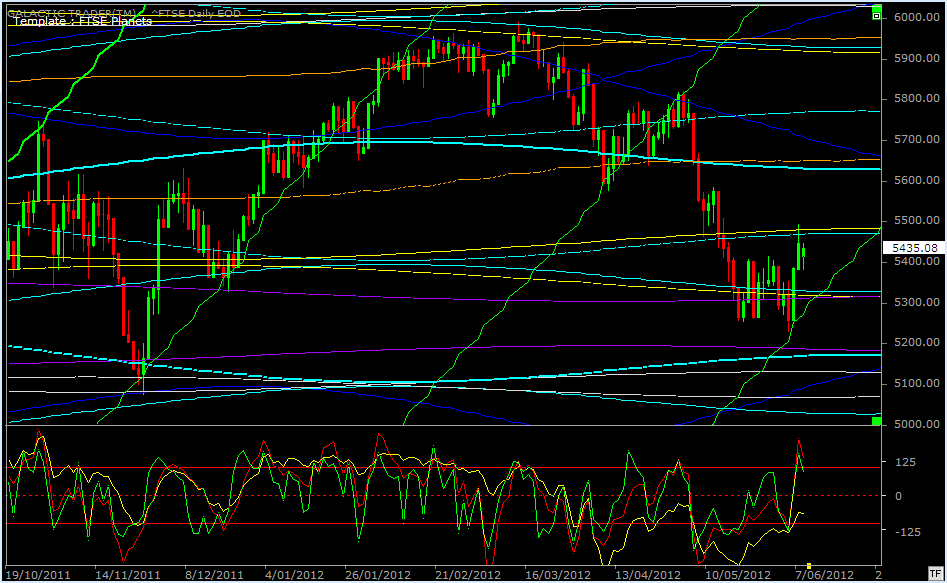
We began last week with a chart showing the FTSE's normal reaction to rising Sun lines and I said: "The index has had a distinct tendency to attach itself to one of these rising Sun lines during almost all of its uptrends, even the ones which have been relatively short-lived."
So, the cousins bounced back. Rather strongly. In fact, probably too much so. Pay special attention to the state of the red Canary in the oscillator panel. We've had a few of these strong spikes since last November's Low ... and in each case, they've caused Price to stop the rally temporarily and go into a sideways shuffle.
Often, the shuffle continued until Price again made contact with the rising Sun lines.
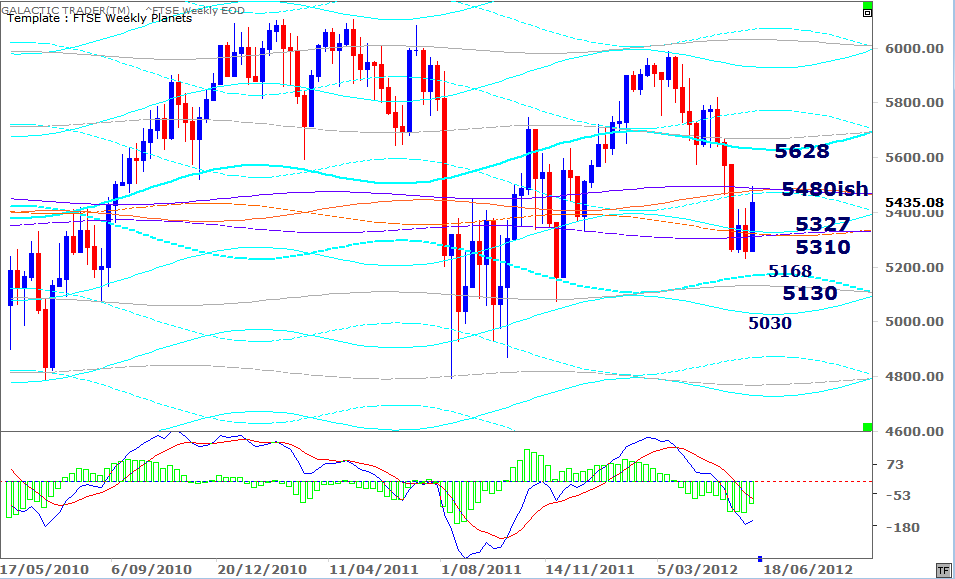
We can see the strength of the two-day move more clearly by just how far it travelled on the FTSE's Weekly Planets chart, below.
So, the cousins bounced back. Rather strongly. In fact, probably too much so. Pay special attention to the state of the red Canary in the oscillator panel. We've had a few of these strong spikes since last November's Low ... and in each case, they've caused Price to stop the rally temporarily and go into a sideways shuffle.
Often, the shuffle continued until Price again made contact with the rising Sun lines.
We can see the strength of the two-day move more clearly by just how far it travelled on the FTSE's Weekly Planets chart, below.
The planetary Price resistance around last week's High is obvious on both of the above charts ... as are the targets for either a confirmed breakout or breakdown.
Okay, so the potential for a return to optimism was heralded by the FTSE's "normal" reaction to rising Sun lines ... but the real question is whether the rally can be sustained for any length of time.
Let's revisit the Lunar Eclipse Full Moon chart ...
Okay, so the potential for a return to optimism was heralded by the FTSE's "normal" reaction to rising Sun lines ... but the real question is whether the rally can be sustained for any length of time.
Let's revisit the Lunar Eclipse Full Moon chart ...
If you consult last weekend's edition, you'll see the first harmonic Node line is a real long-term barrier for Miss Polly.
And the long-term uptrend is now under threat.
And the long-term uptrend is now under threat.
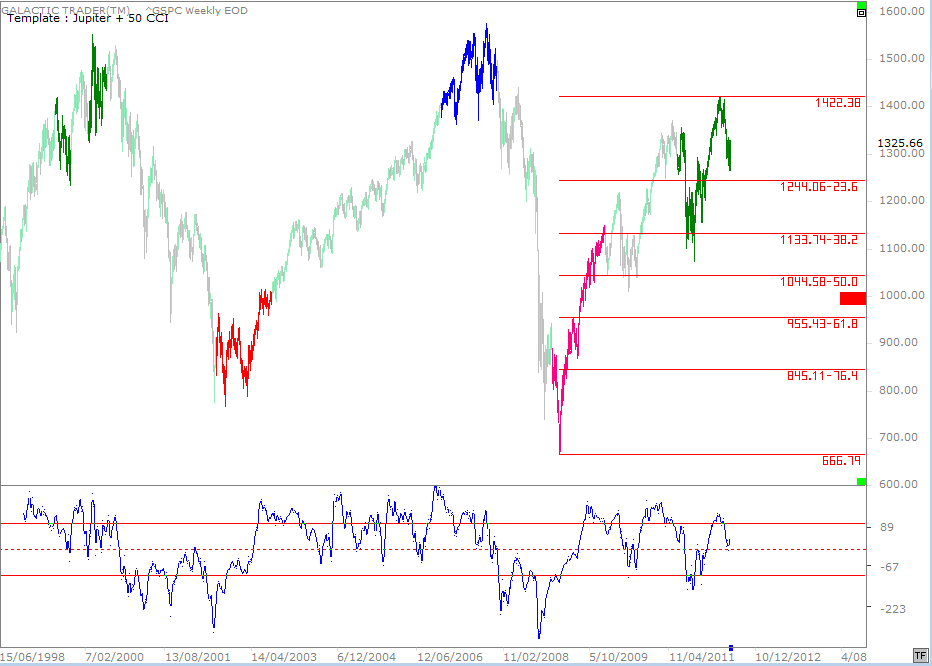
The chart above is The Jupiter Cycle chart ... markets peak with Jupiter in Taurus (dark green), drop into Jupiter in Leo (red) and rise again into Jupiter in Sagittarius (blue).
If the cycle plays out its usual tune, we could get a lower, secondary High with Jupiter in early Gemini ... but it's usually all downhill from there.
It's why I'm more Bearish than Bullish. You'll note the Canary has given two examples of negative divergence now ... a lower peak at the most recent Price High and a deeper trough during the August/October spikes down.
The Fibonacci Rx levels marked on The Jupiter Cycle chart show the downside Price targets if we are now in the early stages of a renewed Bear market.
The 50% level is a particularly interesting one. Bill McLaren, an American/Australian market forecaster of long experience, has noted over the years that major consolidations during an uptrend, tend to become the halfway marker for the total rally. McLaren uses that consolidation to predict what he thinks will be "the final top" for a Bull run.
As you can see from that chart, the first long consolidation after completion of the first major wave up, marked out territory likely to become just as important on the way down.
We've discussed at various times over the past few months, how the ASX200 has responded to 50% markers.
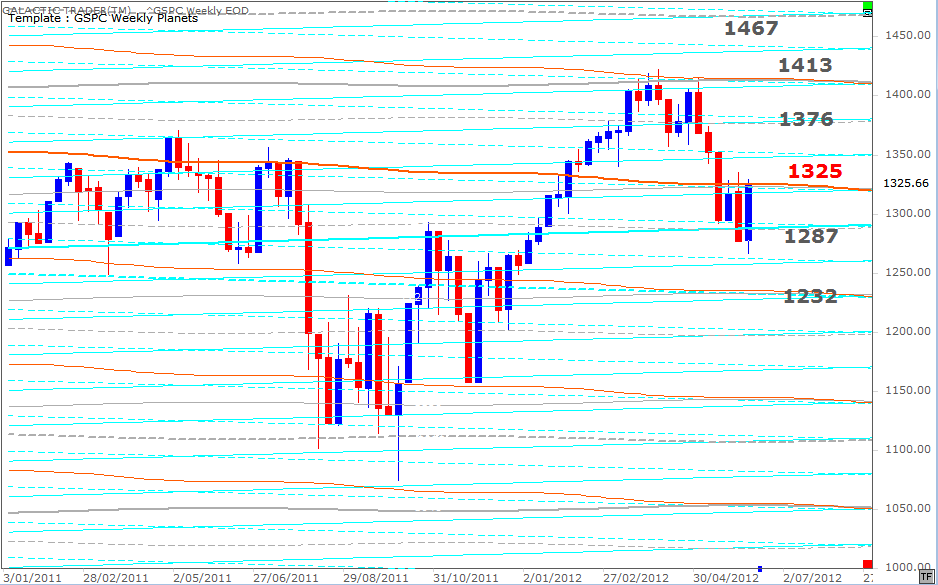
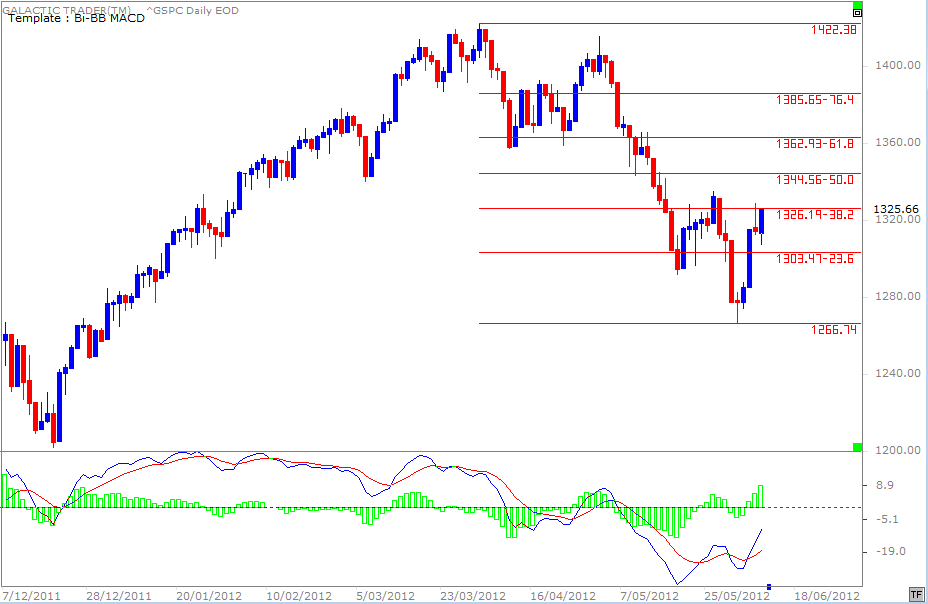
So, with Pollyanna's daily chart above, we would expect strong resistance to this bounceback rally to start showing up in the 1344-1360s region ... IF she can break through the Node/Fibonacci barrier around 1325.
The 50% level is a particularly interesting one. Bill McLaren, an American/Australian market forecaster of long experience, has noted over the years that major consolidations during an uptrend, tend to become the halfway marker for the total rally. McLaren uses that consolidation to predict what he thinks will be "the final top" for a Bull run.
As you can see from that chart, the first long consolidation after completion of the first major wave up, marked out territory likely to become just as important on the way down.
We've discussed at various times over the past few months, how the ASX200 has responded to 50% markers.
So, with Pollyanna's daily chart above, we would expect strong resistance to this bounceback rally to start showing up in the 1344-1360s region ... IF she can break through the Node/Fibonacci barrier around 1325.

Last week was the 8th Lunar Eclipse Full Moon since the Bear bottom in 2009. The 1st and the 6th of them coincided with downtrend Lows ... and now, maybe, another one.
But, to be a reliable Low, Miss Pollyanna - the SP500 - needs to make a solid weekly break above primary Node resistance around 1325.
But, to be a reliable Low, Miss Pollyanna - the SP500 - needs to make a solid weekly break above primary Node resistance around 1325.
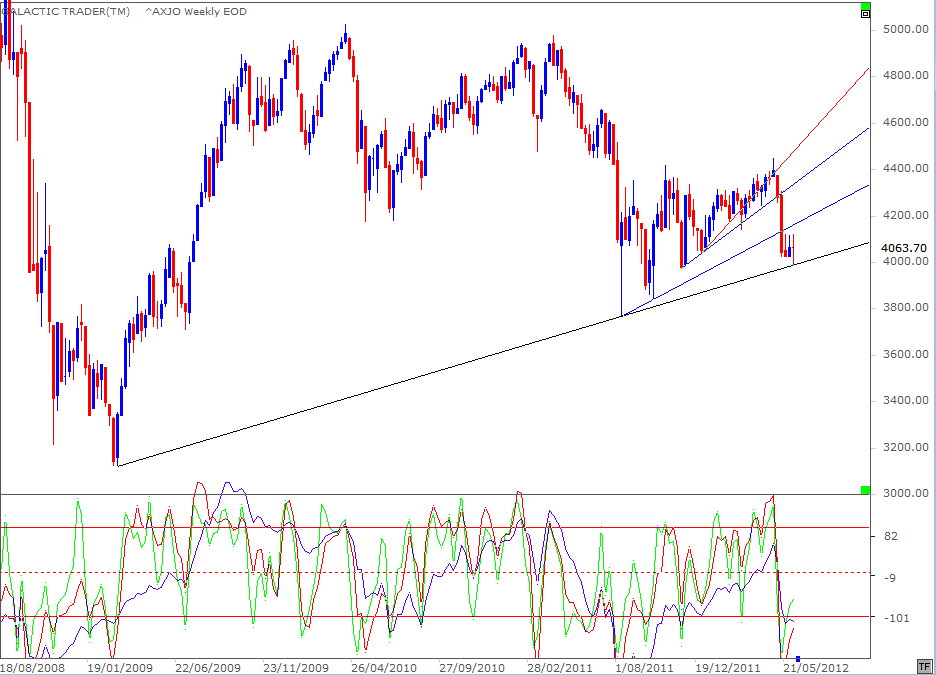
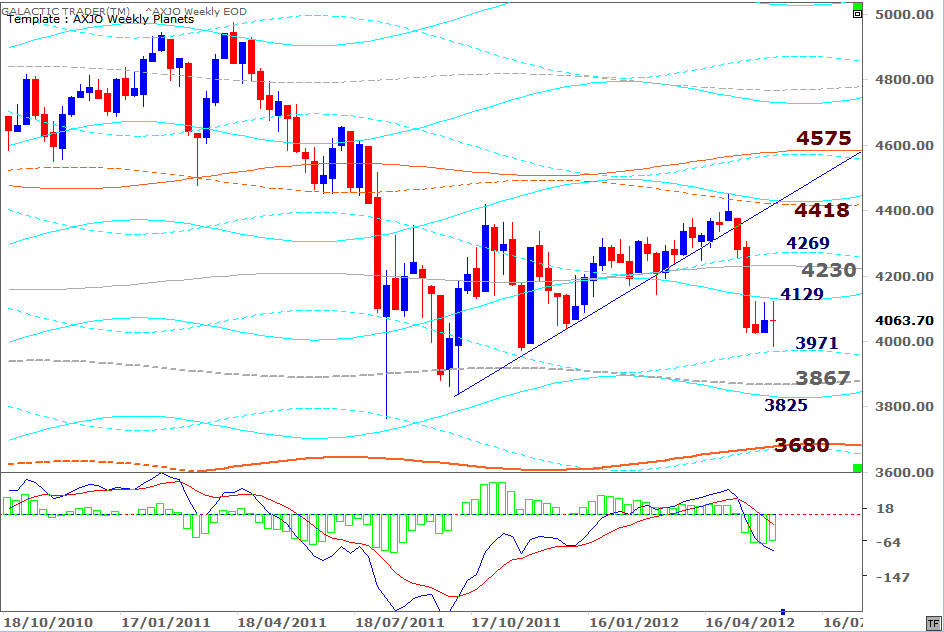
Now, let's take a look at the ASX200 ... and the omens continue to be just awful. Last week was a bounce from "obvious" Support ... and very, very low support at that.
In the coming weeks, we'll take a look at just how far down the Aussie market is likely to go if the Bear is back on the prowl. Believe me, it's far, far too depressing to discuss this week!
I'll leave you instead with an update of Auntie's Weekly Planets chart.
In the coming weeks, we'll take a look at just how far down the Aussie market is likely to go if the Bear is back on the prowl. Believe me, it's far, far too depressing to discuss this week!
I'll leave you instead with an update of Auntie's Weekly Planets chart.