Copyright: Randall Ashbourne - 2011


Potential end to the Bull run this week
Week beginning July 25, 2011
We may now be entering the final two weeks of the Bull recovery run from the Bear bottom in March, 2009.
I say may be because its not the only possible scenario and there have been many words written over a very long time warning against trying to pick tops and bottoms.


Exactly why I think that "may" be the case is what we'll walk through during the next few minutes, starting with the SP500 chart I've been using for the past few weeks and which ought to have provided you with some very profitable short-term trades ... or, at least, helped your understanding of the "systems" outlined in The Idiot & The Moon. (Yes, that was a plug.)
Safe trading - RA
(Disclaimer: This article is not advice or a recommendation to trade stocks; it is merely educational material.)
Well, golly gee whiz ... now there's a surprise. Not.
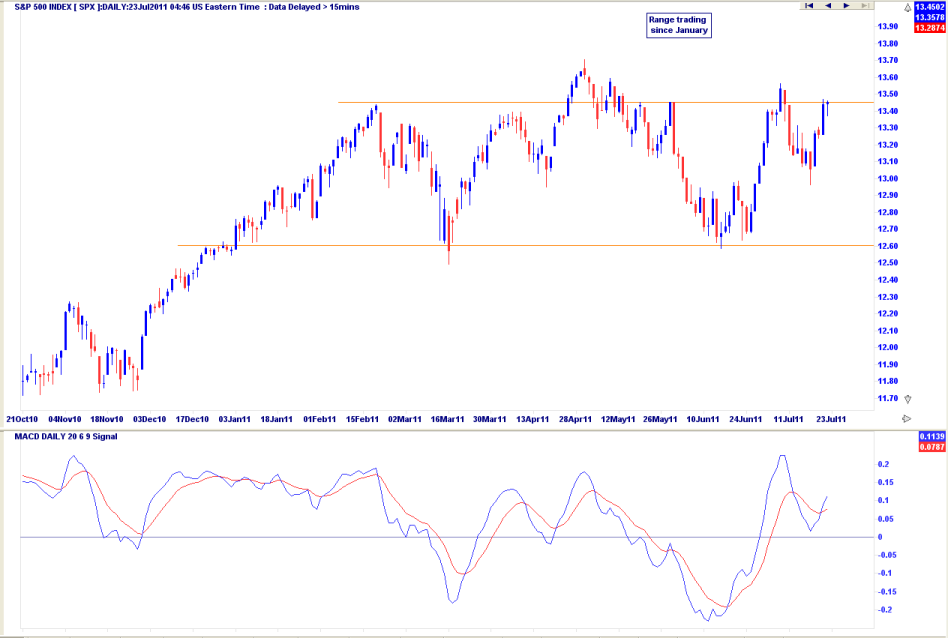
The low arrived one trading day after the Full Moon and the index launched itself higher in what we discussed last week as a potential run into the timeframe running from July 27 to early August for a final blow-off exhaustion, topping out the week at what we've used for the past few weeks as the upper end of the January-July "range".
If you've read The Moods of The Moon, or the excerpt under the Moon Trading button, you'll know Saturday of this weekend is the 3Q Moon and it's a statistical tendency for markets to continue riding higher into the New Moon or, when the uptrend is strong, even into the 1Q Moon in 2 weeks' time.
In the past few weeks, I've been over several methodologies where it's possible the index is aiming for the early 1400s. If you've read the book, you'll also recognise the potential negative divergence signal in the height of the current fast MACD peak ... and that it's an early-warning signal to be careful.
I thought we might take a look next at one of the charts I use in the Old Gods section of the book - the planetary price lines which dictate the start and finish prices of long-term, major moves in the SP500.
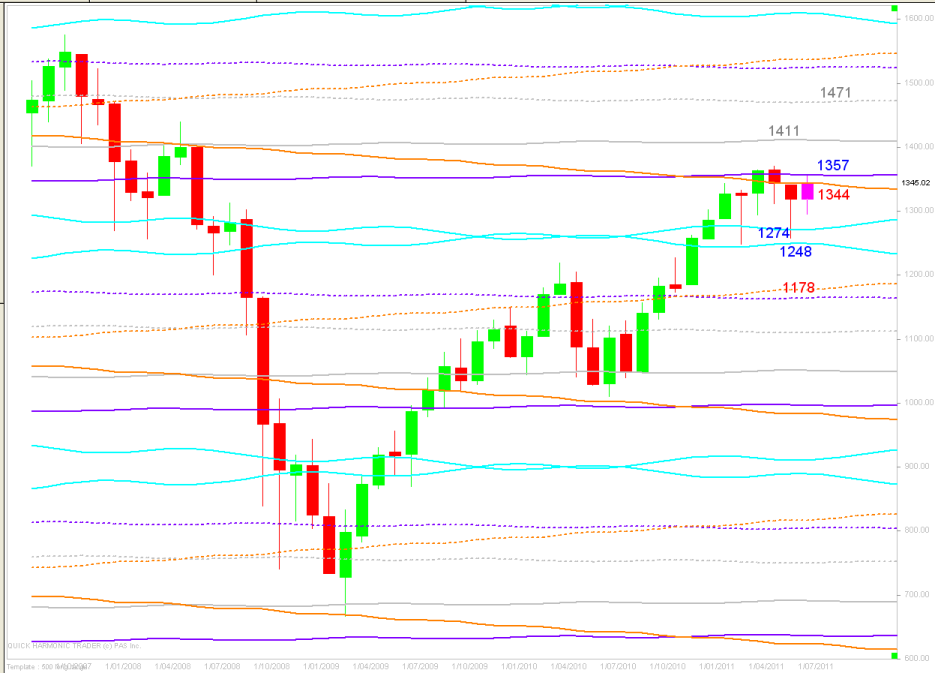
Many months ago in another forum, before I wrote The Idiot & The Moon, I used this chart to predict the SP500 would finally start running into serious trouble as it hit the 1360 level.
I explain the genesis of this chart - and the Old Gods responsible for the price levels - in the third major chapter of the book. The planetary price barriers Miss Pollyanna has been stalled at for most of this year will not easily be overcome. The high on July 7 and last weeks' probably temporary high both peaked at prices which match these planetary barriers very accurately.
Those of you who have read the relevant chapter will understand why I think a break north of these exact planet lines will be only a short-lived affair. Unless, as I said last week, logic has totally gone missing and irrational exuberance is the new "normal".
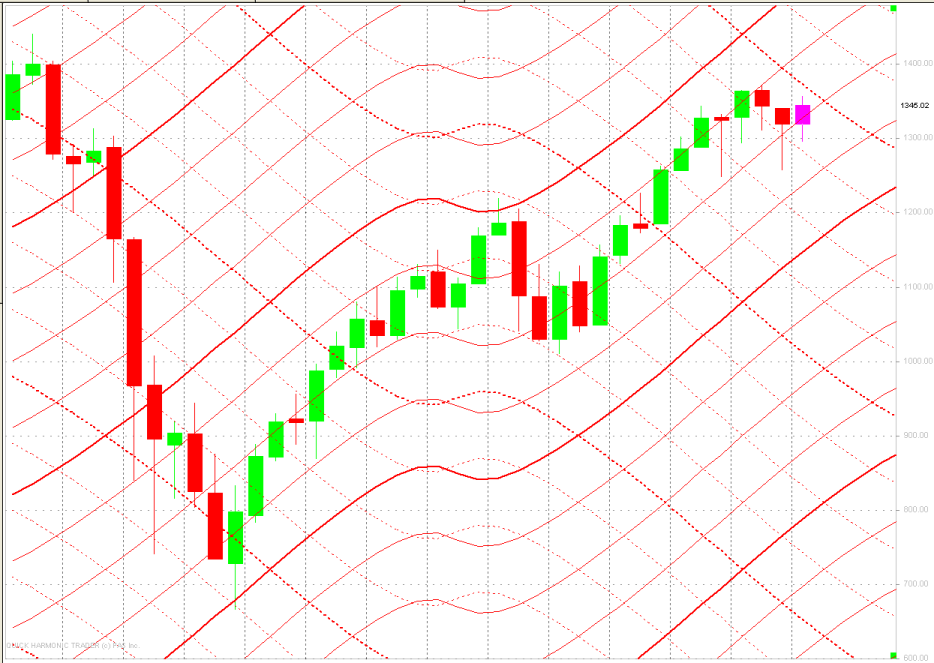
One of the other "spooky" charts I introduce my readers to in the Old Gods chapter is what I call my Mars Bars chart. On its journey up and down through Bulls and Bears, Miss Pollyanna travels between certain planets by hitching a ride on a Martian spaceship.
There will, of course, be some of you who think I've lost the plot. Tsk*tsk. Nevermind. The likely leading edge of Pollyanna's Marshun shuttle for this month is 1372.95 ... and if she dips below 1351 in August, especially with negative divergence in the recommended oscillators, the downdraft may well be underway.
Spikes through the Martian battle lines are not at all unusual ... so I'm still not prepared to rule out the early 1400s as a potential target for what I suspect is the final exhaustion run ... and especially since the 6-day timeframe running across the end of one month into the next is often a strong rally period.
But, but, but ... if July terminates with a sharp pullback below 1373, or if the index rolls over in early August and starts dropping below 1351, consider falling OUT of love with the Long trades very fast!
Why we might consider celibacy - or, even better, Shorting - is provided by having another look at London's FTSE, in this case the multi-decade monthly with two Bulls, two Bears and the state of the 2009-2011 Bullish recovery run.
We have some long-range planetary lines at work here again, but it's not what I want to show you - which is one of the lessons I detail in The Technical Section about how the same stock, or the same index, will tend to repeat the same angles time-and-again.
As we can see, the blue angle is the "normal" pattern for a strong Bull market - and the FTSE has been running at a much faster level since the 2009 double-bottom. AND it has been held down by a planetary price barrier for 8 months, while finding horizontal Support at the exact price level of the last low before the high of the two previous Bulls.
The MACD is rolling over, though not yet with a solid signal of negative divergence.
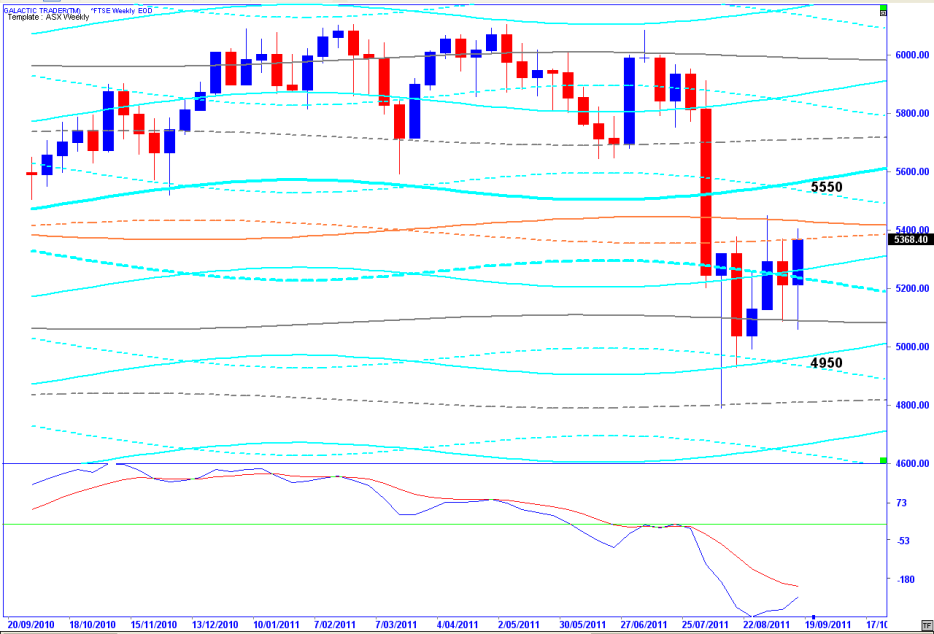
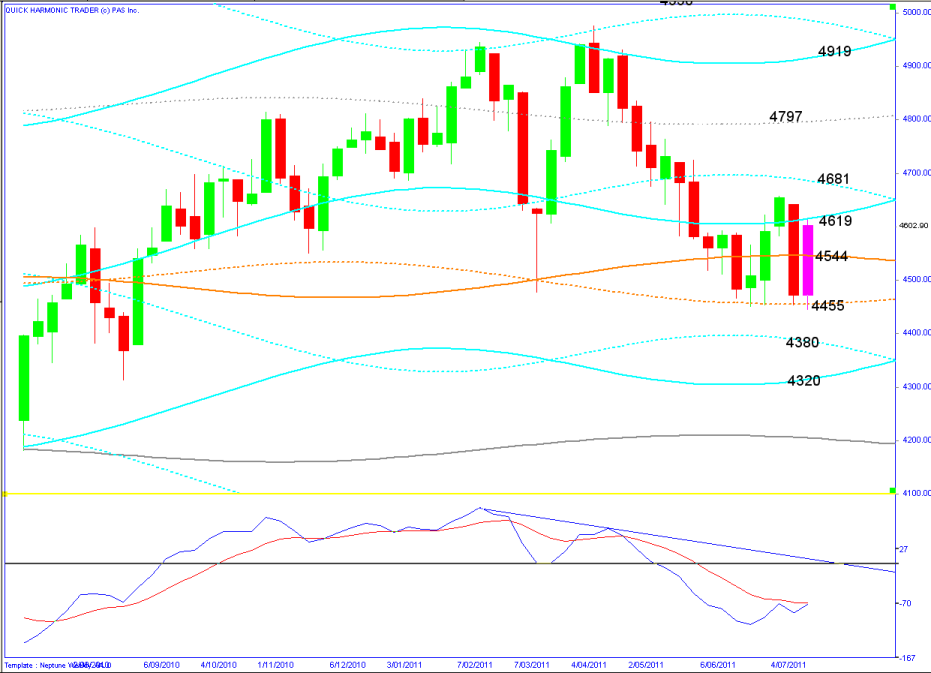
I'll leave you this weekend with another of the charts from the Old Gods chapter of the book - the weekly planetary price levels for the ASX200.
You'll note we have a developing positive divergence signal from the MACD, which is on the verge of making a Buy crossover, with a target level for the week ahead of 4681.
So, to recap. Over the past few weeks since I launched the book and this website, we've discussed the probabilities of markets following The Moods of The Moon within a horizontal band, obvious not only on the SP500 but on other indices like the FTSE and the ASX200.
I've been though the technical signals and the spooky stuff to outline why I believed a final, blow-off rally was likely and we've been through various methods to try to find a time zone and a price zone where that rally is likely to find its peak before a significant decline starts.
So far it's all running pretty much to schedule - and we haven't had to waste any energy agonising over the news. For the moment, the uptrend is intact and the danger still remains in being prematurely Short. However, the warning signs are gathering and this Bull is now getting very close to a potential turn south.
Copyright: Randall Ashbourne - 2011
And there is yet another of those famous old chestnuts we could pull out of the fire here: Markets can stay irrational longer than you can stay solvent. Wall Street has at least one of these pieces of pithy pop psychology for any and every circumstance.
To be blunt, I dont much give a rats. Ill leave the dithering, dissembling and duplicity to the people you pay for expert market commentary - or to those for whom you vote. Ill just tell you what I think is happening and you can make up your own mind.
For the past few weeks, I've been chatting about the range the SP500 has been trading in since January ... and the potential for a final, blow-off rally with a potential target in the early 1400s.
Last week I indicated we were within the Lunar phase timeframe for a potential two-week Low and indulged in some spooky stuff to make the comment:
"Now, what all this boils down to is - the omens, portents and entrails suggest "now" is not the time for markets to collapse in a huge heap. The energy at play between now and the end of the month tends towards a more optimistic outlook."
For the moment, that's what's in play - but. The danger period is now approaching fast.