
A major shift in planetary energies
Week beginning July 22, 2013
Wall Street completed its Grand Trine week with the SP500 closing at a new all-time High.

Copyright: Randall Ashbourne - 2011-2013
Because this week brings a major mood shift as various planets change signs, or direction. The Sun goes into Leo, Venus into Virgo; Uranus has gone Retrograde and Mercury is turning Direct again.
Mars will conjunct Jupiter, providing a last burst of energy to the Grand Trine involving Jupiter, Saturn and Neptune. By the end of the week, the energy shift of the planets could turn markets from optimism to pessimism.
The Sun will square Saturn and Mars will start igniting the Uranus/Pluto square again ... as a precursor to Jupiter making the same aspects in what I mentioned last weekend Ray Merriman calls a bankruptcy signature.
Since we've been discussing the danger that markets are now in the process of topping-out the Bull run, I'll publish some more targets for non-American markets this weekend.
But the rest of the world did not. It has been one of those relatively rare instances where American markets rallied all the way through the Mercury Retrograde cycle.
And that's part of what now leaves everyone just a little more vulnerable.
And that's part of what now leaves everyone just a little more vulnerable.


Safe trading - RA
(Disclaimer: This article is not advice or a recommendation to trade stocks; it is merely educational material.)
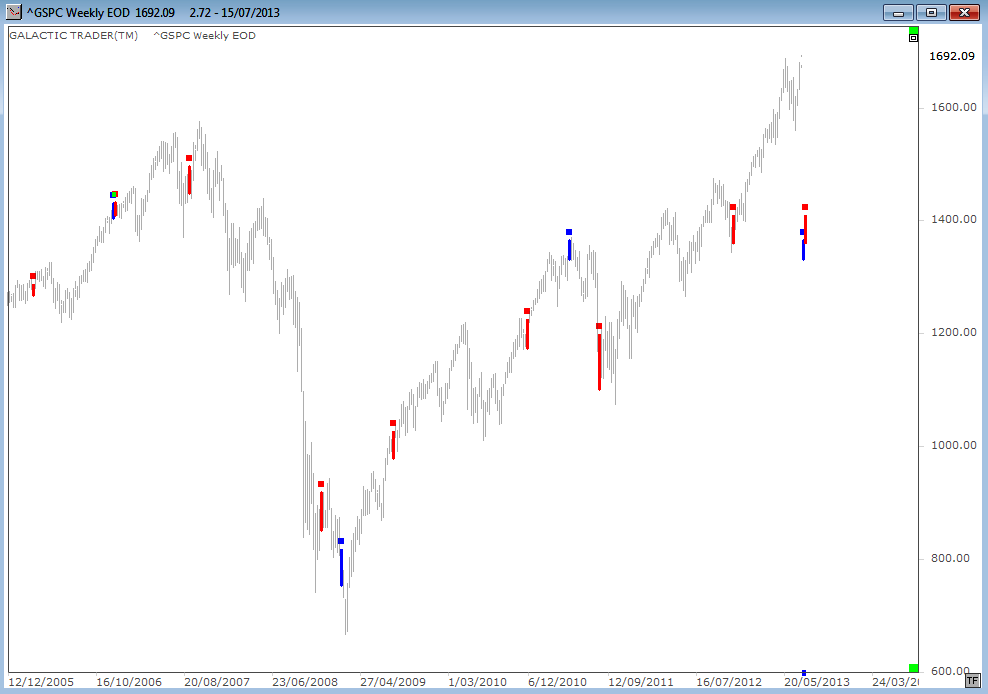
We will deal first, however, with a little more of The Spooky Stuff. Probably the two most significant transits in the immediate future are the Mars conjunction to Jupiter followed by Mars square Uranus.
Many of you may have heard dire, dire warnings of ... gasp*shock*horror ... "the Mars-Uranus crash cycle". I have dealt with this before. It's carp. And, yes, that's a misspelling. Mars makes some aspect with Uranus a couple of times a year ... and the hard aspects have no regular, reliable track record of producing a crash. Not even a little one.
In the chart below I have marked the Mars-Jupiter conjunctions with thick blue bars and Mars-Uranus squares with thick red ones. We have eight examples of Mars-Uranus squares ... and not a single one of them produced any sort of crash. In fact, one could argue the reverse.
There is more danger of Mars-Jupiter conjunctions producing an intermediate top.
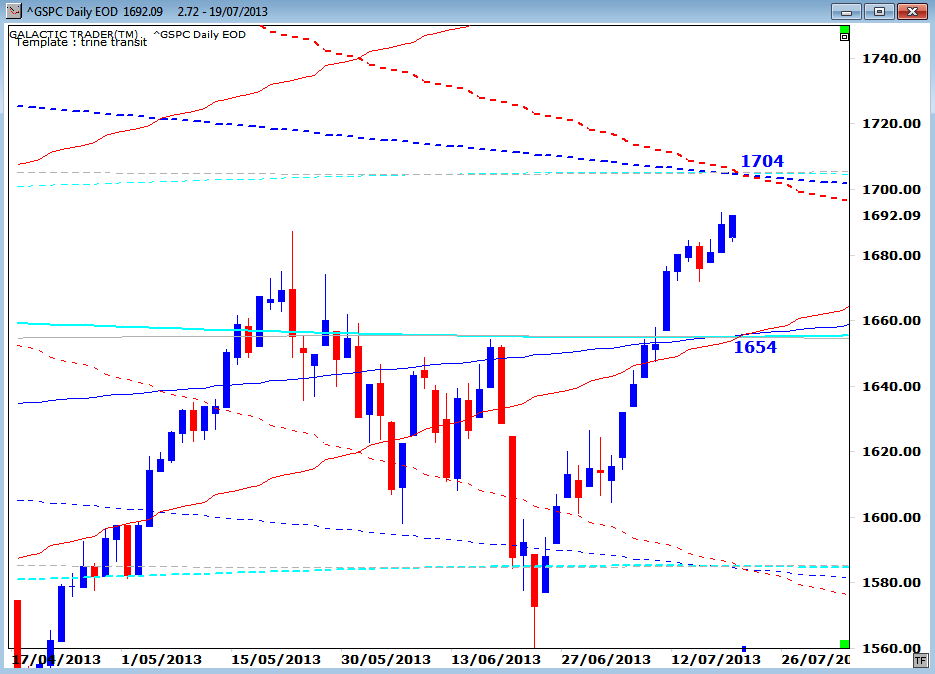
Either one of these aspects does carry enough punch to turn markets in a new direction. BUT! Time and Price have to "meet" precisely before one can predict a change with any degree of certainty.
I was watching Pollyanna, the SP500, and the ASX 200 quite closely last week to see if either of them intended making that "meeting". They didn't.
But, they do have another chance early this week. For Pollyanna, the two key Price levels are at 1704 and 1654. Allow about $3 either side of those numbers.
IF Miss Pollyanna jumps to 1704 and immediately starts to back down strongly, get out of Dodge! This is the Time & Price meeting place in space for the whole Mars-Jupiter-Saturn-Neptune interchange.
Forecast 2013 is now available for sale and download.
Click the button on the right for more details.
Click the button on the right for more details.


Forecast 2013 is now available for sale and download.
And since half the year is gone ... it's now half price!
And since half the year is gone ... it's now half price!
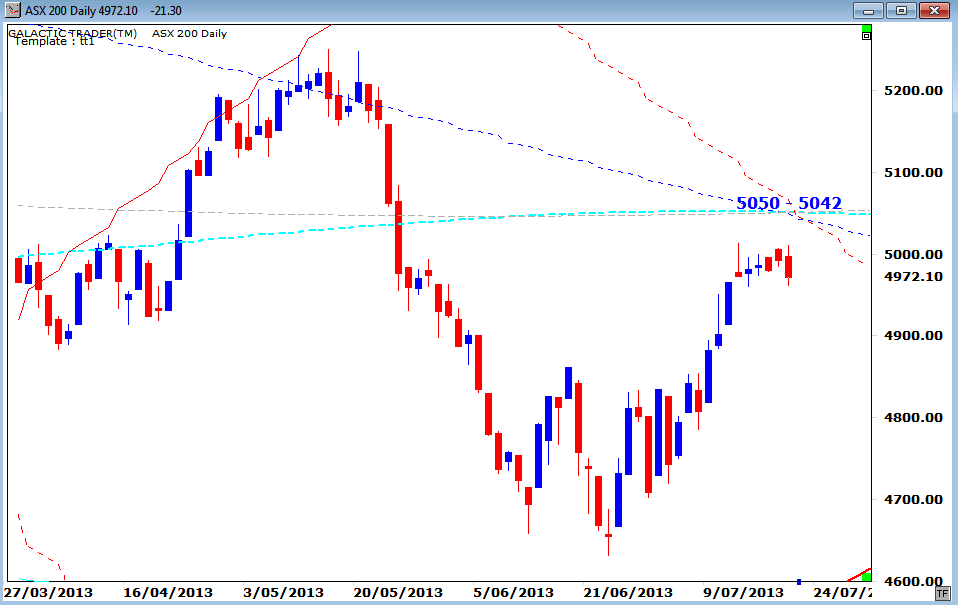
It's interesting that Miss Polly was not the only index to studiously avoid that meeting last week. So close ... and, yet, so far, was also the case for the ASX 200.
Auntie ASX just stopped in mid-air, flatly refusing to go to a meeting that could have forced the index to change direction.
Auntie ASX just stopped in mid-air, flatly refusing to go to a meeting that could have forced the index to change direction.
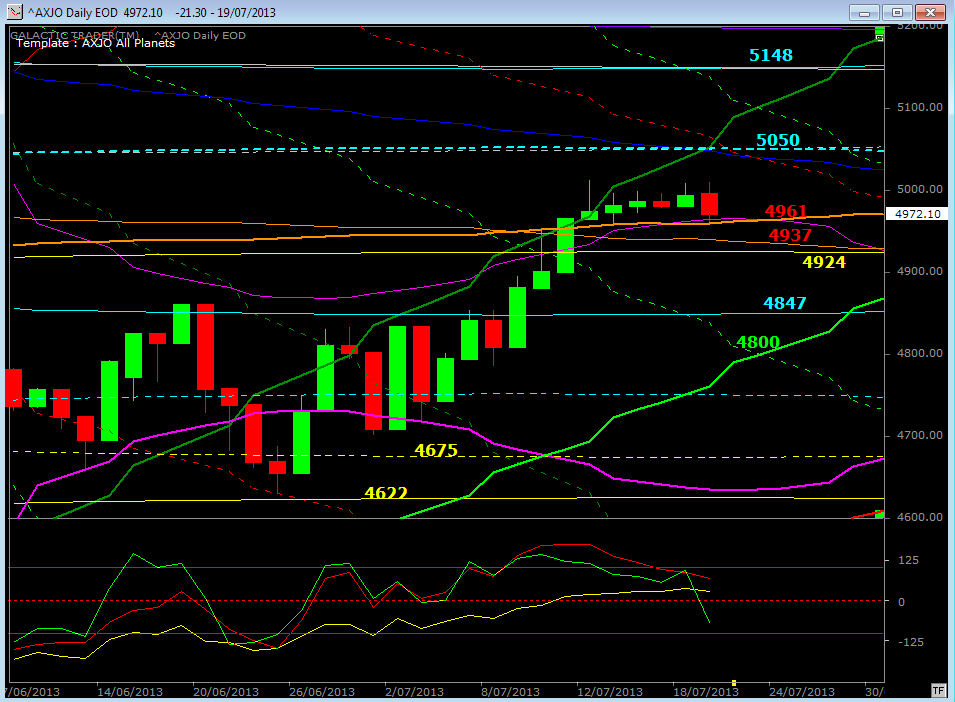
And it was mid-air, which is a little more obvious in my personal planetary chart for the ASX below. Had either of these indices hit those exact price levels and failed to break through, it would have been a very bad sign for further gains in the intermediate future.
The Time & Price meeting place is activated again early this coming week and the action - and reaction - will have to be watched very closely if Polly hits the very early 1700s, or 5042ish for Auntie.
The Time & Price meeting place is activated again early this coming week and the action - and reaction - will have to be watched very closely if Polly hits the very early 1700s, or 5042ish for Auntie.
Failure to hit the exact Price levels, on Time, makes it a lot more difficult to determine a significant change of direction.
Now, I showed Bull target levels for Pollyanna, the FTSE and the ASX last weekend and indicated I'd update charts for other indices in the coming weeks.
This weekend, we'll look at India, Singapore and Shanghai.
INDIA
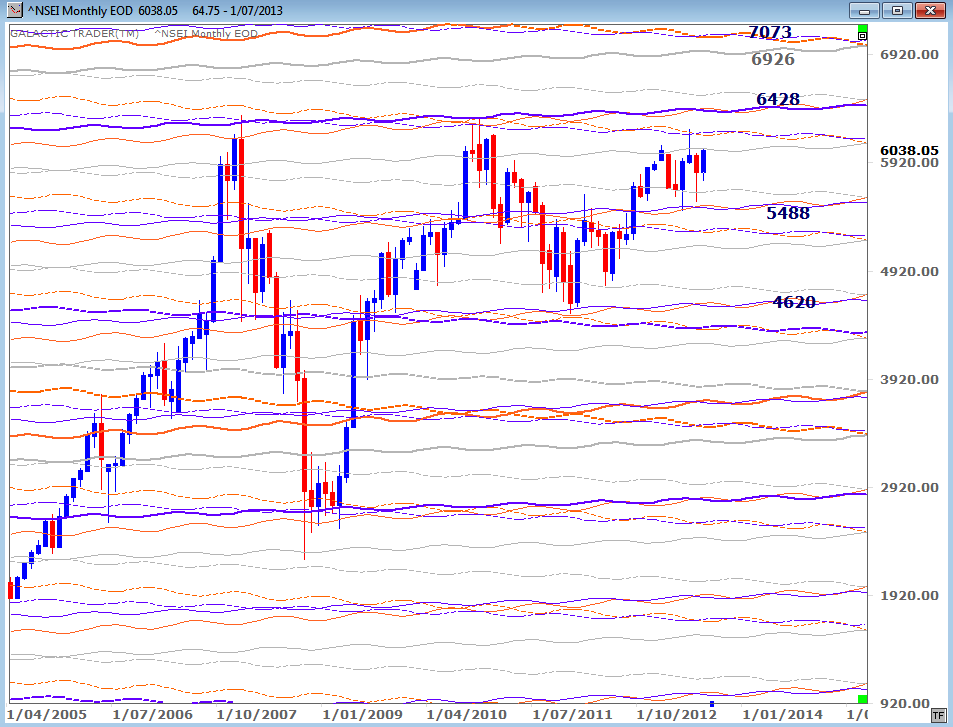
Our first chart is a long-range monthly for the Sensex. It is once again approaching the key level in the 20,200s ... and with a medium-term oscillator looking distinctly unhappy. Obviously, to eliminate the danger implied by making a triple-top, the index needs to break through the long-range barrier decisively.
Now, I showed Bull target levels for Pollyanna, the FTSE and the ASX last weekend and indicated I'd update charts for other indices in the coming weeks.
This weekend, we'll look at India, Singapore and Shanghai.
INDIA
Our first chart is a long-range monthly for the Sensex. It is once again approaching the key level in the 20,200s ... and with a medium-term oscillator looking distinctly unhappy. Obviously, to eliminate the danger implied by making a triple-top, the index needs to break through the long-range barrier decisively.
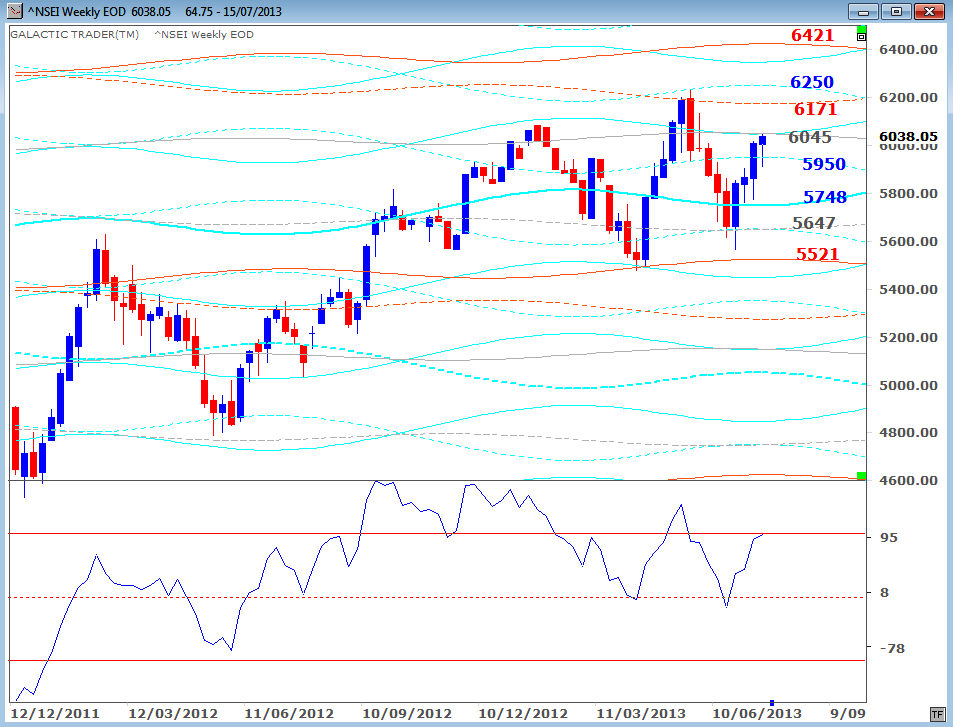
The Weekly Planets chart for the Nifty is below. It ended last week retesting a Saturn-Neptune price zone. It's a key level the index must break through decisively to trigger the final potential targets for India's Bull.
If it can do that, the next danger zone is in the range from about 6200 to the mid 6400s. This is the range of the planetary line-up which stopped the two previous Bull peaks. If the Nifty gets through that barrier, the target becomes the 7000s.
SINGAPORE
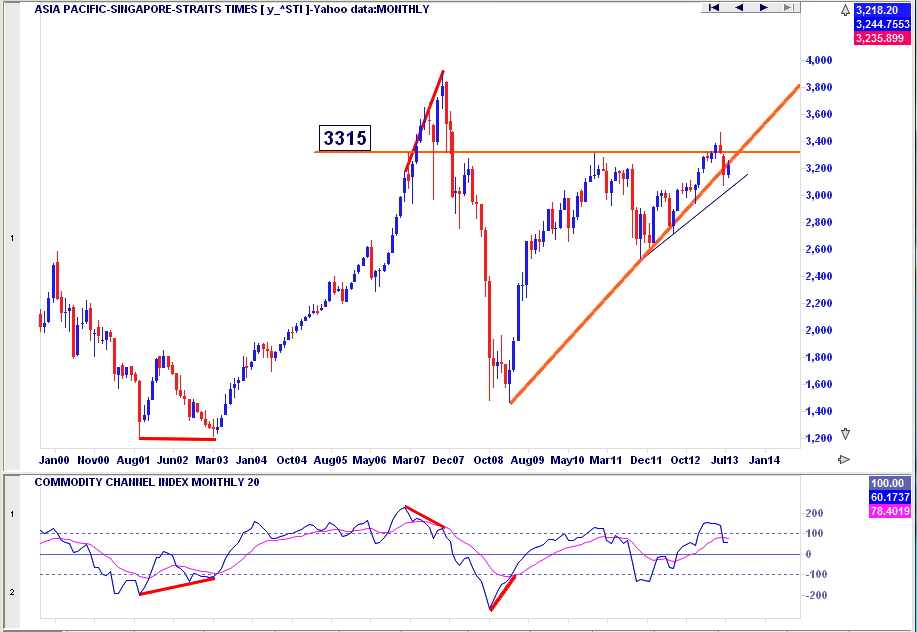
The STI is also approaching a key barrier. I used the American charts last week to show how Big Bird and the medium-range oscillator tend to give advance warning when markets are making either a long-range top, or bottom.
And there are further examples below. The double-bottom in Price terms of the early 2000s Bear showed clear positive divergence in the oscillator ... as the run into the 2007 Bull peak showed clear negative divergence.
And then, another obvious case of positive divergence at the 2009 Bear bottom. And I repeat what I've been saying about Pollyanna ... we are not yet receiving warning sirens that suggest we are in dire and imminent danger. There is some relatively mild divergence in the current state of the oscillator versus price. The sirens are starting to go off ... but they're not yet becoming strident.
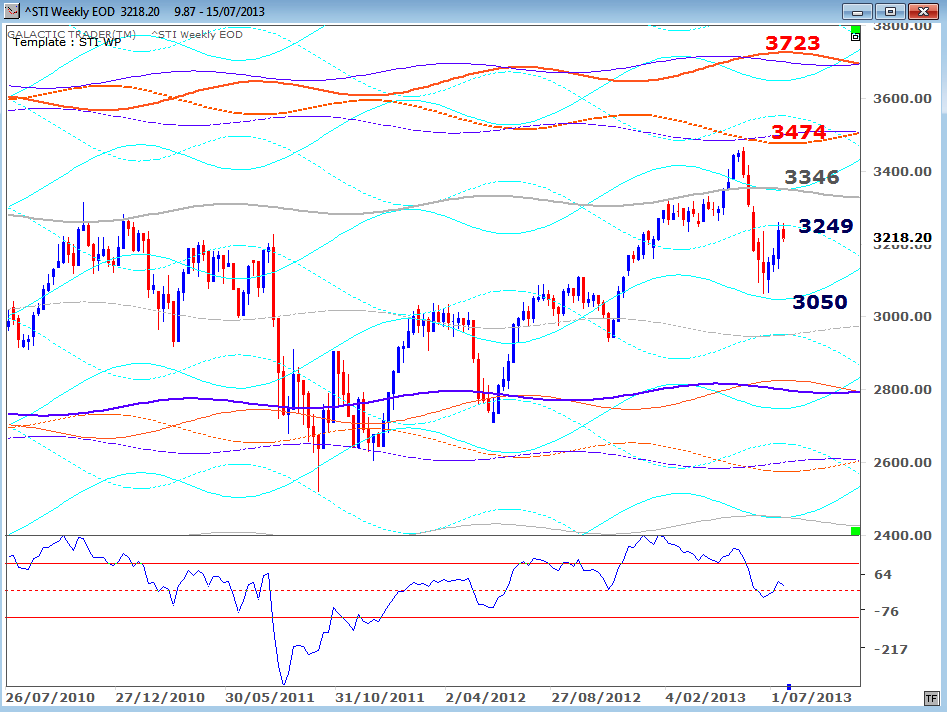
Now, while the chart above shows a technical level of significant resistance in the early 3300s, the STI's Weekly Planets chart, below, offers three higher targets if the topping process is going to continue into the August-October timeframe.

CHINA
It's difficult to get a read on Shanghai, which continues to test the validity of the Bear low. Mild positive divergence in the oscillator seems to be trying to build, but so far can't manage to get traction.
It's difficult to get a read on Shanghai, which continues to test the validity of the Bear low. Mild positive divergence in the oscillator seems to be trying to build, but so far can't manage to get traction.
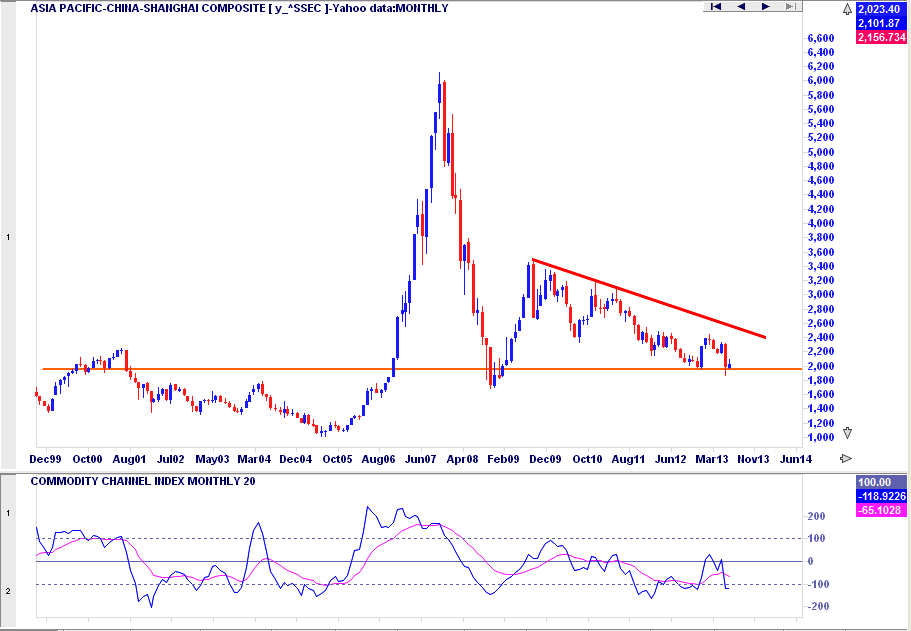
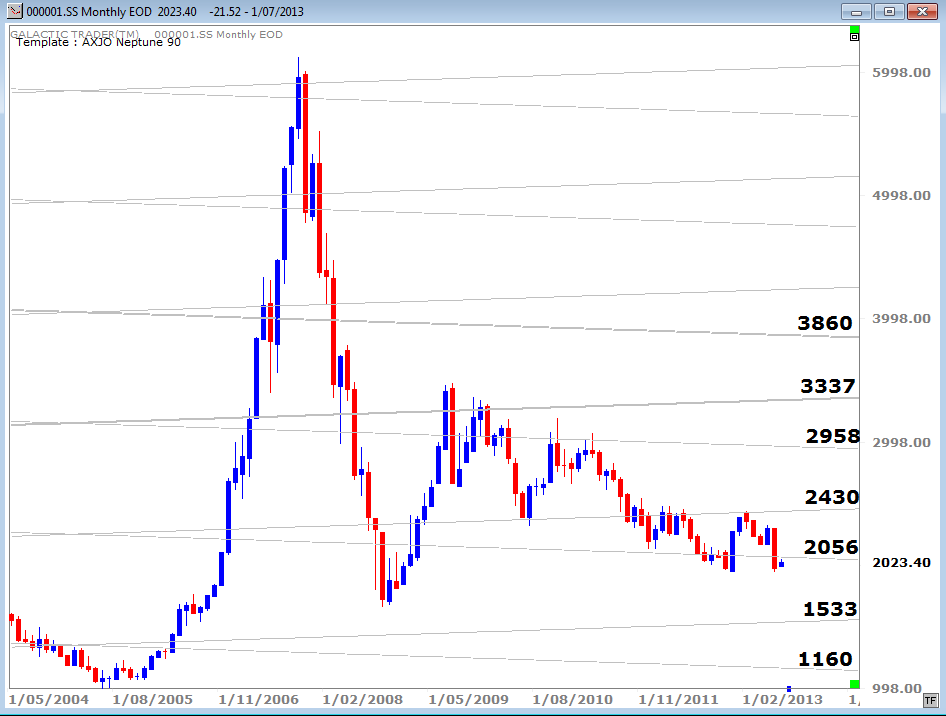
But the index needs to recover the Neptune level at around 2056 on the long-range planetary chart below ... or it's in danger of plunging another 25%.
Okay, for those of you unskilled in technical mischief, you can do a right-click on any of these charts and save them as an image to consult in the coming weeks. Yes, I know ... India, Singapore, China. Not a lot of technical ineptitude going on there.
Keep a close eye on what prices Polly and Auntie get up to on Monday/Tuesday. Loud warning sirens if Polly especially goes to around 1704 and poops her panties! If she goes through ... decisively ... we'll probably go back into goo-goo/ga-ga/gush mode.
Keep a close eye on what prices Polly and Auntie get up to on Monday/Tuesday. Loud warning sirens if Polly especially goes to around 1704 and poops her panties! If she goes through ... decisively ... we'll probably go back into goo-goo/ga-ga/gush mode.