Copyright: Randall Ashbourne - 2011


Profits, predictions and a review
Week beginning July 11, 2011
Welcome to my new readers from Europe, India and the United States. This weeks Eye of Ra stock market report will be fairly lengthy as I highlight some aspects from the past two weeks and relate them to the methodologies outlined in The Idiot & The Moon.
A special welcome to those of you arriving from astrologicalinvesting.com and the old World At Large reports.
We will deal this week with several of the lessons from the book.
1. Trendlines - and the ability to draw a channel from a single line.
2. Moon Trading - and how it can be an unprofitable trade to Short a market immediately at the New Moon, despite the statistical tendencies.
3. Fibonacci Extension and Retracement levels, and
4. Divergence in our tweaked oscillators.
Those of you who already have a copy of the book will have no trouble understanding how these lessons allow for safe, reliable and regular trades to be entered, without worrying about what the talking heads on TV are saying.


We will begin by going back to the June 27 report, when I posted the following chart and made these comments in relation to it: -
The key information was:
We can see there is potential for a short-term bounce within this range - with some confirmation from positive divergence developing in the oscillator. But we have to look at this potential within the context of the long-term overview - and adjust our expectations accordingly.
So, what happened in real life?
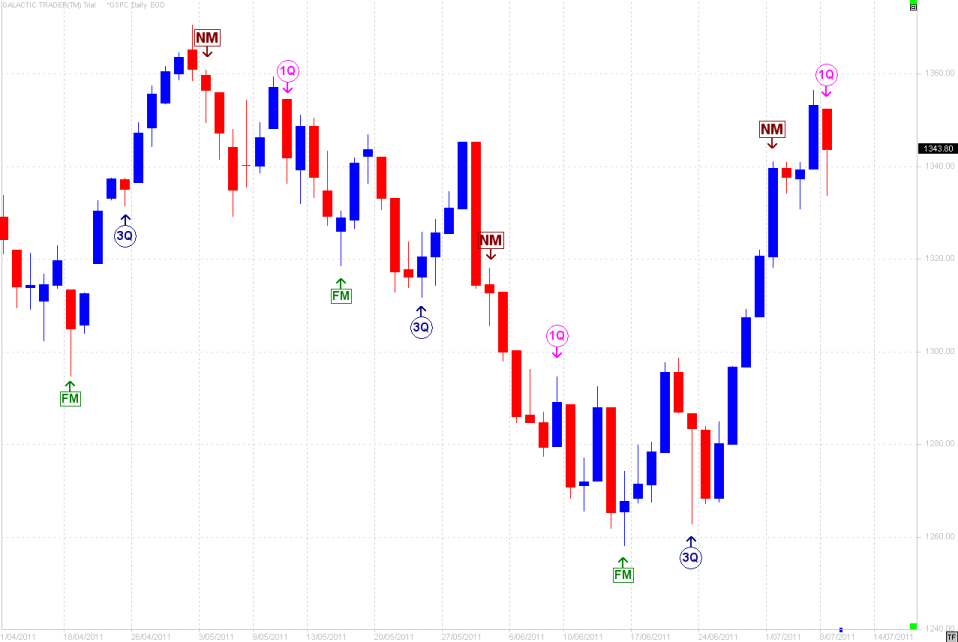
I make the point in the book, and even in the Moon Trading excerpt, that it often a mistake to Short the market immediately at the New Moon. Moon trading decisions have to be informed and filtered by other, mechanical systems - especially The Idiot itself.
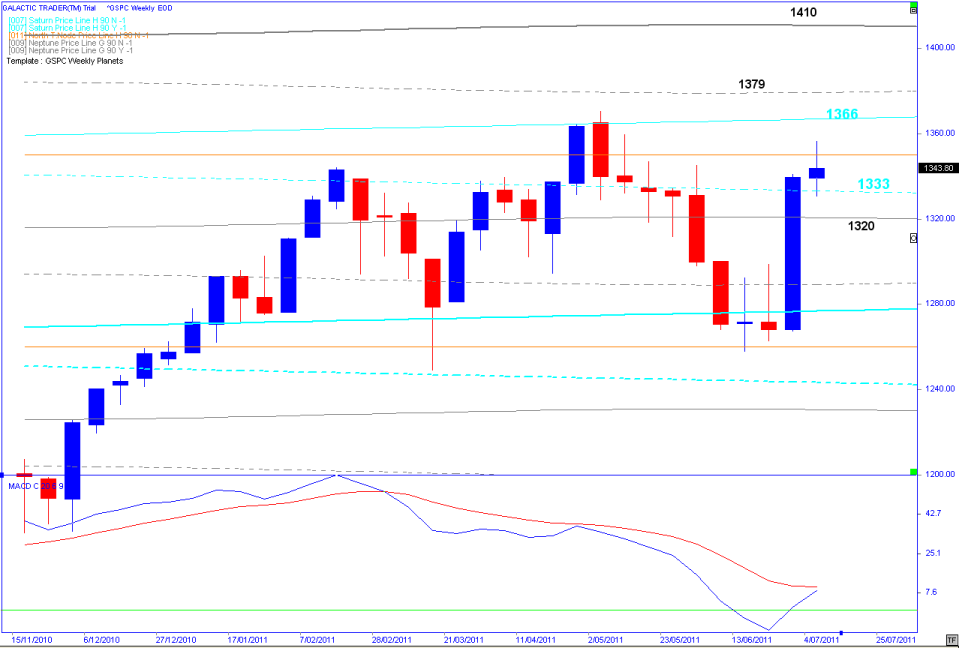
I'll end this week's report with the weekly Old Gods chart of the 500. It is also indicating the potential to reach into the 1400s, if there is only a small-level retracement here. Anyone considering Shorting the market should be aware of this potential. Remember that trends tend to end with a bang, not a whimper; there is, almost always, a final exhaustion run which rapidly runs out of real buyers.
This index is still well within the borders of a very clearly defined uptrend and the resistance it is running into should surprise no-one and may prove to be only temporary. On the other hand, the charts also show the danger of potentially going Long for too long at these elevated price levels.
There are reasonably safe levels and timeframes to put Long trades on, as demonstrated by going back to the June 27 Eye of Ra; and there are relatively safe levels to venture into a potential, but protected, Short position, as evidenced by the horizontal lines on that first chart and the timing of the 1Q Moon.
I'm sure there are some readers who are a tad disappointed I have concentrated on the SP500 this week and would like to send all manner of requests to include this, that, or the other, in future. You're missing the point. As I said at the beginning ... those who have already started reading The Idiot & The Moon, and applying the techniques, will have had no trouble at all understanding anything in this report.
If you're just reading along, hoping to pick things up over time ... well, you're very welcome. But, you're short-changing no-one but yourself. The whole purpose of the book and the website is to help you learn how to do it all for yourself, to make yourself totally independent of articles like this one. I'd remind you of that old saying ... give a man a fish and he eats for a day, teach him how to fish and he eats for a lifetime.
Safe trading - RA
(Disclaimer: This article is not advice or a recommendation to trade stocks; it is merely educational material.)
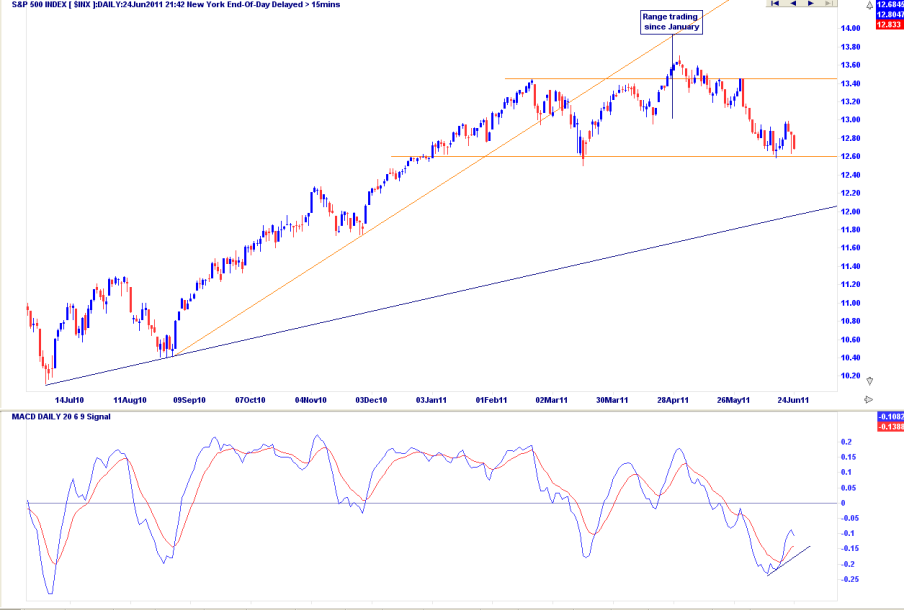
"Having checked the long-range monthly charts to get an overview of the forest, we can turn our attention to a closer view of what's happening now. Immediately we can see the SP500 has been rangebound since early this year - prices are trapped within a horizontal layer.
This is a classic and certain indication of a Time phase, as I describe in the book. We can see there is potential for a short-term bounce within this range - with some confirmation from positive divergence developing in the oscillator. But we have to look at this potential within the context of the long-term overview - and adjust our expectations accordingly."
This is a classic and certain indication of a Time phase, as I describe in the book. We can see there is potential for a short-term bounce within this range - with some confirmation from positive divergence developing in the oscillator. But we have to look at this potential within the context of the long-term overview - and adjust our expectations accordingly."
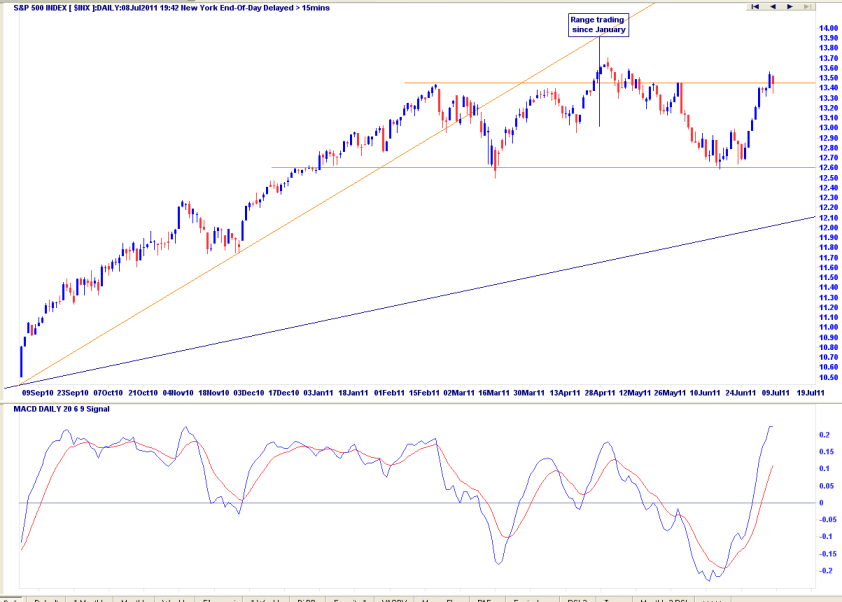
The positive divergence signal from our fast MACD did indeed forecast a bounce - a bounce which took it all the way back to the top of the horizontal range where it is, unsuprisingly, starting to stall.
And there are at least two reasons it is not a surprise, one of which relates to Moon phases.
And there are at least two reasons it is not a surprise, one of which relates to Moon phases.
OK ... So we've dealt with the recent past; now it's time to see what might lie ahead and we are going to use several of the techniques detailed in The Technical Section of The Idiot & The Moon.
There is a lot in this next chart, but we will go through it step-by-step.
There is a lot in this next chart, but we will go through it step-by-step.
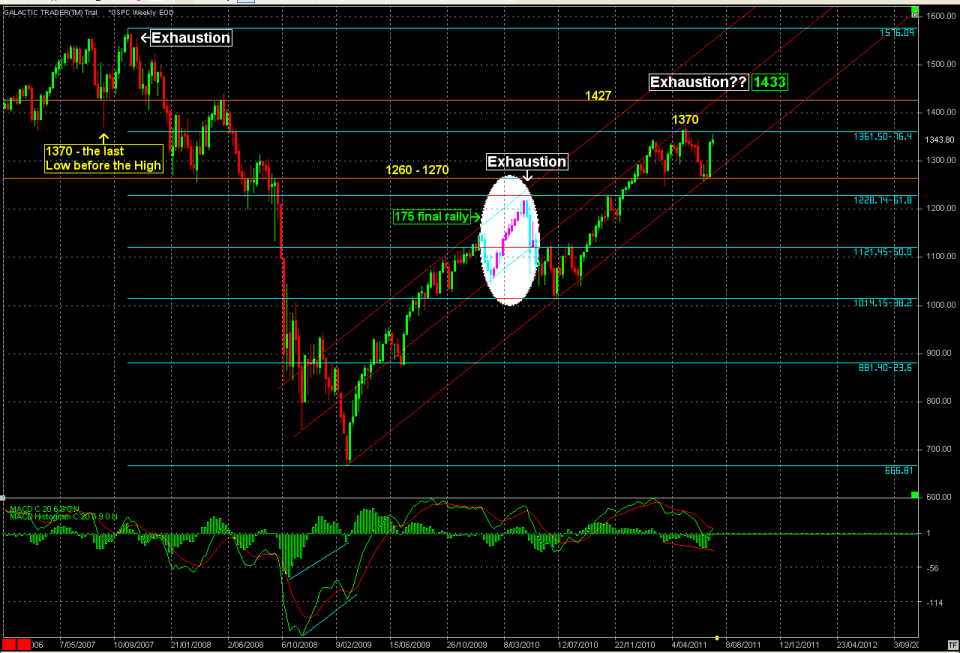
1. The SP500 has bounced from the bottom of a trend channel in place since the Low in March, 2009. In other words ... the index is still in an uptrend and is continuing to respect the angle of the trend.
2. Negative divergence continues to build in the fast MACD, both in the depth of the signal line drops and in the depth of the histogram - but there is a turn higher, warning against Shorting too heavily or too prematurely.
3. Price resistance is being hit, not only from a Fibonacci Rx level, but also around the 1370 price which marked the spike low in August, 2007 - a particular circumstance known as "the last Low before the High".
4. The last two Price declines have stopped at a horizontal level (defined by the lower orange line) which has historical validity and is, therefore, important.
5. There is some potential for a final, blow-off rally - similar to both the 2007 exhaustion move and the final exhaustion spurt at the end of the first leg of the post-2009 recovery rally.
6. Extrapolation from the two previous exhaustion blow-offs suggest the 500 could be aiming for the low 1400s, if it can break through the Resistance levels around 1360/1370.
So, what we have here are two possibilities - either the index is topping out at a slightly lower high and is about to go into freefall, or the weakness will be only short-lived (maybe down into the Full Moon) before a final exhaustion rally tops out and brings on a very significant decline.