

Wall Street's rally: no sign of The Top yet
Week beginning January 13, 2014
The stock market leaders - the Dow, the 500, the Nasdaq and the DAX - all hit their highs on December 31 or January 2
Copyright: Randall Ashbourne - 2011-2014
Prices have been in corrective mode since, but so far there is nothing scary in either the price action or the state of the oscillators.
The coming week is relatively quiet in terms of astrological aspects. Midweek, we get the Full Moon and a Venus square to Mars.
Neither of those normally has enough oomph to produce a major change in the trend.
Gold ended the week making another attempt to break the overhead barrier of a secondary Pluto line, priced around the 1248 level. Those charts are in Forecast 2014.
The daily Big Bird oscillator has spiked higher, indicating an above-average chance that price will continue its northbound run.
There is another secondary Pluto price line at 1272, but the target for this run is probably higher still - into the 1300s.
The Idiot has now gone to a gold Buy signal on both daily and weekly timeframes.
That was the exact timeframe of the first major Bradley trend change date for 2014.


Warm regards, best wishes and ... Safe trading - RA
(Disclaimer: This article is not advice or a recommendation to trade stocks; it is merely educational material.)
Gold bouncing strongly higher while stock prices basically flatline is a somewhat contradictory message, leaving one or the other vulnerable to a sharp drop.
However, for the moment, there are few signs of an imminent plunge in stocks.
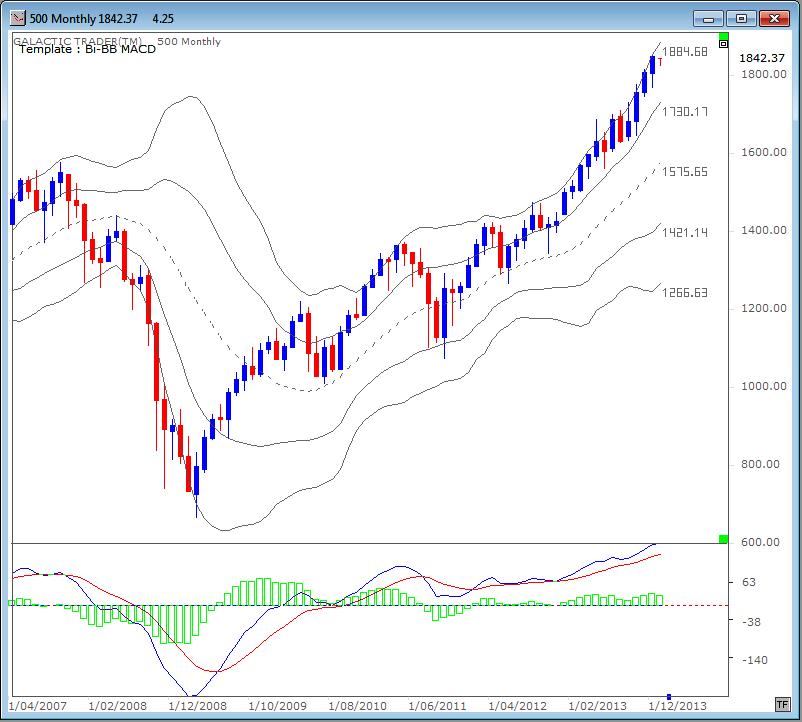
The monthly Bi-BB chart of the SP500 is our first chart this weekend. For almost a year price has continually made a touch of the upper band, with breaks above it tending to produce the expected stalling.
And that may be what we have again. Price ended last week exactly where it started the year. The fast MACD endorses the validity of the long-running rally by recording its own new peak in line with the price. The MACD histogram is wavering, but not screeching.
However, for the moment, there are few signs of an imminent plunge in stocks.
The monthly Bi-BB chart of the SP500 is our first chart this weekend. For almost a year price has continually made a touch of the upper band, with breaks above it tending to produce the expected stalling.
And that may be what we have again. Price ended last week exactly where it started the year. The fast MACD endorses the validity of the long-running rally by recording its own new peak in line with the price. The MACD histogram is wavering, but not screeching.
A weekly version of the same technique does indicate the rally is starting to weaken internally. Note there is now a reasonably significant level of negative divergence between the higher prices over the past 3 weeks and the slump in the current state of both the MACD signal line peak and the histograms.

NEW:
Forecast 2014 is now available for sale and download.
Click the button on the right for more details.
Click the button on the right for more details.

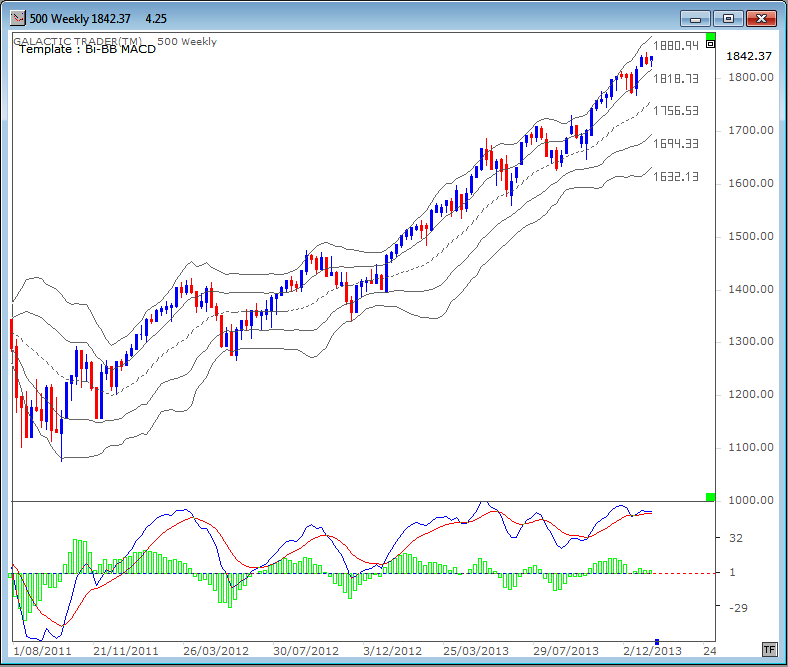
It's not so strong that it rules out an attempt at new highs on Wall Street; simply a warning that the danger of a rollover is growing.