Wall Street launches into exhaustion run
Week beginning February 6, 2012
What looks suspiciously like overnight intervention on both Wednesday and Friday has pushed Wall Street back into its exhaustion run.

Copyright: Randall Ashbourne - 2011-2012
Last weekend, I said:
"Pollyanna has hit, and resiled from, one of the strongest of the very long-range planetary price markers which have significant impact as both Support and Resistance barriers.
Unless there's a Black Swan ready to take flight however, there does not yet appear to be sufficient negative divergence in the oscillators to warn of a death dive."
The SP500 dived on Monday, giving us some hope of a 2nd degree countertrend towards the coming Full Moon.
However, the dive stopped with a 1st degree countertrend as the US Federal Reserve stepped in with some public jawboning to back up its less upfront financial interventions to prop-up European economies. (The length of countertrends - 1st degree, 2nd degree and cyclical - is explained in The Technical Section of the book.)
In a moment, we will deal with how far the rally can run before the Bears again take control. For now, the master programmers retain control - with the computers shifting on an almost daily basis to boost prices on the DJIA, the NDX, or the SP500.
And Jupiter, the king of the Old Gods, remains in monetary expansion mode in the early degrees of Taurus.
The official data is not showing the huge Opening gaps ... but even the computers can't sustain this angle for long.
Nor is it really a surprise. There is the Jupiter-in-Taurus historical tendency still at work on price levels and, technically, the lack of alarm bells ringing in the oscillator readings.
Nor is it really a surprise. There is the Jupiter-in-Taurus historical tendency still at work on price levels and, technically, the lack of alarm bells ringing in the oscillator readings.


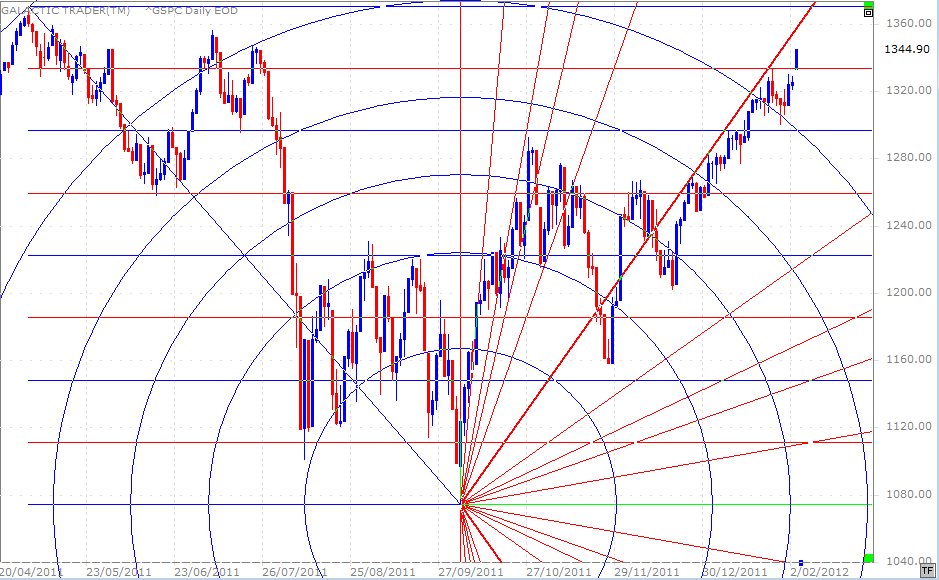
We might as well begin by taking another look at the Gann indicators chart I've used for the past couple of weeks. Obstinate bugger that I am, I'm going to show the actual figures at the time for Friday's Opening price, rather than the later "official" version.
And the reason I do so is because it shows exactly how the computers are tweaked to gap above key Resistance levels when the masters want to run the stops so unethically supplied to them by the NYSE. Blah, blah, yada, yada. No point in dwelling on this, nor in getting ticked-off.
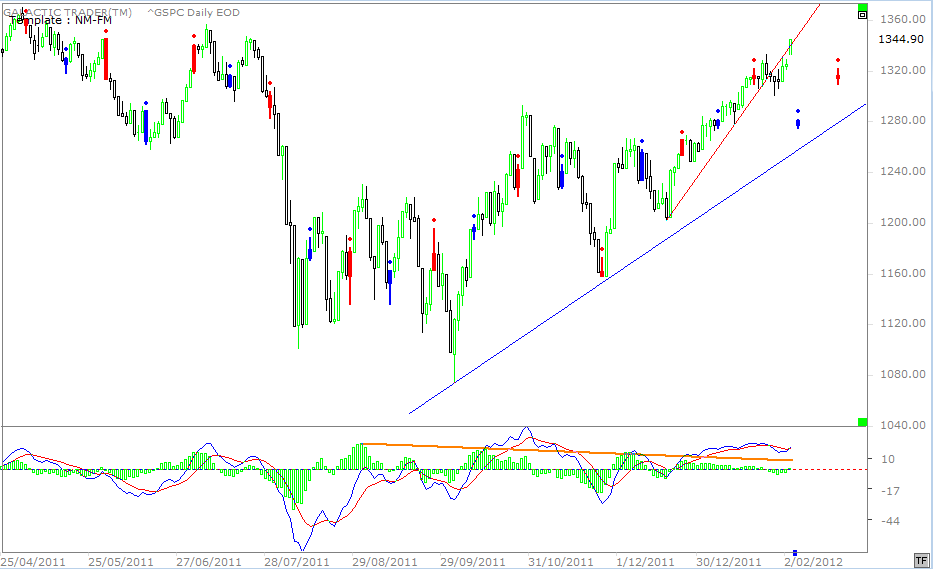
There comes a time and place when all Ponzi schemes collapse, just as this one will. Our job is to try to determine the when and where. And, as I've mentioned, the oscillators have been giving clear signals that the "when" is not now. While the chart above shows Pollyanna trying to stay in contact with the primary Gann angle off the October low, the New Moon/Full Moon chart below shows the same purely in terms of hand-drawn trendlines.
There comes a time and place when all Ponzi schemes collapse, just as this one will. Our job is to try to determine the when and where. And, as I've mentioned, the oscillators have been giving clear signals that the "when" is not now. While the chart above shows Pollyanna trying to stay in contact with the primary Gann angle off the October low, the New Moon/Full Moon chart below shows the same purely in terms of hand-drawn trendlines.
Friday's rocket booster catapulted the price back onto the exhaustion-run angle. Let me reiterate another point I've made recently - that the daily bars are not of the same wide-range nature they were during the early rally legs from the October bottom ... and that this slower-grind rally can be maintained for a lot longer than might reasonably be expected.
What we want to try to work out is exactly how long and how far. Well, boring-boring-boring, I've been saying since last August ... late February to early March was a distinctly possible, if not outright probable, timeframe.
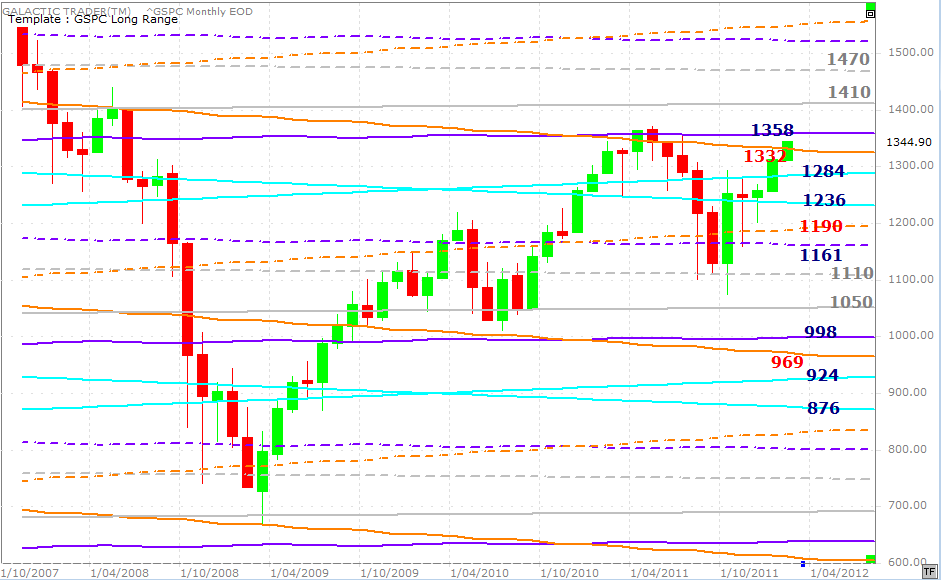
Now, I actually need to talk for a moment about Elliott Wave theory - which I know, I know, I deliberately caution you against getting caught up in!
I'll keep it simple. On the monthly chart above you see:
* 1 rally wave out of the Bear bottom into early 2010
* 2 corrective wave down into the middle of that year
* 3 rally wave up into the 1370 high of 2011
* 4 corrective wave down into the August/October spikes.
And currently, another fast rally towards last year's highs. Now, IF 1, 2 and 3 are an ABC, this rally leg should NOT break last year's highs. There are a few supposedly cast iron rules in E-Dubya ... Wave 4 cannot reach back into Wave 1 and Wave 2 cannot break the starting point of Wave 1.
What we have here is: Wave 4 (the August/October spike lows) has penetrated well inside Wave 1 (the first rally peak in early 2010).
So that should mean it was a completed ABC and NOT a whole new Bull run. And since that interpretation would make the current rally a Wave 2 rebound, it means it should fail BELOW a price of 1370.
However, just supposing it IS a new Bull run. That means it would have to display 5 waves ... 1 up, 2 down, 3 up, 4 down, 5 up. And the current rally would be Wave 5. Another EW hard-and-fast rule is that Wave 3 cannot be the shortest wave. So, since the rally from 2009 to 2010 was longer than the rally from July, 2010 to May, 2011 ... it means the current rally leg MUST be shorter than that middle rally leg.
Which means the absolute maximum price this rally can reach is about 1430. Now, there is another alternative. GeeZeus. With E-Dubya there always is! However, is so mind-numbingly optimistic not even an unaspected 5th House Sagittarian Sun can believe it!
So, let's go back to the long-range planetary chart above. The 1470 marker is out of bounds. The 1410, if it is reached, tells us something else. The next large-scale downleg will NOT breach 666.
In the meantime, price is now within two long-range planetary barriers which have provided formidable resistance over a very long time. Last year, Pollyanna spent 6 months bouncing up and down against this barrier.
FTSE 100
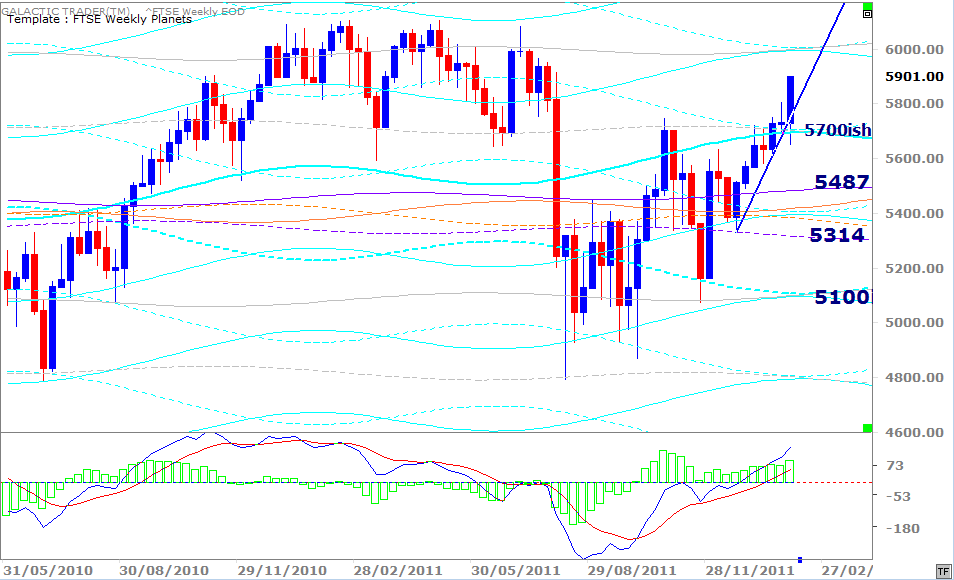
Quick look at the FTSE Weekly Planets chart. On a closing basis, the 5700 area held and the too far/too fast exhaustion angle continues to hold. Again I stress ... no major disagreement from the oscillator!
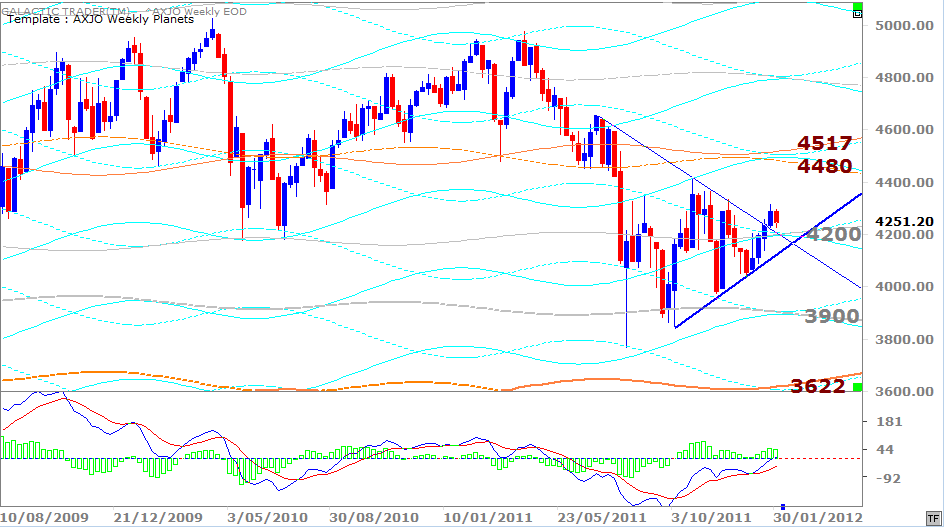
ASX200
ASX200
Auntie - the ASX200 - recorded a red, inside week, literally going nowhere. Again, no warning at all from the fast MACD that a death dive is imminent.
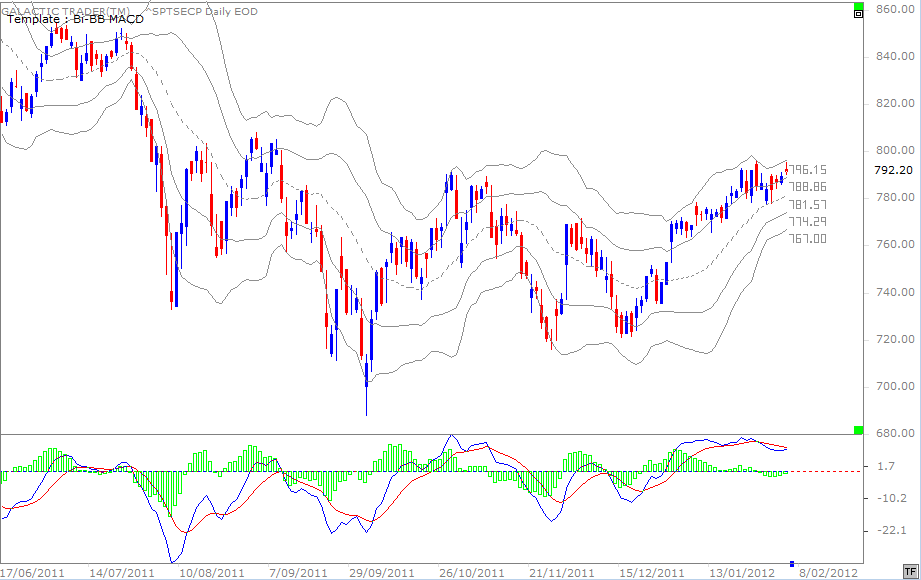
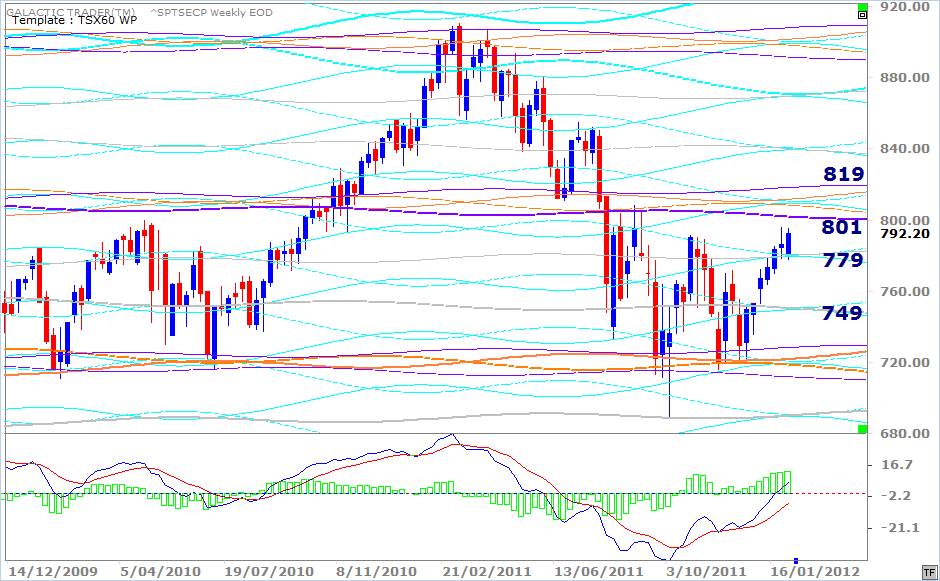
Let's take a quick look at the capped TSX60, the Canadian market.
Let's take a quick look at the capped TSX60, the Canadian market.
I indicated last week this index was ringing a lot of alarm bells on its daily chart. You can find last weekend's edition under the Archives 2012 button. Those alarm bells haven't exactly gone mute.
The Bi-BB template and its uses are explained in The Technical Section of the book and might be worth reviewing since the past week's behaviour of the TSX60 shows just what a valuable tool it is.
Even so, this is getting iffier by the day.
The Bi-BB template and its uses are explained in The Technical Section of the book and might be worth reviewing since the past week's behaviour of the TSX60 shows just what a valuable tool it is.
Even so, this is getting iffier by the day.
However, there's no sign of the weakness in the oscillator on the TSX Weekly Planets chart, though there's a whole heap of Old Gods to overcome not far north of the current price levels.
And now for The Spooky Stuff.
The coming week brings the Full Moon ... a Venus sign shift into aggressive Aries ... and Saturn, ole misery, going Retrograde. Mood shifts. Venus, you might remember, has Neptune as a protector. He rescued her from the waves as a new born and brought her to safety on the shore. So, Venus has been very happy in Pisces.
In Aries she's a bitch. First up is a face-off with Uranus. Saturn goes Rx in late Libra ... so the cosmic cop and Lord of Karma is under the control of Xena the Warrior Princess. Mars is Rx in Virgo ... in a picky, snitchy mood when it comes to anything even vaguely like book cooking.
Somehow, I don't think the Masters of the Universe and their tame computer geeks are going to be a match for one Old Goddess in war mode.
Safe trading - RA
(Disclaimer: This article is not advice or a recommendation to trade stocks; it is merely educational material.)