As goes January, so goes the year ...
Week beginning February 3, 2014
Wall Street loves its pithy little bon mots and has a cliché for every occasion.
Copyright: Randall Ashbourne - 2011-2014
As I indicated last weekend, the series of retrogrades involving Venus, Mercury and Mars is likely to cause confusion in the first few months of the year because everyone will be constantly changing direction.
So, Venus ... the money planet ... is now Direct again. Watch for changes in currency trades. I don't "do" Forex, so can't help anyone with those trades.
Later this week, the little mischief maker of the Old Gods, Mercury, goes on one of its regular retrogrades and the usual warnings apply; double-check everything you do BEFORE clicking the Buy or Sell buttons, expect data feeds to go awry and technical signals to fail, and be aware that any trend which starts around the Rx date often has a habit of reversing course halfway through the period (February 6 to 28 - New York timing).
The only other major astrological aspect still in effect is Jupiter's opposition to Pluto, which made the second of three hits last Friday.
This one, about January providing a barometer for the year ahead, has a good chance of turning out to be true.
The real question is When and at What Price the big downturn will come.
The real question is When and at What Price the big downturn will come.


Safe trading - RA
(Disclaimer: This article is not advice or a recommendation to trade stocks; it is merely educational material.)
We've chatted often about the Jupiter/Sagittarius effect, which is to exaggerate. Usually, it's the optimism; sometimes it's the fear. And we saw a lot of fear take centre stage over the past couple of weeks.
And we've also seen a ramping-up of the sort of social upheaval I talked about again in Forecast 2014, with the threat of civil wars and armed/aggressive rebellion now spreading out of the Arab zone into parts of Europe. With Mars due to go retrograde in the sign of Libra not long after Mercury goes direct again, it's all going to get a lot worse.
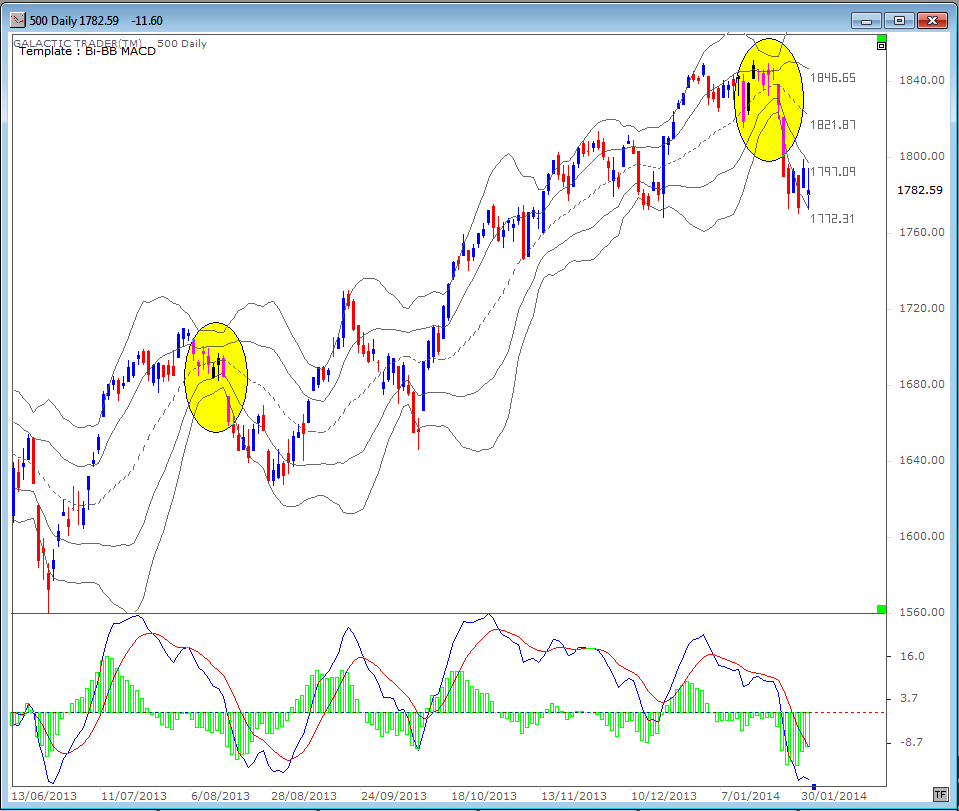
But, we're here to talk about the state of the stock markets. Let's begin with a daily Bi-BB of Pollyanna, the SP500. In The Technical Section of The Idiot & The Moon, I make a couple of points about how to use the Bi-BB charts.
One is that a breaking of the bands stalls the trend or provokes a countertrend; and the second is that tightening bands cause a sharp move and that the first move is usually in the wrong direction.
Now, last week's Polly trading is an excellent example of the first of those technical conditions in action ... and at least the first part of the second condition. That is ... the extreme tightening of the bands produced a sharp move ... which broke the downside outer band.
However, the breaking of the band then caused a stall in the (down)trend. Polly didn't go much of anywhere all week long. So, two of the significant "rules" have been met and the only one remaining is ... is the first move in the wrong direction?
And we've also seen a ramping-up of the sort of social upheaval I talked about again in Forecast 2014, with the threat of civil wars and armed/aggressive rebellion now spreading out of the Arab zone into parts of Europe. With Mars due to go retrograde in the sign of Libra not long after Mercury goes direct again, it's all going to get a lot worse.
But, we're here to talk about the state of the stock markets. Let's begin with a daily Bi-BB of Pollyanna, the SP500. In The Technical Section of The Idiot & The Moon, I make a couple of points about how to use the Bi-BB charts.
One is that a breaking of the bands stalls the trend or provokes a countertrend; and the second is that tightening bands cause a sharp move and that the first move is usually in the wrong direction.
Now, last week's Polly trading is an excellent example of the first of those technical conditions in action ... and at least the first part of the second condition. That is ... the extreme tightening of the bands produced a sharp move ... which broke the downside outer band.
However, the breaking of the band then caused a stall in the (down)trend. Polly didn't go much of anywhere all week long. So, two of the significant "rules" have been met and the only one remaining is ... is the first move in the wrong direction?
It could take a few days to answer that. The fast MACD went into a swan dive after recording negative divergence and even though the state of the histogram is improving, this level of dive usually takes a while to unwind ... as we can see from the earlier instance I marked with a yellow oval.
And the drop stopped at an "obvious" level ... one of Pollyanna's long-range Neptune price lines. We can see this line put up some Resistance to the rally last October and then became important Support in early December. And here we are again.
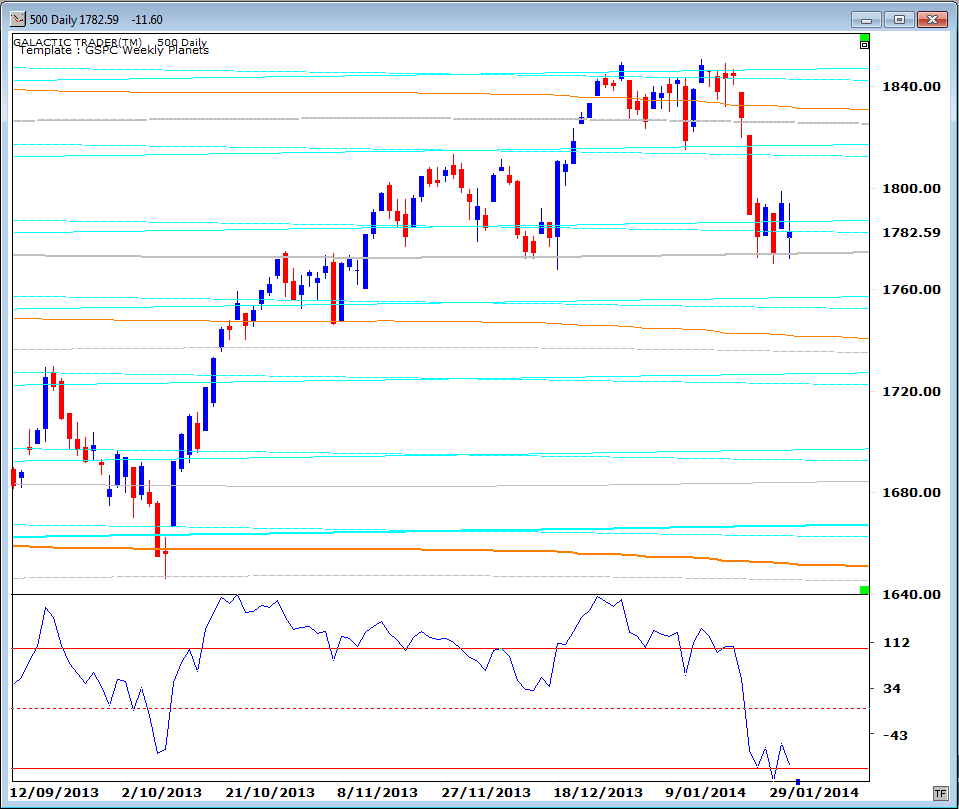
What is different now, however, is VERY different. Big Bird has dropped off his perch and is squawking horribly. These are Polly's Weekly Planets lines, but with daily price bars. If she holds the line you can calculate the upside Resistance levels; if it fails, the 1750s will probably be the minimum downside target for the coming week.
And the drop stopped at an "obvious" level ... one of Pollyanna's long-range Neptune price lines. We can see this line put up some Resistance to the rally last October and then became important Support in early December. And here we are again.
What is different now, however, is VERY different. Big Bird has dropped off his perch and is squawking horribly. These are Polly's Weekly Planets lines, but with daily price bars. If she holds the line you can calculate the upside Resistance levels; if it fails, the 1750s will probably be the minimum downside target for the coming week.

NEW:
Forecast 2014 is now available for sale and download.
Click the button on the right for more details.
Click the button on the right for more details.

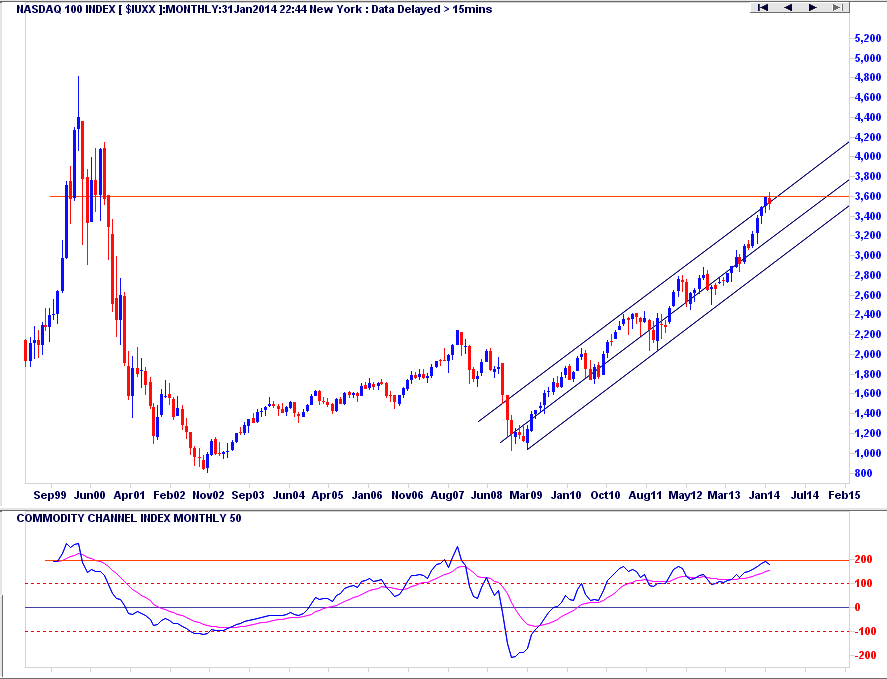
Let's put the January drop into perspective, though. The Nasdaq tech index has been on a tearaway, finally getting back into the lower end of its infamous bubble top. The new price High has been endorsed by the long-range Big Bird, which also hit a new peak in terms of the recovery rally from the 2009 Bear bottom. I want to stress that part. No negative divergence present from 2009 to 2014.
But! The current Big Bird high is lower than its peak in 2007. This is not ... yet ... a panic scenario.
But! The current Big Bird high is lower than its peak in 2007. This is not ... yet ... a panic scenario.
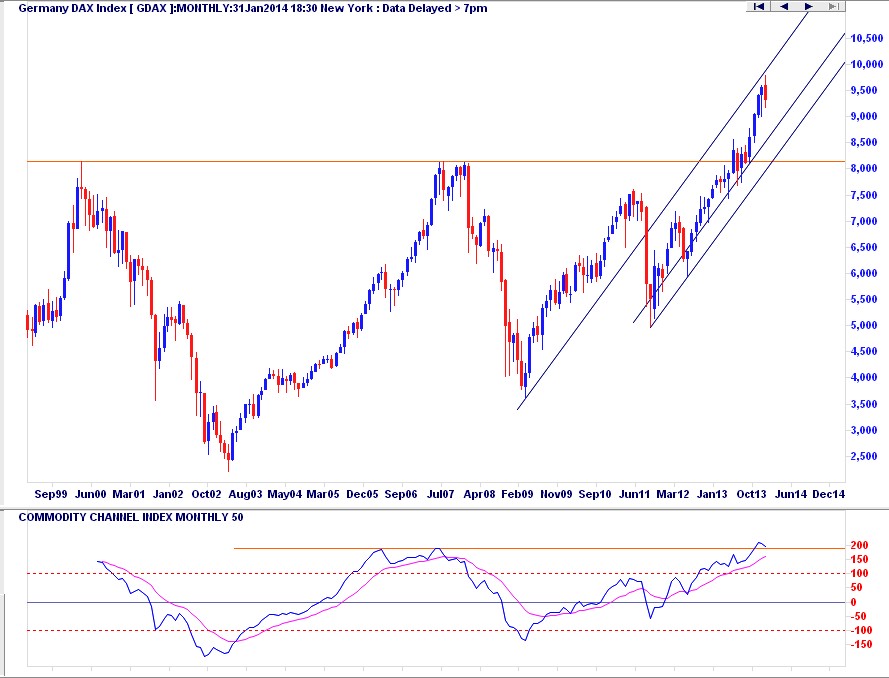
And it's ditto for the DAX, where Big Bird is in complete agreement that the record highs in the German index are legitimate.
But, unfortunately, not quite ditto for the FTSE which is in danger of triple-topping. And doing so with the first signs of negative divergence in the state of the oscillator, which peaked in May, 2013.

So, it may well be the case that the January barometer does foretell of tough times ahead for the stock markets in 2014 and it is possible it's already underway. But, we won't really know that with any real degree of certainty until we see the personality of the first major bounceback ... and with the lack of any significant divergence in Big Bird on the major indices, we can't rule out the potential for a new high in any of these indices.
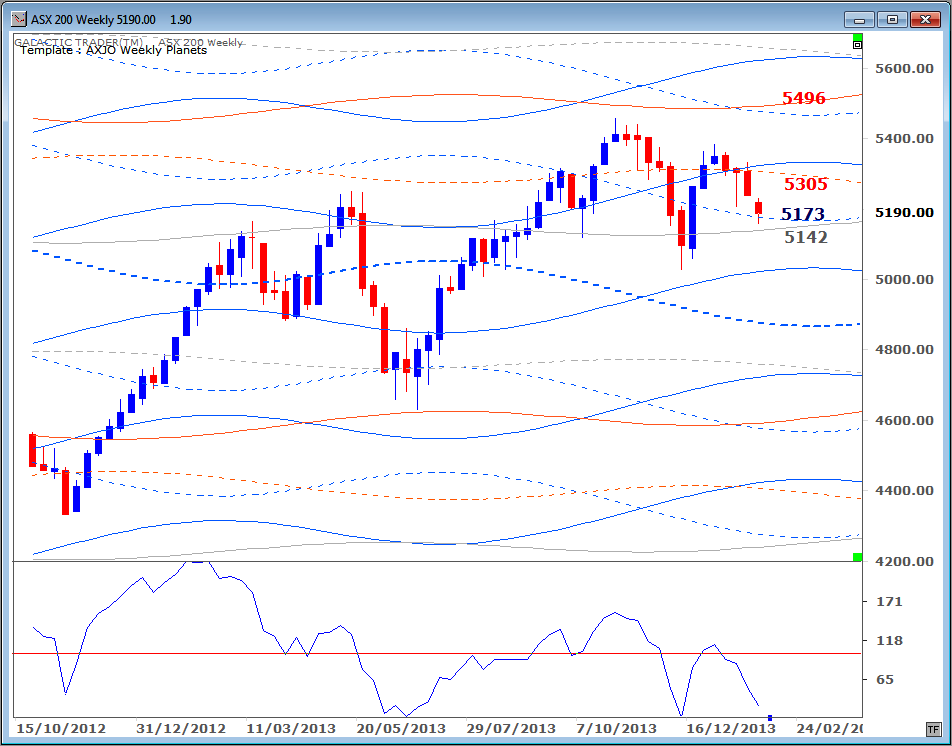
I'll leave you with a Weekly Planets chart for the ASX200. Yes, I'm playing favorites. Auntie is a Neptune index and I'm a little surprised it hasn't hit the 5142 level yet. It's certainly possible she can bounce within the Saturn zone, where she's currently getting Support at the 5173 line. Personally, I'd prefer to see a bounce from Neptune ...
I'll leave you with a Weekly Planets chart for the ASX200. Yes, I'm playing favorites. Auntie is a Neptune index and I'm a little surprised it hasn't hit the 5142 level yet. It's certainly possible she can bounce within the Saturn zone, where she's currently getting Support at the 5173 line. Personally, I'd prefer to see a bounce from Neptune ...