
Breakout or breakdown: Part II
Week beginning February 25, 2013
And now you know why I sometimes refer to the Pollyanna index, Wall Street's SP500, as a vacuous troll!

Copyright: Randall Ashbourne - 2011-2013
That's the question we'll consider this weekend ... because if that was "a false break" last Tuesday, we've only seen the first part of the storm.
Mercury goes Retrograde this weekend and stays that way until March 17. I mentioned briefly last weekend that we all need to be extra careful during Merc Rx and make sure we're pushing the buttons we actually intended to press ... and, that the "normal" mode of Mercury Retrograde, is to start a move which reverses course halfway through the period.
One of the other totally reliable signatures of Murky Wrecks is that computers do strange things and price feeds go oddly awry at the most inconvenient times.
It's usually worst on the couple of days around the Rx and Direct dates.
Last weekend, I said: "This week ... next week probably at the latest ... the vacuous troll has to make up her mind whether she's going to breakout or breakdown."
And she did both! Arghh! The one-day break above the long-range planetary lines which capped the 2000 and 2007 Bull peaks was quickly followed by Chicken Little rushing back to centre stage. Briefly. Or not?
And she did both! Arghh! The one-day break above the long-range planetary lines which capped the 2000 and 2007 Bull peaks was quickly followed by Chicken Little rushing back to centre stage. Briefly. Or not?


Safe trading - RA
(Disclaimer: This article is not advice or a recommendation to trade stocks; it is merely educational material.)
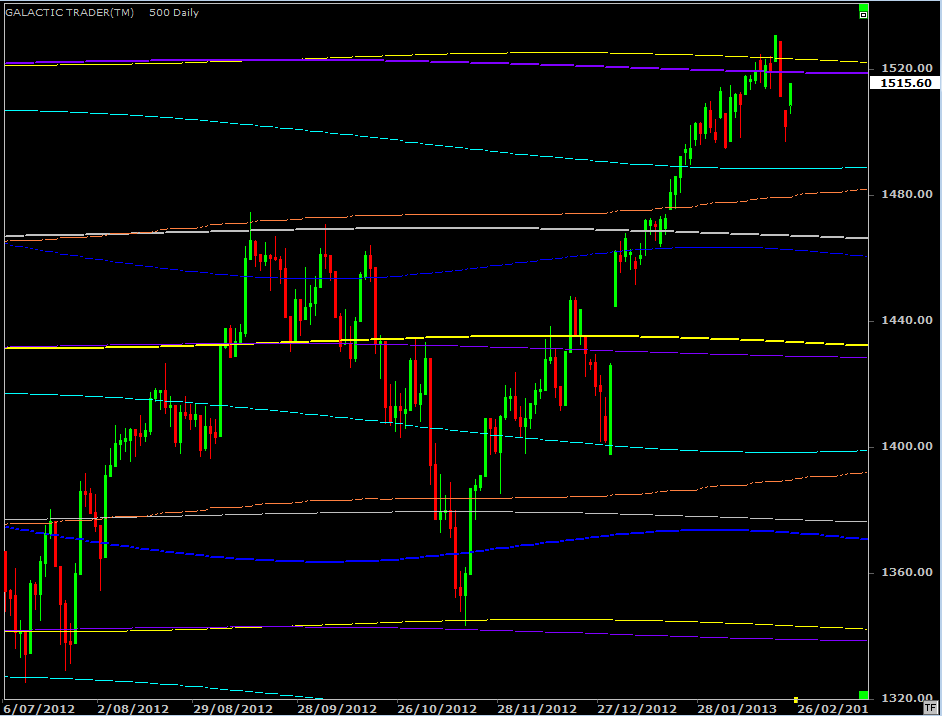
We'll start with updates of the Pollyanna and Nasdaq 100 charts I showed last weekend.
Tuesday opened with a blast above the Uranus/Pluto price barriers Miss Polly had been bumping her head against for a few days ... and it provoked a sudden reaction downwards on Wednesday and Thursday. A "false break" is when price suddenly overcomes a key barrier, regardless of whether it's a technical line, Fibonacci, or planetary, and suddenly gets scared. They have a tendency to prompt very fast, wide-range moves.
I mentioned a few weeks ago that I was going to start keeping manual charts for the SP500 because the official Open figures provided by the NYSE were too often an outright lie. If you pay even scant attention to various indices, you'll notice they all have "quirks".
The FTSE for example opens each day at exactly the price it closed the previous day. It's a joke. The TSX, ASX, DAX and NDX all use the actual figure. Anyway, on the Pollyanna chart above, I've used the real figures.
Because, the false figures from the NYSE deliberately conceal "gaps" in the price. Nature abhors a vacuum and gaps get filled! We can see it at work short-term on Friday, when the bounceback closed the gap from Thursday's Open. But there's one real Duesie of a hole waiting to be filled from early January when the big boys goosed the overnight trade to put a rocket under the Santa rally.
So, what do we do? Well, we know where the upside Resistance is and I indicated last weekend this was starting to look like a completed stage running from one Uranus/Pluto zone to another. But I didn't think then, and don't think now, that the correction is the start of The Big One. I would doubt, at this stage, that a correction would fill that gap from early January.
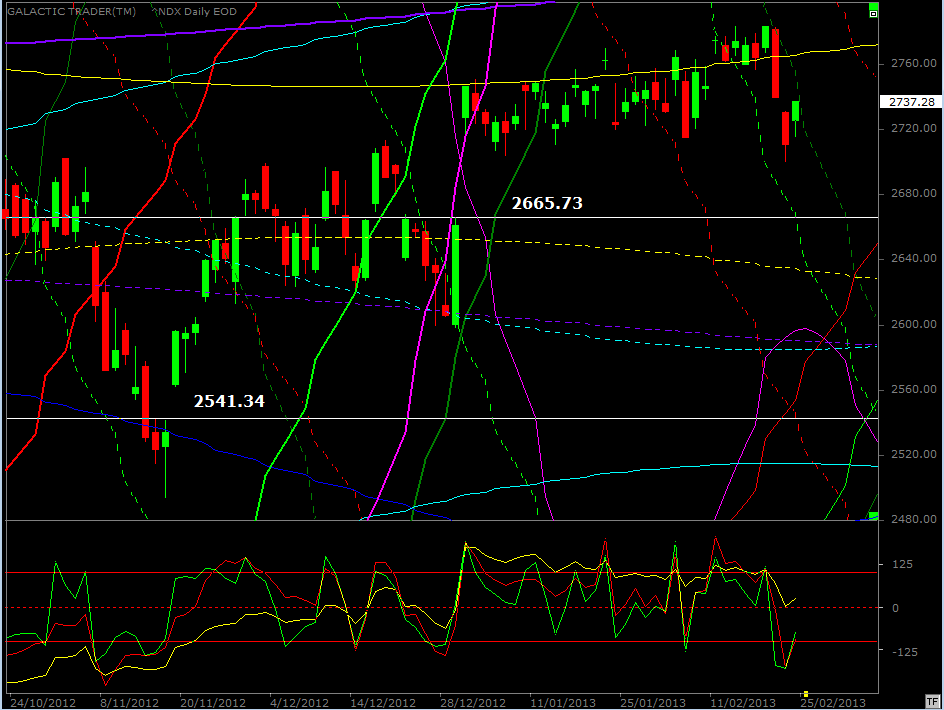
Now, let's have another look at the Nasdaq 100 ...
I mentioned a few weeks ago that I was going to start keeping manual charts for the SP500 because the official Open figures provided by the NYSE were too often an outright lie. If you pay even scant attention to various indices, you'll notice they all have "quirks".
The FTSE for example opens each day at exactly the price it closed the previous day. It's a joke. The TSX, ASX, DAX and NDX all use the actual figure. Anyway, on the Pollyanna chart above, I've used the real figures.
Because, the false figures from the NYSE deliberately conceal "gaps" in the price. Nature abhors a vacuum and gaps get filled! We can see it at work short-term on Friday, when the bounceback closed the gap from Thursday's Open. But there's one real Duesie of a hole waiting to be filled from early January when the big boys goosed the overnight trade to put a rocket under the Santa rally.
So, what do we do? Well, we know where the upside Resistance is and I indicated last weekend this was starting to look like a completed stage running from one Uranus/Pluto zone to another. But I didn't think then, and don't think now, that the correction is the start of The Big One. I would doubt, at this stage, that a correction would fill that gap from early January.
Now, let's have another look at the Nasdaq 100 ...
I thought a couple of weekends ago that the falling light green Sun line would drag the NDX down, but the decline held off until it bumped into the falling Venus line at Wednesday's Open. There are two obvious, unfilled gaps in the index. In fact, if the decline resumes this week, I'd think it's likely to run to the yellow Uranus line below the first gap.
The faster Canaries, green and red in the oscillator panel, have plunged deep enough to indicate they'll have to show an instance of positive divergence (higher troughs at lower prices) before the correction is finished. The only caveat I have is that the Big Bird, the yellow line, may be in the process of bouncing from the Zero line - and I've mentioned before that a "Zero Line Rejection" can produce a strong move (in this case it would be rally).
The faster Canaries, green and red in the oscillator panel, have plunged deep enough to indicate they'll have to show an instance of positive divergence (higher troughs at lower prices) before the correction is finished. The only caveat I have is that the Big Bird, the yellow line, may be in the process of bouncing from the Zero line - and I've mentioned before that a "Zero Line Rejection" can produce a strong move (in this case it would be rally).
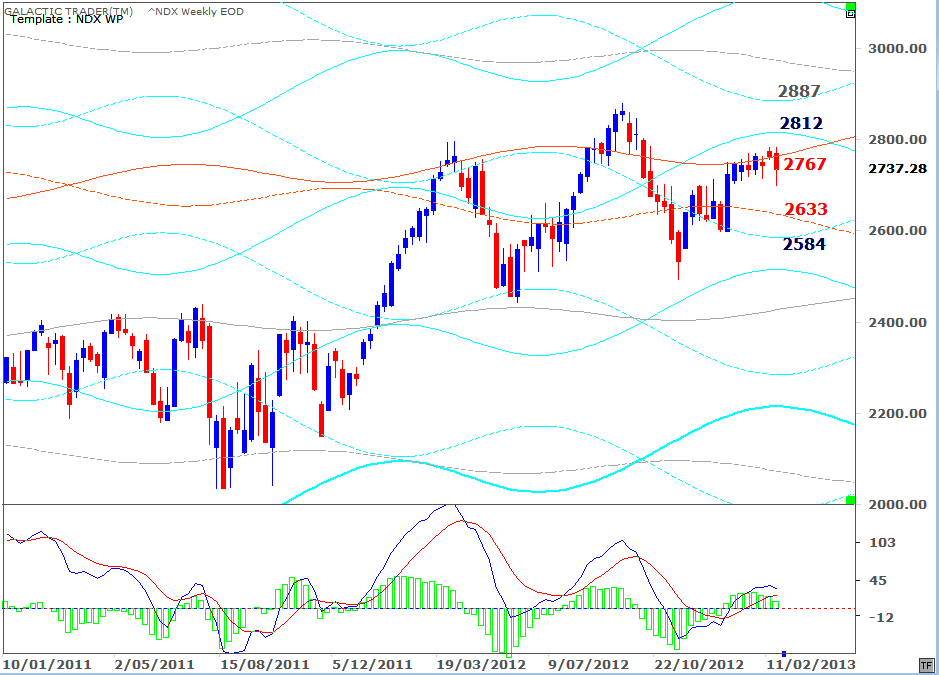
And a rally is possible if last week's action was just a plunge into the statistically negative mood of the Full Moon. Not looking so good, though, on the NDX Weekly Planets chart above. The potential head&shoulders pattern, which is decidedly negative, still seems to be in play.
Now, a lot of H&S patterns eventually don't turn out that way; they morph into something else. But, in this case we have some big time negative divergence underway in the fast MACD, now making another lower peak in both the signal lines and histograms. Remember, this is a weekly chart, so if the price pattern follows the oscillator omens, this will be more than a short, sharp correction over a couple of days.
Canada ...
Forecast 2013 is now available for sale and download.
Click the button on the right for more details.
Click the button on the right for more details.

NEW:

Forecast 2013 is now available for sale and download.
Click the button on the right for more details.
Click the button on the right for more details.
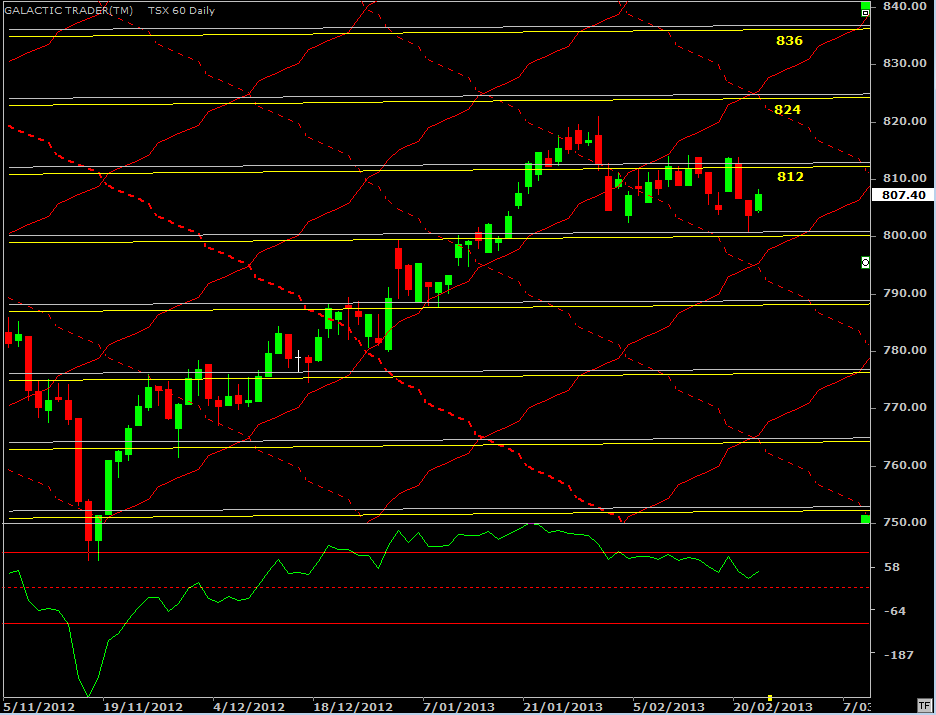
The capped version of the TSX 60 has been range-trading. I use this chart for those of you wanting to try your own version. The red lines, of course, are Mars ... and most of the regular Canadian readers will know Mars is the "driver" of markets. The grey and yellow horizontals are Neptune and Uranus.
The index has a distinct tendency to travel along Martian channels between Neptune/Uranus stop-offs. Anyway, the effect is easy to see and this is a chart you can replicate relatively closely without shelling out for expensive planetary software ... just set the horizontal S/R lines at 12-Loony intervals.
London ...
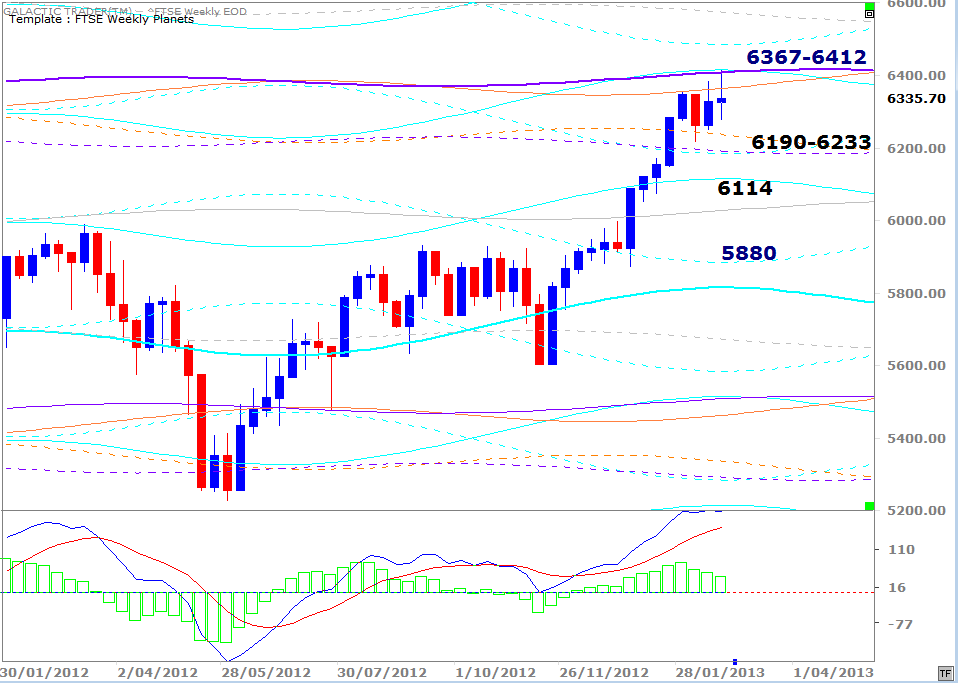
The FTSE last week made a precise touch on the high side of the Weekly Planets targets and immediately backed off. No surprise there, eh? Despite the stalling, I wouldn't bet on London having reached The High just yet, even if it corrects further before launching a new rally. There's hardly a whisper of warning from the fast MACD.
Mumbai ...
Mumbai ...

India's Nifty didn't quite make it to the overhead Saturn - and that seems to be a repeat of what happened with the index in February last year, when it broke above a Uranus barrier for one week and then went into decline. It seems to be repeating the pattern with the Neptune line at 6027. There's a primary Saturn line at 5813 and it could be useful to closely monitor how the oscillators behave if it declines to that level.
Just as a technical reminder, note the negative divergence peaks in the Big Bird, which recorded lower peaks as the price was making higher ones.
And finally, for this week, a look at Auntie, the ASX 200 ...
Just as a technical reminder, note the negative divergence peaks in the Big Bird, which recorded lower peaks as the price was making higher ones.
And finally, for this week, a look at Auntie, the ASX 200 ...
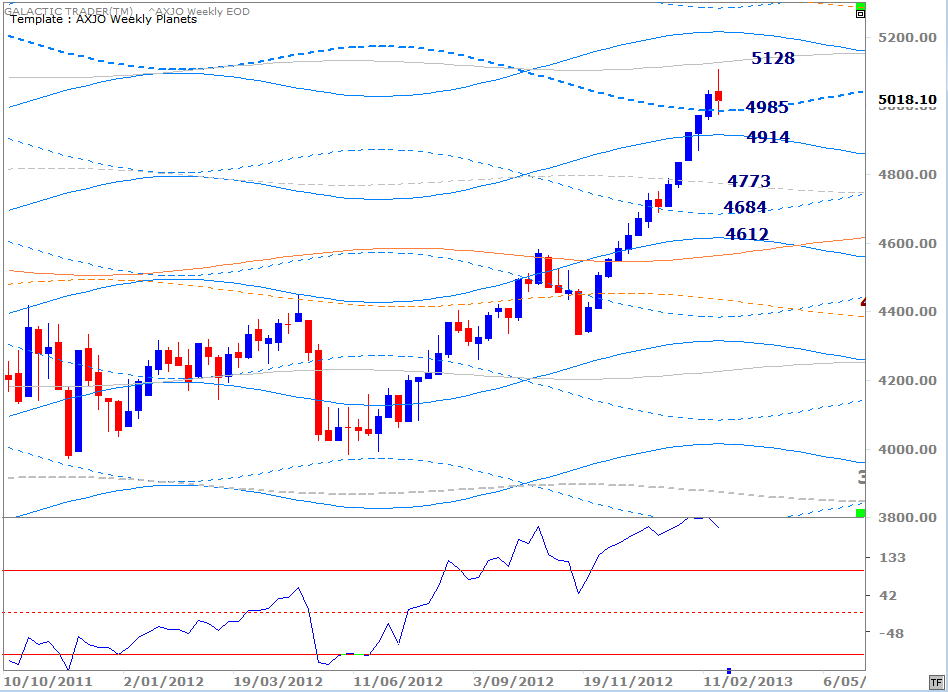
Showing this chart last weekend, I said: "While Wall Street is back close to its old Bull peaks, the ASX 200 made its own milestone last week - closing above the 50% recovery barrier for the first time since the bottom of the Bear plunge in 2009.
And there appears to be more room to run ... I'd thought that primary Saturn line at 4985 would provide stronger Resistance; it'll be interesting to see if it converts to Support during the next correction."
Well, we got the more room to run ... and then primary Saturn converted to Support. Ahem! IF the correction is finished.
From an "eyeball" viewpoint, it looks as if this is probably going to be a correction of the same order as the four-week pullback last October/November. If that's so, it'll be followed by a further, strong rally ... and that's when we'd start looking for signs of a Canary croaking. At the moment, it's still in fine voice with a sweet song.
One item of housekeeping before I wander off ... there's now a dedicated Archives section for this year's old stuff. Red button under the Eye!