More on Bi-BB trading rules ... and gold
Week beginning February 17, 2014
Less than 8 weeks ago, most of the stock market "experts" were predicting another rip-roaring year ahead.
Copyright: Randall Ashbourne - 2011-2014
As I've been saying ... the series of retrogrades involving Venus, Mercury and Mars is likely to cause confusion early in 2014.
American markets will be closed on Monday and we need to be aware that traders will return from the long weekend with a potential rethink.
Monday is the midpoint of the current Mercury Retrograde phase and there is at least some danger that trends which began at the start of the phase will go into reverse halfway through the cycle.
Unusually, stocks and gold prices have been running strongly in the same direction.
But the same mechanism we began discussing a couple of weekends ago to look for a potential turn in stocks, is now giving signals that gold's rise is nearing a "breather" stage.
Then, along came January and they were falling over each other to lament the start of "the big one".
And on Friday, the Nasdaq 100 hit new highs and the SP500 was in gushing Pollyanna mode, finishing the week only a half per cent away from its all-time high in mid-January.
And on Friday, the Nasdaq 100 hit new highs and the SP500 was in gushing Pollyanna mode, finishing the week only a half per cent away from its all-time high in mid-January.


Safe trading - RA
(Disclaimer: This article is not advice or a recommendation to trade stocks; it is merely educational material.)
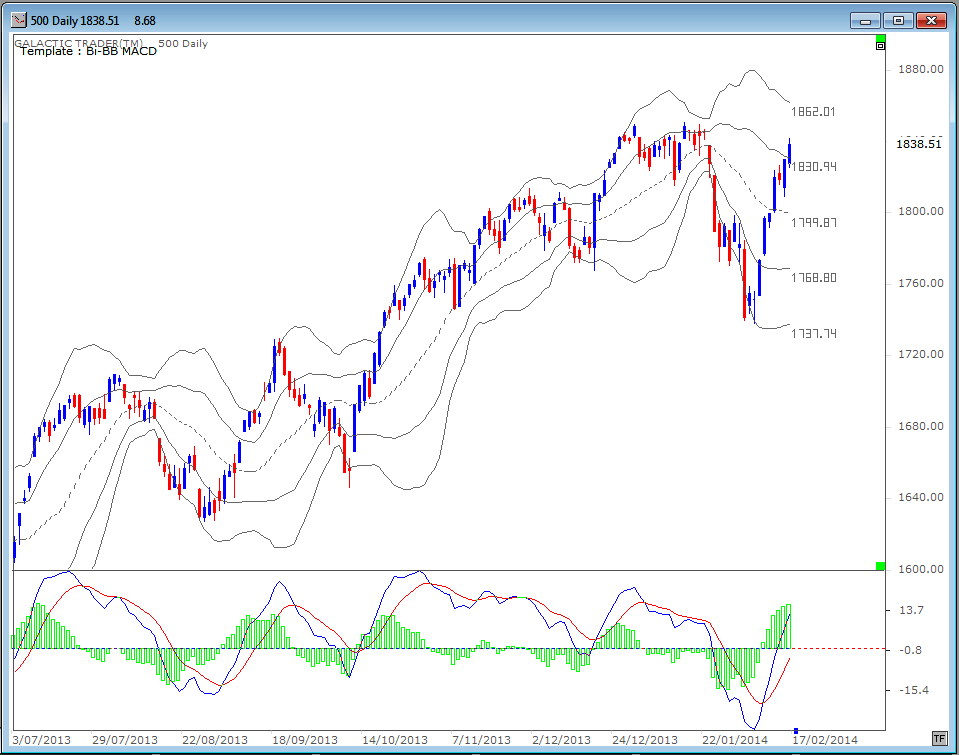
Let's begin, though, with Pollyanna. We've been using the past few weeks as a real-time example of how to use the Bi-BBs when they show a particular pattern.
To reiterate:
1. Tightening bands warn of a very fast move
2. A break of the outer bands stalls the move or forces a countertrend
3. The first move is usually in the wrong direction
So, let's take a look at where we currently stand in relation to those signals. The extreme tightening provoked the fast move down and the breaking of the outside bands first caused a stall and the second break launched a strong countertrend ... indicating that the first move was in the "wrong" direction.
Now, if it were not for the astrological expectation that the midpoint of the Mercury Rx phase can reverse the trend in play, I'd tend to lean here towards Pollyanna gushing to new highs.
We do have a rule that astrological expectations do not over-ride technical conditions. The significance of that is the new, higher peaks in the MACD histogram strongly suggest this isn't going into a sudden reversal.
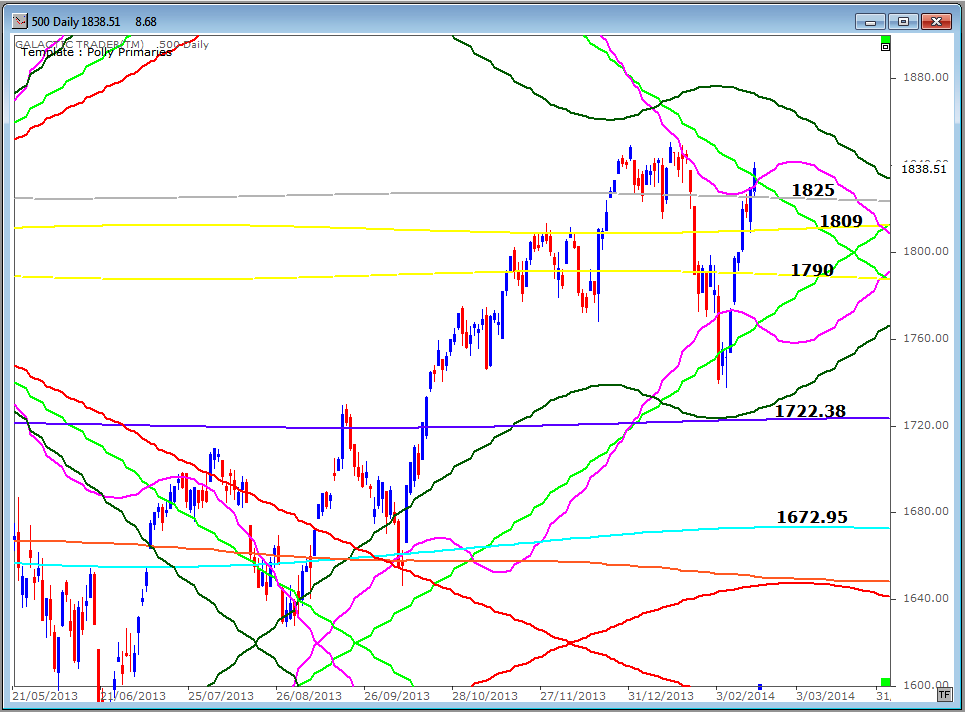
But, the index is hitting planetary resistance. As we discussed last weekend, the 500 is within a price zone where uptrending and downtrending primary planet lines intersect. If the rally continues when traders return on Tuesday, the maximum price likely to be reached in the week ahead is around the 1860s.
A reversal would probably take the index back to the 1760s over the next couple of weeks.
We do have a rule that astrological expectations do not over-ride technical conditions. The significance of that is the new, higher peaks in the MACD histogram strongly suggest this isn't going into a sudden reversal.
But, the index is hitting planetary resistance. As we discussed last weekend, the 500 is within a price zone where uptrending and downtrending primary planet lines intersect. If the rally continues when traders return on Tuesday, the maximum price likely to be reached in the week ahead is around the 1860s.
A reversal would probably take the index back to the 1760s over the next couple of weeks.

NEW:
Forecast 2014 is now available for sale and download.
Click the button on the right for more details.
Click the button on the right for more details.

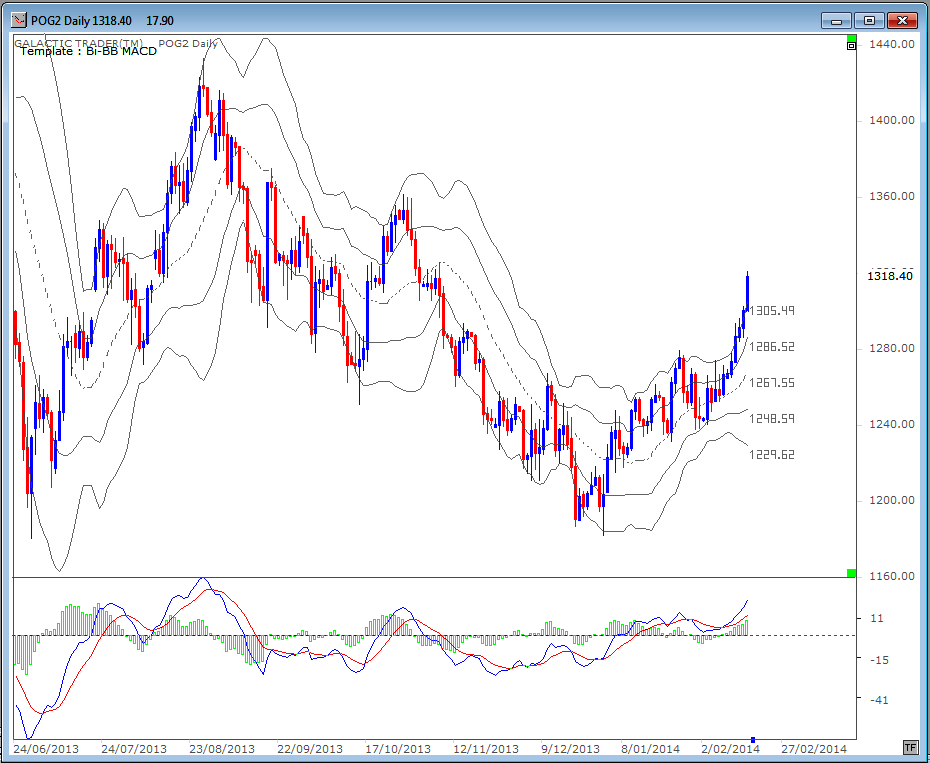
Gold is now showing some sparkle, indicating it is possible that the correction ended with the double-bottom recorded in late December.
But, is it too much, too fast? If the "normal" rules of Bi-BB trading hold true, then yes. The upside outer band has been broken decisively ... so there's a strong chance that price will stall, or change direction.
The last minor break of the upside band, on January 26, provoked a 5-day pullback.
But, is it too much, too fast? If the "normal" rules of Bi-BB trading hold true, then yes. The upside outer band has been broken decisively ... so there's a strong chance that price will stall, or change direction.
The last minor break of the upside band, on January 26, provoked a 5-day pullback.
However, we are now getting strong signals that gold may well be in the early stages of a new Bull leg which will, eventually, take out the old highs.
We last looked at gold in any depth in the January 20 edition, which you can access in the Archives. At the time I indicated I'd prepare a special report on gold. I've been waiting for this sort of move to occur. I'll wait a little longer to see the reaction to make sure that report is as useful as it can be.
However, the potential for future profits in gold itself, and the miners, is starting to look very good. Two things to take special note of in the Sun-Pluto chart below ...
Firstly, our Big Bird oscillator couldn't be happier. The canary is trilling like a lark. And secondly, price has escaped the barrier of a downtrending heliocentric Sun line which put a stop to all attempted breakouts from October 2012 to March 2013.
Everything is looking good - for the intermediate to long-range future. But, we need to see this Sun line breakout tested and confirmed before we can be certain that the final low in gold's correction has been cemented in place.
We're only halfway through the Mercury Retrograde phase ... and a few days after he goes Direct again, Mars goes into a long Rx cycle.
We're only halfway through the Mercury Retrograde phase ... and a few days after he goes Direct again, Mars goes into a long Rx cycle.