


A central bank hold on the countdown
Week beginning December 5, 2011
The co-ordinated intervention in world money markets sparked a fast and sudden rebound in stocks last week.
I'd indicated a first degree rally was likely - the first of probably only two rallies left before stock markets worldwide started the real crash.
I'd indicated a first degree rally was likely - the first of probably only two rallies left before stock markets worldwide started the real crash.


Warm regards .. and Safe trading - RA
(Disclaimer: This article is not advice or a recommendation to trade stocks; it is merely educational material.)
Copyright: Randall Ashbourne - 2011
We will review that forecast this weekend, as well as putting the potential, rather than probable, Bull market scenario back on the agenda.
The intervention is designed to save banks - not economies. In many ways we are seeing a repeat of the themes which surfaced in 2007-2008. The big banks have done stupid things and made bad investments - and want their bad debts socialised, while capitalising and keeping their "profits".
The "Arab Spring" is not a phenomenon isolated to particular cultures, but rather one theme running from a cyclical astrological aspect when Uranus and Pluto are in hard angles to each other. It is, in a nutshell, revolution against the plutocracy that is the theme - and it doesn't really much matter if the plutocrats dress up like Lawrence of Arabia or like Wall Street bankers.
One way, or another, they're goin' down! All of them! However, for the moment, Presidents, Prime Ministers, Treasurers and central bankers are falling over themselves trying to keep the "system" intact ... and our aim is to stay on the right side of the system.
There's a chance the final two rallies I expected to occur are morphing into one ... and also a chance that the intervention could underpin an even longer, more Bullish phase than should naturally occur before "the crash".
Yes, I do still expect there will be a 2012 crash.
We haven't taken a close look at the Spooky Stuff since around mid-October, so before we begin looking at the technical conditions, I'll open the flaps of the fortune teller's tent, polish up the crystal ball, ooze up to the oracles, gut a goat ... you know, the usual stuff.
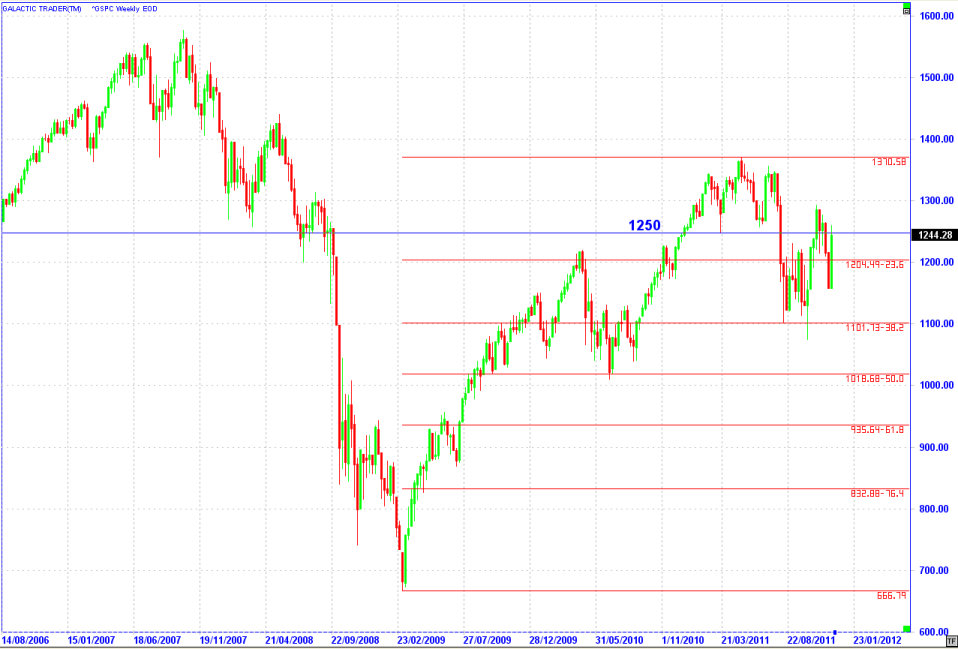
We also discussed many, many weeks ago the importance of how the SP500 reacted as it hit 1250, the level of the last low before the high.
The first break of the level shot price through the barrier and after falling away, price returned there for another test last week.
The first break of the level shot price through the barrier and after falling away, price returned there for another test last week.
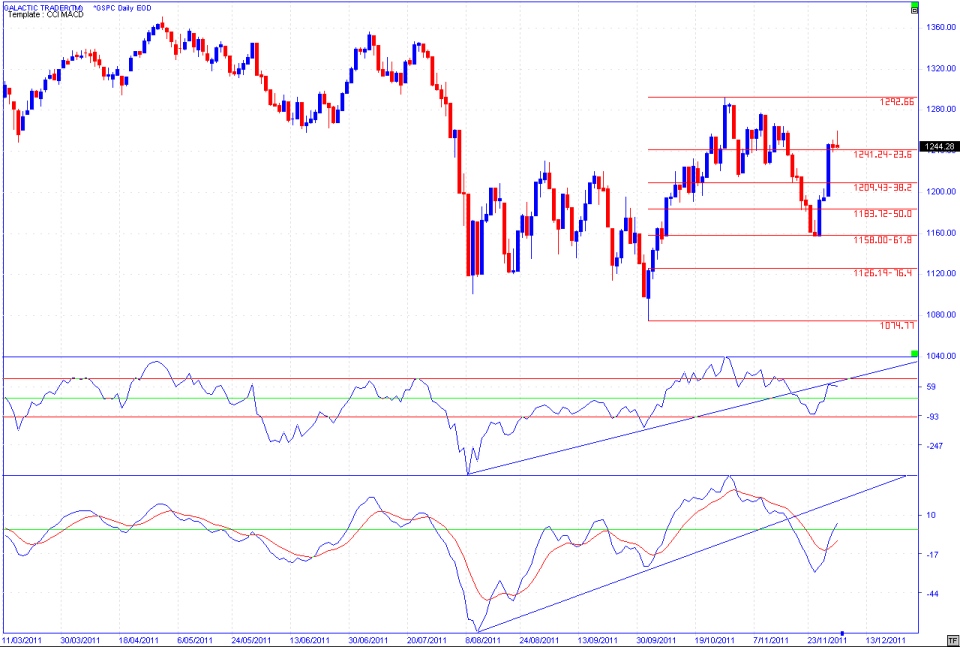
Turning now to Pollyanna's daily chart, we can see the index has played a standard Fibonacci game ... declining to the 618 level and rebounding to the 236 level. If you check the chart from last weekend's edition, you'll see that while the MACD was still plunging deeply, the Canary had started to flatline.
Those of you who've read The Idiot & The Moon know why I call this oscillator a Canary and am a strong advocate of its use; it is far more responsive than any other, especially in terms of early-warning signals.
I've left the oscillator trendlines intact. Well, y'all know I use the same charts over and over and over again - and NOT from laziness!
Even though the MACD remains strong, with the first signal line peeking above the Zero line, the Canary is turning ambivalent again - and doing it at the underside of the trendline.
So ... that midway Mercury turnaround MIGHT be coming into play.
Let's look at a couple of the Old Gods charts ... first the weekly and then the long-range.
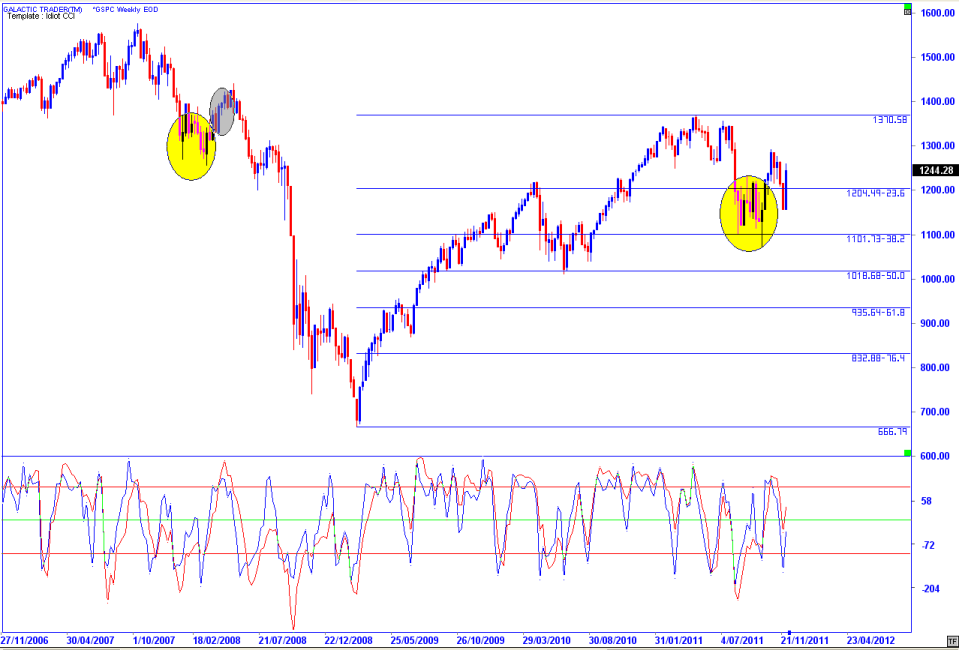
Now, I really don't give a rat's if you're bored looking at this chart. But, just to keep your brain perked, I added another colored oval.
We've discussed many times now the repeating theme outlined by the yellow ovals. It's also possible the last two current bars are the equivalent of those first couple of bars inside the grey oval I've added to early 2008 ... meaning, we could still be facing several weeks of rally before it all falls over.
We've discussed many times now the repeating theme outlined by the yellow ovals. It's also possible the last two current bars are the equivalent of those first couple of bars inside the grey oval I've added to early 2008 ... meaning, we could still be facing several weeks of rally before it all falls over.
Last weekend, I had been expecting the first of two final rallies - a small, first-degree affair before the index went back down to test if not the August/October lows, then probably at least the 1138.
However, the central banks' intervention turned Polly north from a standard Fibonacci level, rather than one of the Old Gods. The rise was halted by one of the Old Gods - midway within the 1240/1280 Saturn levels I've mentioned frequently in past weeks (and whose price has now altered slightly).
Also note the state of the MACD. I did warn some time ago that we needed to watch for an incidence of negative divergence - a higher price accompanied by a lower MACD peak and that may well be in the process of forming.
Okay, so the central bankers thwarted an Old Gods weekly target ... but can they manipulate the markets enough to ride through the long-range barriers?
Firstly, I made a brief mention last weekend that Mercury is currently Retrograde. Meaning, that when we look at it from Earth, it appears to be going backwards.
I don't put much stock in Mercury Rx. However, sometimes, markets start a move in one direction when Merc goes Rx and then change direction halfway through ... which would be during the coming week.
There's another potential trend change in the following week when Uranus, the ruler of stock markets, goes Direct at the same time as a lunar eclipse Full Moon.
Venus has a brawl with Saturn on December 19. Not much of a brawl, because they're both in mutual reception, which means they have to play politely.
A more significant trend change is due at the end of the month, when Jupiter goes Direct and the Sun shines its light on Pluto, bringing the debt/plutocracy issues to a head again.
The Jupiter change is significant because it is in early degrees of Taurus - which, statistically, tends to see the end of Bull markets.
I've mentioned a number of times the potential for this final rally phase to run out to late February or early March - and that's because of Jupiter travelling in early degrees of Taurus ... incidentally (or not), the sign of the Bull.
Okay, so what we have in December are a couple of the major planets changing direction ... Jupiter symbolises growth and expansion and Uranus rules the stock markets. I think I made the point some time ago when discussing the Spooky Stuff that one of the reasons there is a chance for a final, exhaustion-style of rally is that there's a distinct lack of negative Saturn aspects in play during this period of Jupiter in Bull drag, something the FatBoy did often when trying to seduce the babes of his day.
Now, enough of the mystical mumbo-jumbo and time to turn our attention to the technical voodoo.
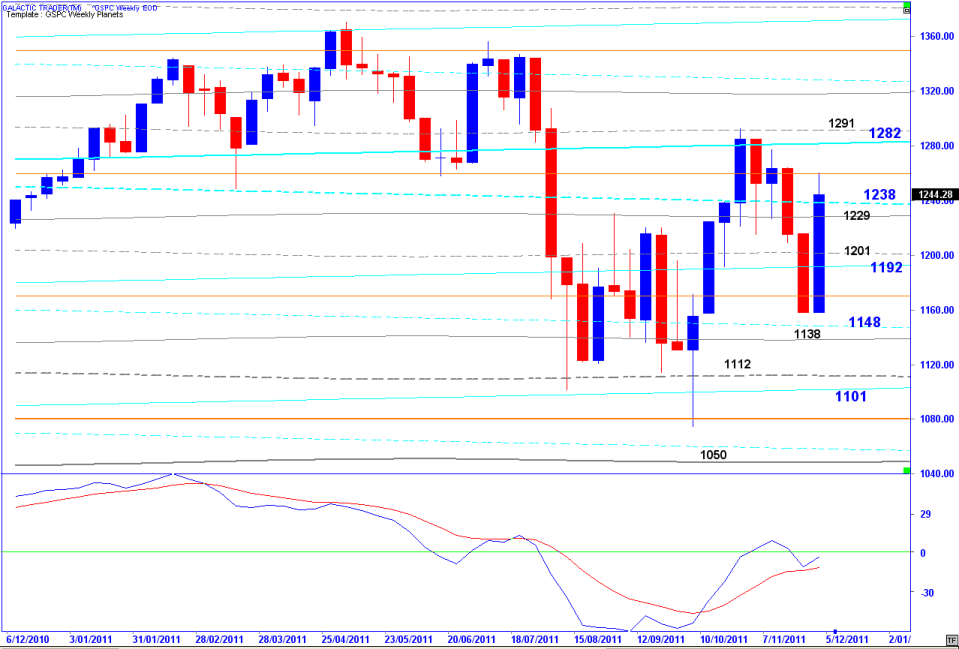
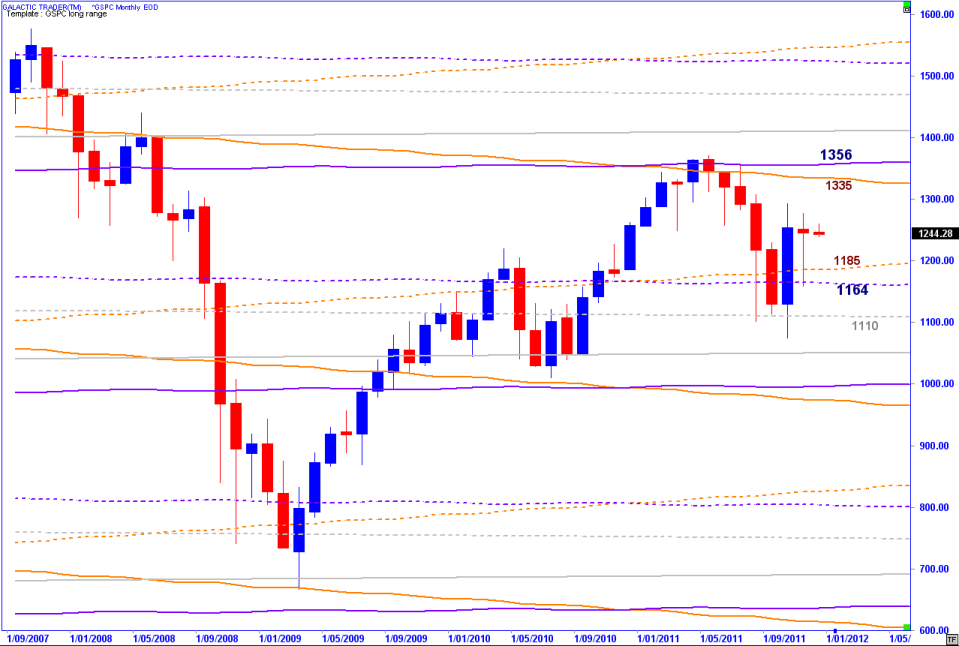
Above is the SP500's long-range Old Gods chart, which helps give us some idea of the potential range of the December price bar now being formed. Remember that November/December is one of the strong, positive periods of the year ... statistically.
This year, November spun inside the October bar - and remember we were expecting that sort of strong recovery and stalling performance from our analysis of the yellow ovals chart. So, here we are trying to work out what comes next ... a new high (hopefully with a negative divergence signal from our favorite, tweaked oscillators) or another downside test - just to keep us all perplexed about what the buggers are doing?
With Jupiter still within early degrees of the Bull's sign, another run to challenge the long-range markers is certainly possible. At least we know what the stalling target will be if that's what comes about.
But, enough of Pollyanna ... and onto the ASX200.
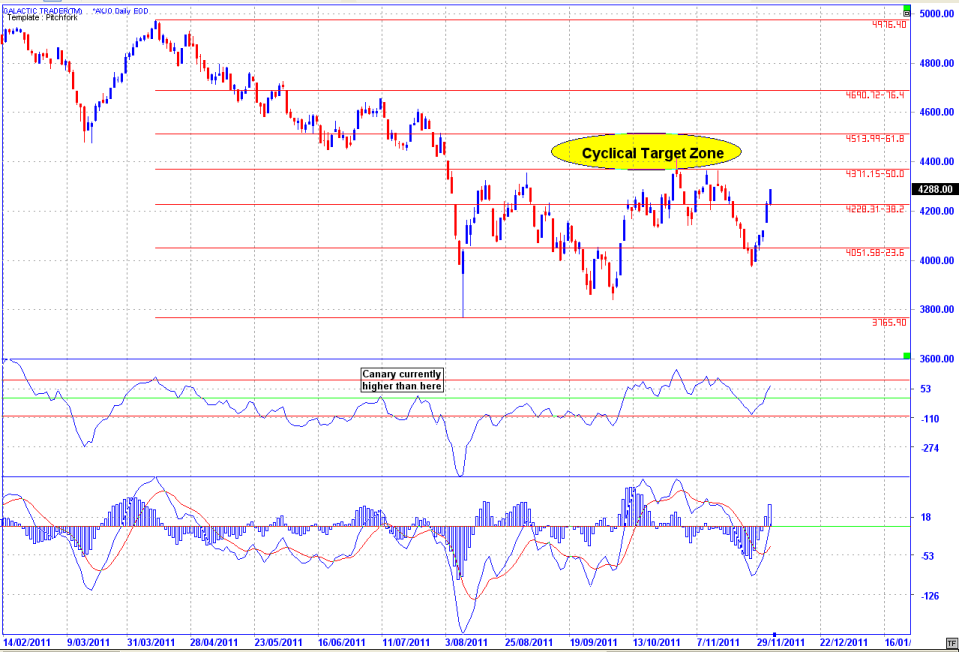
And we'll begin by returning to another old chart where I marked out a probable target zone for the cyclical rally I said would follow the August spike down.
The last time we looked at this chart, Auntie was poking her head inside that zone and I pointed out that the then state of the Canary was higher than it was midway through the year when Price was still up in the 4600s ... the interpretation being that "the zone" remained a legitimate final target before the predicted crash would get underway.
And the old bat is having another run at breaking into it, which might lend some credence to a tilt at the early 1300s by her Yanquis cousin, Miss Pollyanna.
What is particularly relevant on that chart, especially to anyone holding Short positions on the ASX, is the Canary's performance since the index made the pattern of trading against a spike - which I discussed at length while it was happening in September.
From the time "the drop" started early in the year, the oscillator descended below Zero and wobbled around between Zero and the lower, red level. All that changed when the index started trading against the August spike low. It has spent most of the time since on the upper side of the Zero line ... which is why "the zone" is still The Zone.
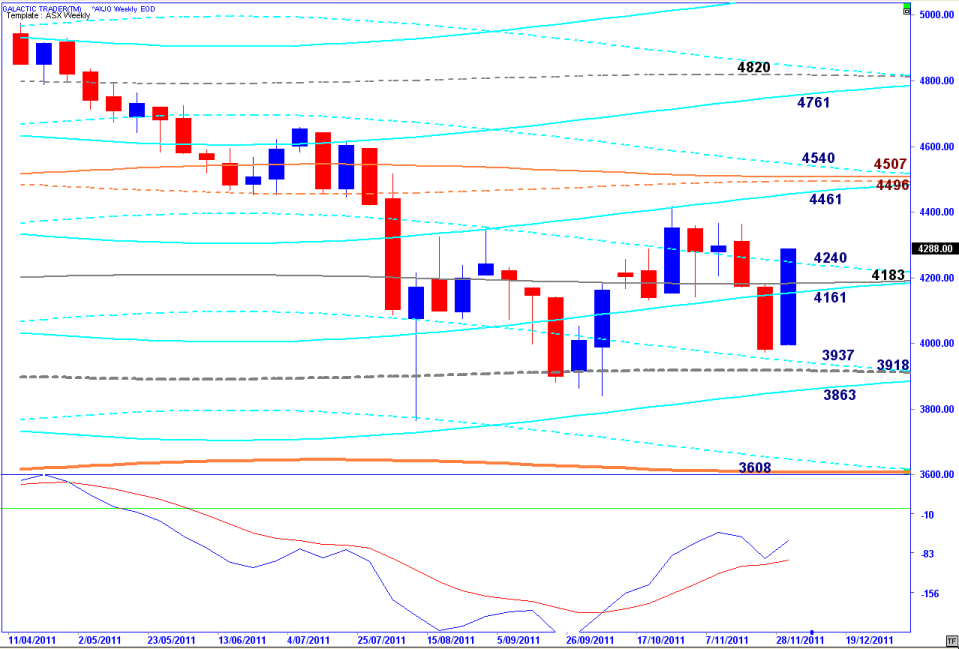
Auntie's Weekly Planets chart is above, again showing the potential for the MACD to give a negative divergence signal if Price gets back into the general area of the cyclical target zone ... and with the planetary lines giving specific targets, especially the cluster in the 4460/4540 area.
Okay, I've waffled on long enough. So, let's try joining some dots ... the Australian market, which is too small for the computers to bother with most of the time, is showing a distinct potential to finally rise back inside its expected target zone while the American market is already well back inside it.
It's not an illogical or unreasonable conclusion then, to speculate Pollyanna is going to treat us to a final, goo-goo gusher of a performance before Chicken Little kicks her offstage to play his role.
Personally, I'm unfazed and can't get excited by the manipulations. This is one turkey not going to get a Presidential pardon.