
Happy New Year ... and the Forecast
Week beginning December 31, 2012
Thank you for your company during 2012 and best wishes for a happy and prosperous New Year!

Copyright: Randall Ashbourne - 2011-2012
While the major trend change dates for the year are listed, there is a month-by-month breakdown of the key astrological transits, New Moon and Full Moon dates, and a list of critical reversal dates for each month.
I have analysed Moon Trading performance across 12 of the world's major indices, including gold, and the results are stunning. They identify which indices should NOT be traded using lunar phases, as well as identifying those markets where the normal rules need to be tweaked to maximise profits.
And I will reveal, I think for the first time anywhere, stunning planetary price charts which set the upside and downside movements in the price of gold.
There will be individual long-range price target charts for 12 indices, including the SP500, NDX, FTSE, DAX, CAC, Nifty, Hong Kong, Singapore and Shanghai ... and the ASX200 and TSX60.
Links for purchasing and downloading the Forecast will be posted next weekend.
Forecast 2013 will be available next weekend, it will be priced at $20, and for those of you prefer hard copies, there'll be no restriction on printing the document.
And the format will be different from last year.
And the format will be different from last year.


Safe trading - RA
(Disclaimer: This article is not advice or a recommendation to trade stocks; it is merely educational material.)
In the meantime ...
Well, Santa has been busy delivering bags of goodies to everyone who was nice during the year.
Except he apparently thinks some people who work in Washington are just a bit naughty. American markets waver at the edge of the fiscal cliff like lemmings in denial of their genetic imperative.
Still, the big picture is that the SP500 remains in an uptrend.
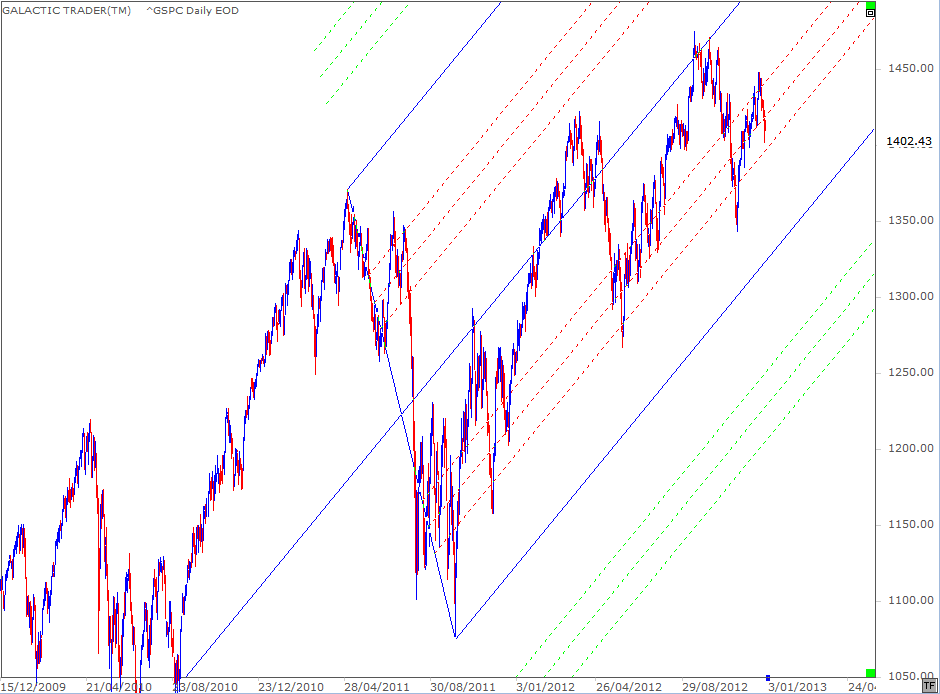
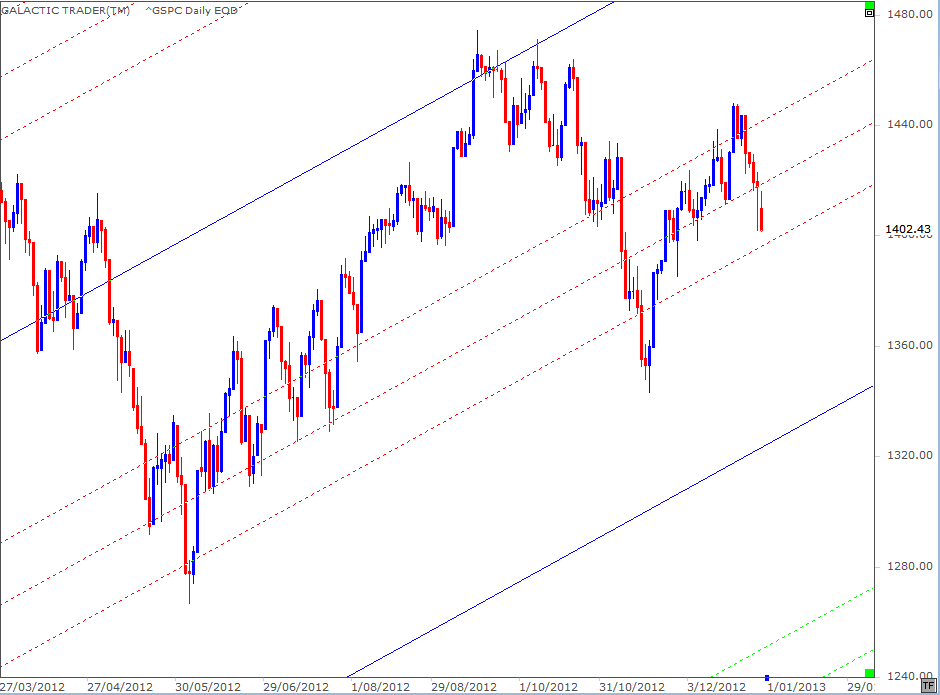
The chart above shows Pollyanna continuing to ride the internal Fibonacci lines of a rising pitchfork. And below we have a close-up.
There have been three breaks below the internal Fibonacci levels marked in red - and all of those breaks have been recovered quickly since the pitchfork was established following the May/October decline of 2011.
The 500 is approaching that layer once again, with traders unsure whether US politicians can compromise on the tax increases and spending cuts due to start taking effect in January.
While hope remains alive, there's a chance the lower red level will continue to provide support for the rally angle. If not, that job will fall to the lower tyne of the pitchfork, currently priced around 1340/1350.
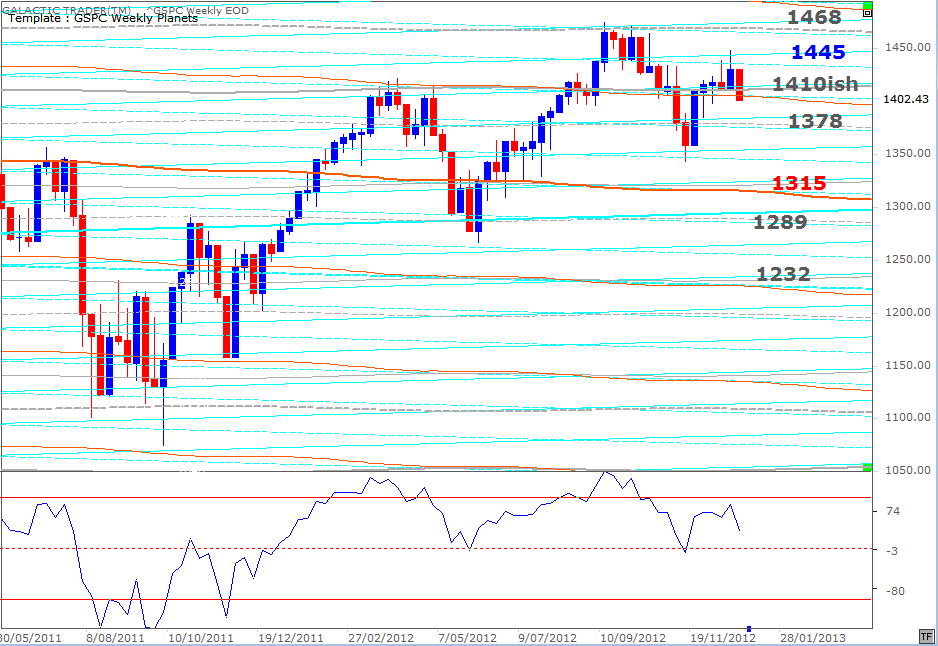
The Weekly Planets chart for Pollyanna shows a couple of Saturn lines around that level to provide additional support. However, there is a stronger layer around 1378.
It will take another couple of weeks for these columns to return to a more normal mode. My mind is still tuned to looking at the broad picture for a whole range of indices over the course of the next year.
See you in 2013!
It will take another couple of weeks for these columns to return to a more normal mode. My mind is still tuned to looking at the broad picture for a whole range of indices over the course of the next year.
See you in 2013!