Tightening BBs warn of fast move
Week beginning December 11, 2011
After rebounding strongly on the back of co-ordinated central bank intervention, stock indices last week marked time, waiting for details of the Merkozy pact to emerge.
Tightening Bollinger Bands are signalling a strong move is on the cards in the next few weeks ... with a high probability the first move will be in the wrong direction.
Tightening Bollinger Bands are signalling a strong move is on the cards in the next few weeks ... with a high probability the first move will be in the wrong direction.


Warm regards .. and Safe trading - RA
(Disclaimer: This article is not advice or a recommendation to trade stocks; it is merely educational material.)
Copyright: Randall Ashbourne - 2011
The details on how to read BB signals are contained within The Technical Section.
Uranus, which has rulership of stock markets, has ended its Retrograde period and is again moving Direct ... it will be joined by Mercury early in the coming week ... and by Jupiter, later in the month.
Venus is heading towards a square aspect with Saturn, though with the two planets in mutual reception, there's no guarantee the aspect will have its usual negative impact. Mutual reception is when planets are in the sign ruled by the other. In this case, Venus is in Saturn's home sign of Capricorn and Saturn is still in Libra, which is not only ruled by Venus, but the sign in which Ole Misery is exalted ... ie: he's about as happy as a Cappy is capable of getting.
For the moment, markets continue to wander through a zone which keeps alive both the possibility of another Bull run higher and the probability of a renewed Bear crash lower.
The planetary sign changes, especially that of Uranus, the maddest and baddest of the Old Gods, warn of sudden, volatile moves in unexpected directions ... and there are technical signals giving off the same vibes.
It's interesting the Europeans think they'll have their accord ready by March - which I've long speculated could mark the end of the final rally before The Crash.
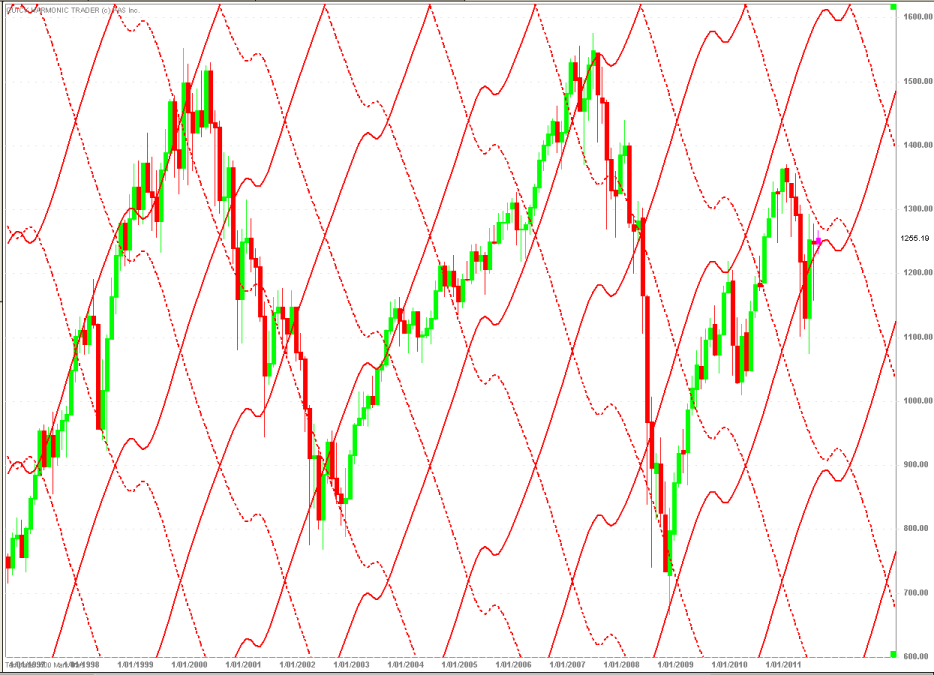
To open the analysis, we'll start with one of my Old Gods charts. Those of you who've read Chapter 3 know already that the SP500 travels between its long-range Outer Planet markers aboard a Martian spaceship. Ahem* Those of you who haven't read the book will think I'm very strange. Eh! I can live with that.
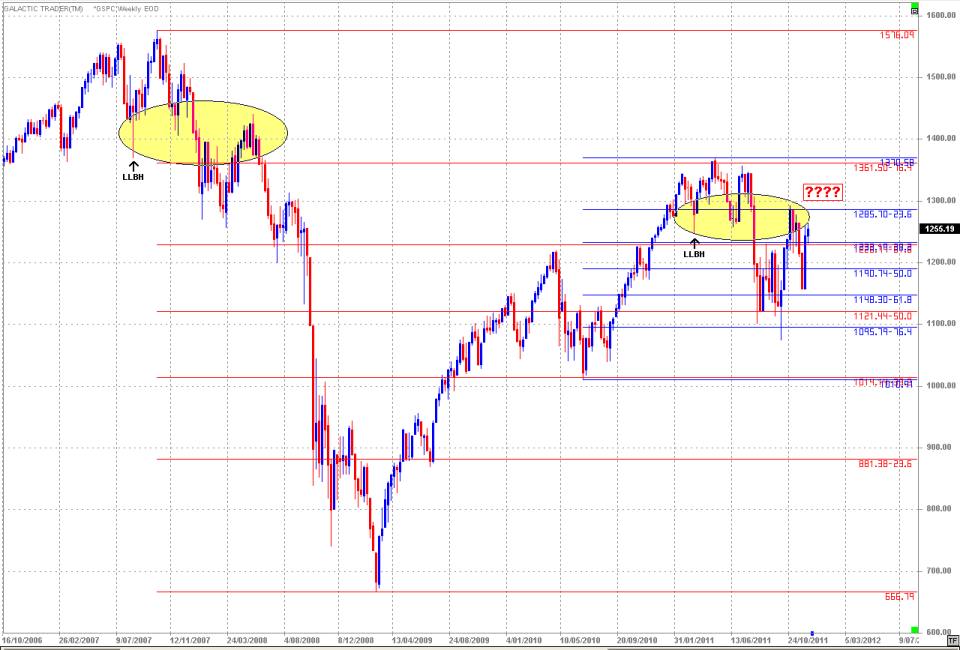
Oh, I know. It's not much of a variation. I've put a box with four ???? at roughly the Time and Price level this should start to fall in a hole ... IF the Bear is back.
I've elongated the yellow ovals to emphasise how Then and Now are having trouble getting much above the "last low before the high" (LLBH) ... the August spike-downs.
I've thrown in the Fibonacci Rx levels for the 2007-2009 Bear leg and the 2010-2011 rally leg. As y'can see, all of these things continue to be significant. Pollyanna topped out early this year AT the 2007 LLBH, which was also the 764 Fib Rx level. Most of the recent August/October weekly lows made kissy-smoochy with the 50% Big Bear marker ... and a lot of the remainder of the action is being contained by the blue-level 236/618 markers.
Well, y'all know what I think is happening ... it's all a case of deja vudoo.
If I'm wrong, we won't find out unless Price goes on a rocket ride through the red question marks.
Okay ... all the "news" and gabfests aside, I think those 3 charts just about cover it. Planet-wise or technically, Miss Pollyanna is floating around in an air pocket. By March, at the latest, she has to make a decision. New Bull ... or Old Bear.
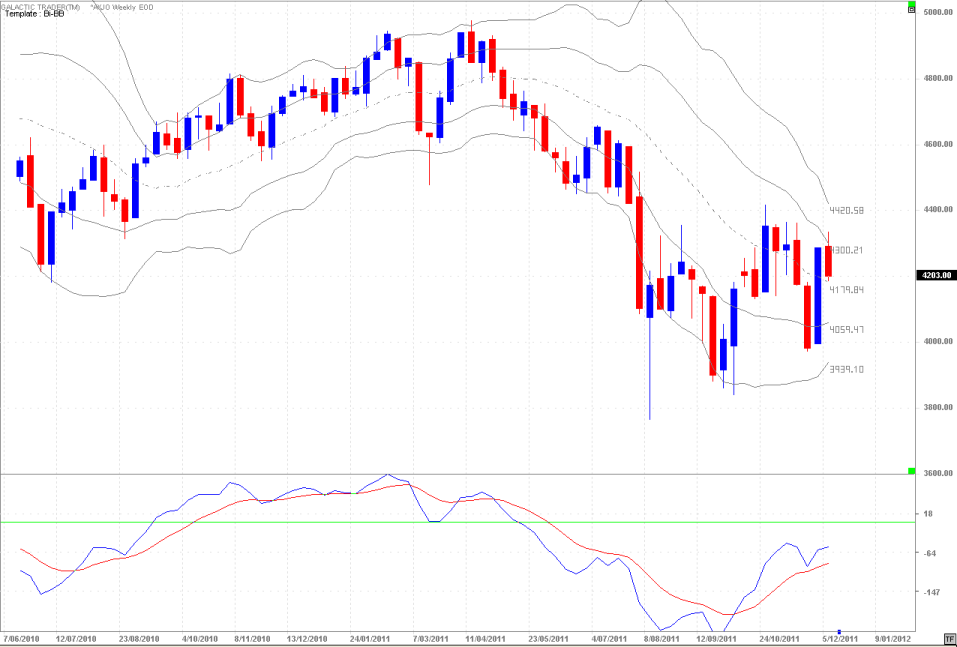
Auntie - the ASX200 - is in a similar pattern, at least in terms of the Bi-BBs.
I've elongated the yellow ovals to emphasise how Then and Now are having trouble getting much above the "last low before the high" (LLBH) ... the August spike-downs.
I've thrown in the Fibonacci Rx levels for the 2007-2009 Bear leg and the 2010-2011 rally leg. As y'can see, all of these things continue to be significant. Pollyanna topped out early this year AT the 2007 LLBH, which was also the 764 Fib Rx level. Most of the recent August/October weekly lows made kissy-smoochy with the 50% Big Bear marker ... and a lot of the remainder of the action is being contained by the blue-level 236/618 markers.
Well, y'all know what I think is happening ... it's all a case of deja vudoo.
If I'm wrong, we won't find out unless Price goes on a rocket ride through the red question marks.
Okay ... all the "news" and gabfests aside, I think those 3 charts just about cover it. Planet-wise or technically, Miss Pollyanna is floating around in an air pocket. By March, at the latest, she has to make a decision. New Bull ... or Old Bear.
Auntie - the ASX200 - is in a similar pattern, at least in terms of the Bi-BBs.
Tightening BBs warn of a fast move approaching and, as discussed in The Technical Section of the book, the first move is often in the "wrong" direction.
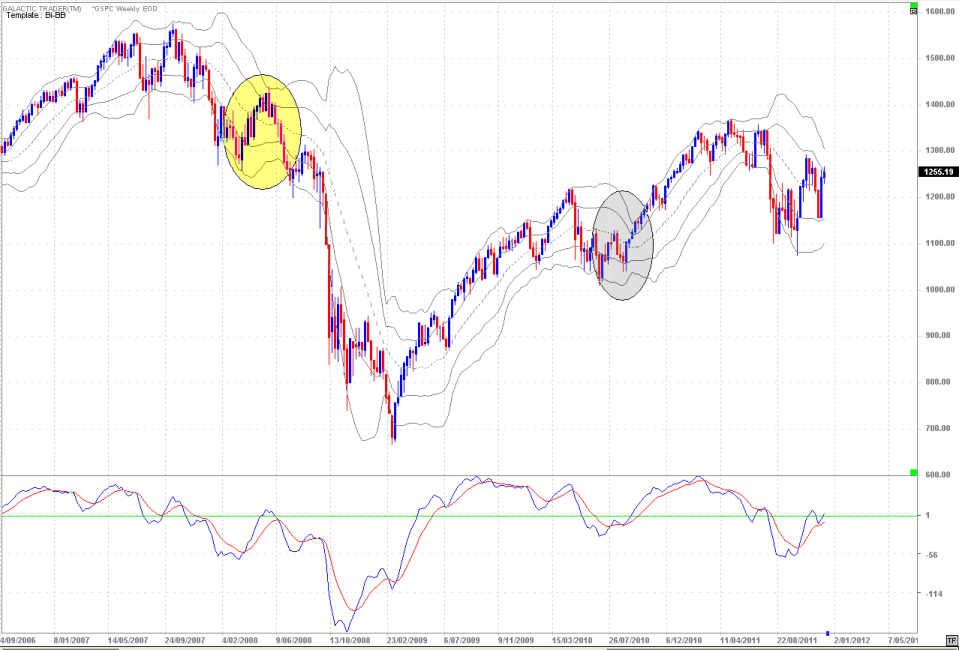
In broader terms, since it is a long-range chart, we can go back to past performance to try to get a feel for what is probable now.
It seems to me there are two probabilities - a repeat of either the yellow oval, or the grey one ... with the highest probability being the yellow oval.
Because? Well, because the MACD appears to be in a similar position to where it was at the yellow oval. Its troughs started to go much lower than during the Bull run into the 2007 top ... it made a small recovery just above the Zero line ... as the BBs tightened and Price made a "wrong" direction dash to the top BB.
And then it all fell to pieces.
The alternative is we're at the grey oval. It's less likely because of the trough-depth divergence in the MACD ... the MACD low went lower, while Price didn't. That's negative divergence.
But, but ... it's possible those of us who are Bearish are wrong and the Bulls are about to start running through the China shop.
Now, if it's the grey oval outcome, Price is going to go MUCH higher. Or, in terms of the Mars Bars chart, it'll stick with the rising channel and head to the 1400s.
Now, because I've been boring y'all to tears for many weeks with the same weekly chart, I've decided to put up a variation on the theme.
I'll tighten the timeframe compared with the earlier Bi-BB chart of the SP500 to make the sharp contraction of the bands more obvious.
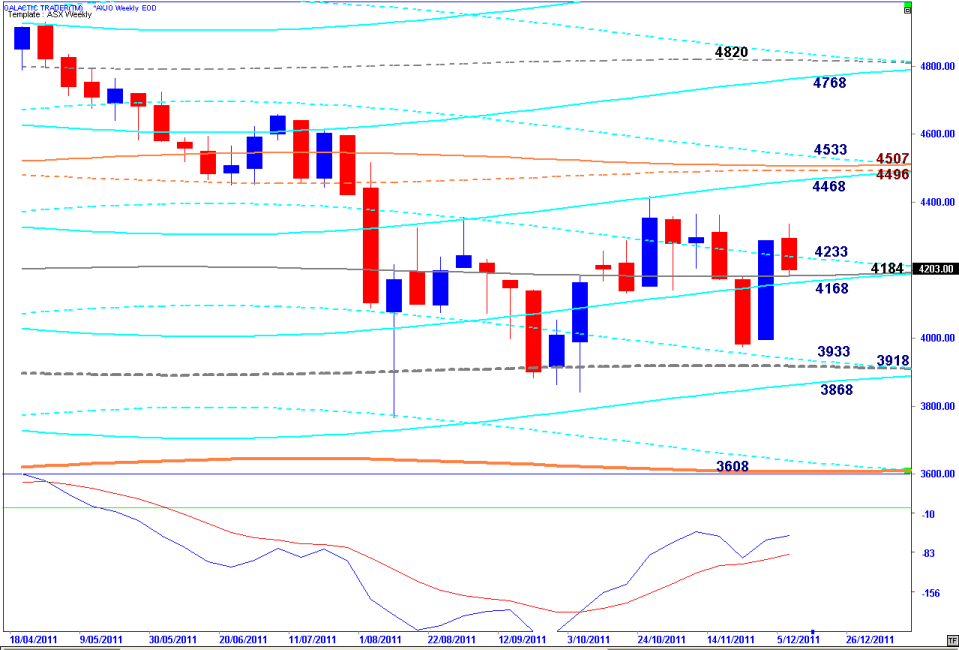
There's no way we're not going to get a fast move within the next few weeks - and if the first move is northbound, it'll finally put Auntie back inside the cyclical target zone I've marked on the charts in previous editions.
Here's Auntie's Weekly Planets chart if you need to know the targets.
There's no way we're not going to get a fast move within the next few weeks - and if the first move is northbound, it'll finally put Auntie back inside the cyclical target zone I've marked on the charts in previous editions.
Here's Auntie's Weekly Planets chart if you need to know the targets.
We will deal here only with the broadest channels of the Mars Bars chart. The August/October decline plunged Pollyanna out of the primary Mars channel which marked the bottom of the 2009 Bear market and also guided the Bullish recovery run into early 2011, when the index began falling under the influence of a 1st harmonic Marshun spaceship travelling south.
At the moment, Price has climbed back inside the rising channel and is trapped in the air pocket between opposing spaceships. The astrology buffs among you will recognise something else ... we're approaching a Marshun Rx zone. Mars appears to go backwards much less frequently than the other planets ... and the Mars Rx stations do have an impact on markets.
For those of you who have little-to-no knowledge of The Spooky Stuff ... and I'd actually hope that is most of you ... the Mars Rx points are where you get a little bump in the direction of the lines. Just pick one of them and trace things back to see how frequently those "bumps" caused a change in Price direction, even if only temporary change in an ongoing trend.
What we're concerned about here is the very high chance the "bump" will actually change the trend in a major way.
Crunch time is approaching ... the future is either goo/goo gushy Pollyanna playing with her rainbow prisms ... or it's big time Chicken Little pooping his pantaloons.
Knowing bugger-all about astrology is perfectly acceptable. Just suspend your disbelief and let your eyes do the thinking. Pollyanna is a vacuous trollop who trails along after a muscled Greek boy with a short skirt and a big sword. And you thought it had to do with fundamentals and Price/Earnings ratios?!?!?
GeeZeus! And you think I'm strange!
The next chart we'll look at is a longish-term Bi-BBs.