Warning signs in India's Nifty index
Week beginning December 10, 2012
We'll take a look this weekend at only a couple of indices, discussing the potential for an end to the range trading in the SP500 and a warning signal in the Nifty 50.

Copyright: Randall Ashbourne - 2011-2012
We're likely to see the action pick up in the coming week as the mood turns increasingly Sagittarian. Mercury makes the sign change on Monday, the Moon goes into Sagittarius on Tuesday, and Venus also shifts into the sign next weekend.
Sagittarius symbolises adventure and optimism. In personal astrology, any planet you have in Sadge indicates the area of life where you really stretch yourself. And, as a general rule of thumb, it's that adventure and optimism which normally brings on the Santa Claus rally at this time of year.
However, the rules change a little when interpreting the astrological symbolism for financial markets. What becomes important is the nature of Jupiter's symbolism; above all, the FatBoy's ability to exaggerate.
Because what sometimes happens is that instead of a boundless, happy-go-lucky attitude, what gets exaggerated is the fear factor.
For over a week, Wall Street's Pollyanna index has been trapped in a narrow range from 1400 to 1420.
On Friday, the Dow Industrials made a break northwards, while the Nasdaq 100 declined and the 500 held its ground.
On Friday, the Dow Industrials made a break northwards, while the Nasdaq 100 declined and the 500 held its ground.


Safe trading - RA
(Disclaimer: This article is not advice or a recommendation to trade stocks; it is merely educational material.)
There are a couple of other significant moves this coming week - a New Moon on Thursday (USA time) and Uranus going Direct. There's some conflict between those two ... since New Moons tend to occur near short-term market highs, while Uranus changing from Retrograde motion to Direct most often suggests a multi-week rally.
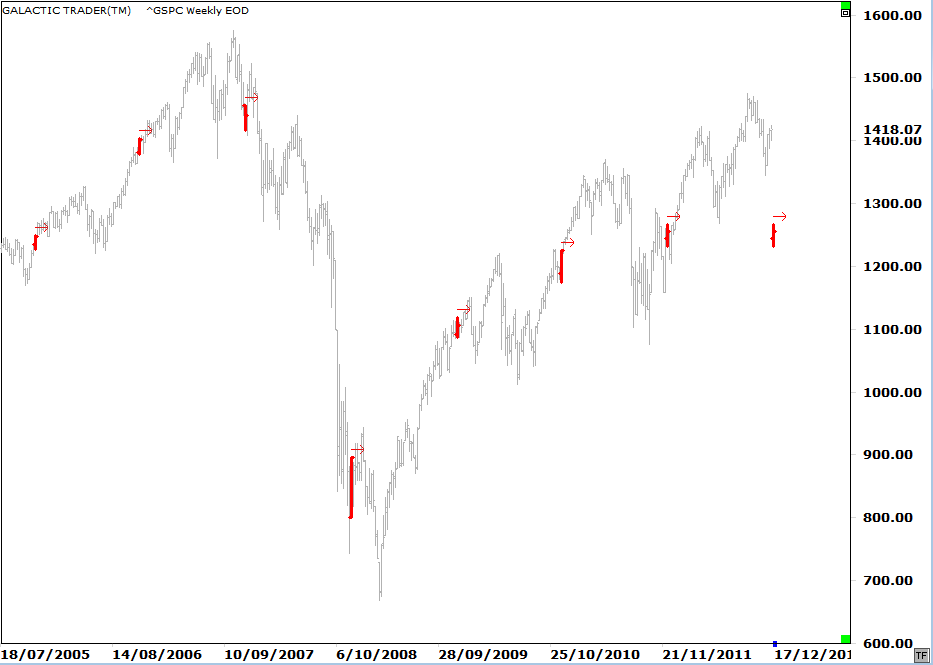
Let's take a quick look at the historical performance.
Let's take a quick look at the historical performance.
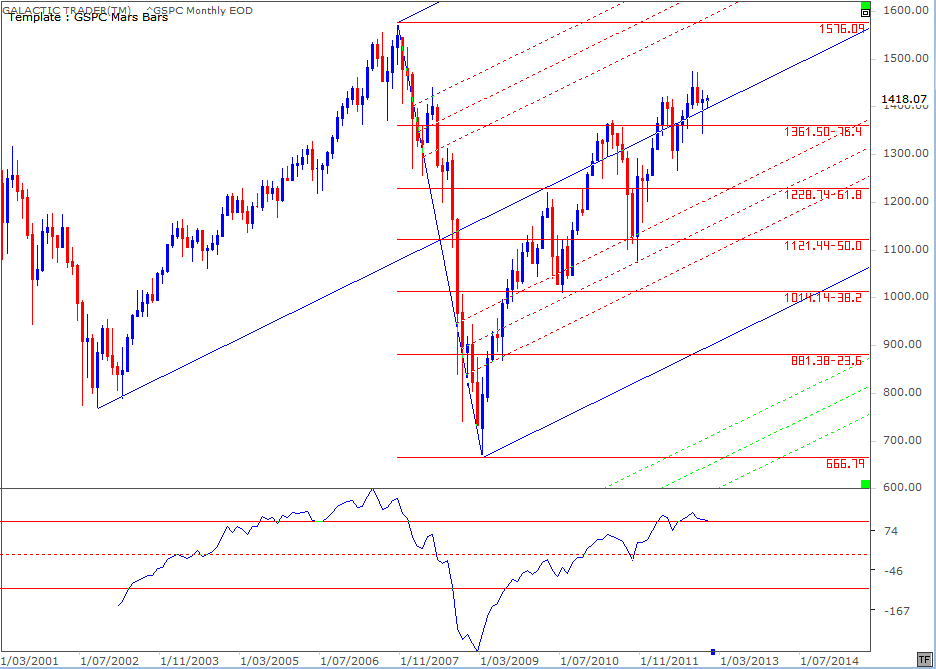
The importance of the trend channel and the three black horizontal Support/Resistance levels in the chart above are obvious. Also obvious is Pollyanna's need to break above the highest of the horizontal barriers if the market is to negate the H&S pattern.
Last weekend, I published planetary charts for major world indices in a bid to set the probable target levels for the rest of the year and you can consult those charts in the Archives if you missed it.
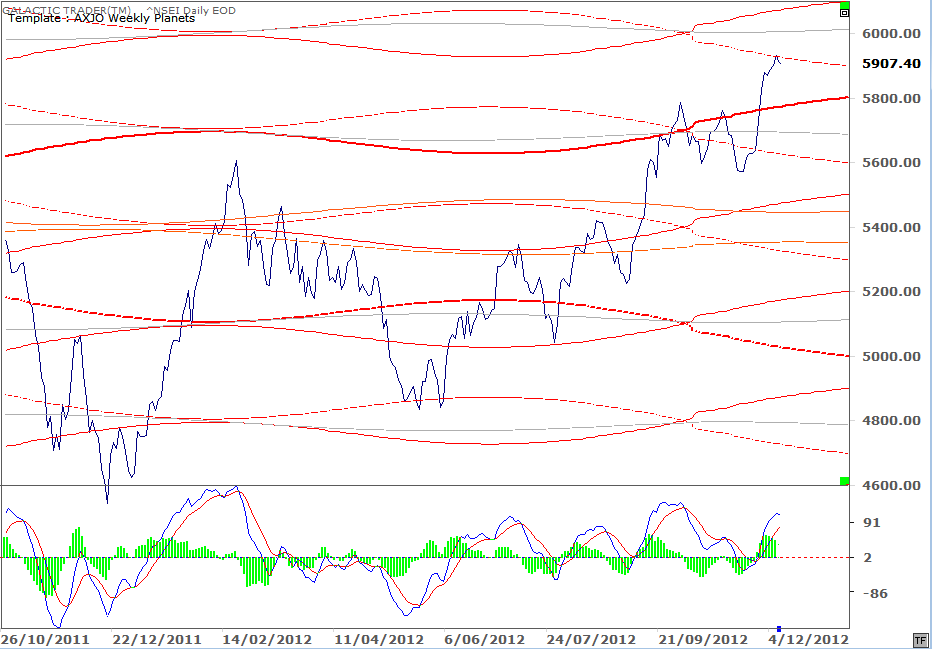
India's Nifty, which broke out strongly the previous week, is now bumping against overhead resistance. First, let's look at the daily version.
Last weekend, I published planetary charts for major world indices in a bid to set the probable target levels for the rest of the year and you can consult those charts in the Archives if you missed it.
India's Nifty, which broke out strongly the previous week, is now bumping against overhead resistance. First, let's look at the daily version.
In the chart above, the Uranus Direct moves are marked with red bars. Of the past 7 instances, only one coincided with a drop ... and that was short-lived. Even during the 2007/2009 market freefall, the Uranus Direct stations marked the start of multi-week rallies.
From a big picture perspective, the 500 remains in a multi-year uptrend - currently finding Support at the central tyne of a pitchfork anchored at the multi-year highs and lows.
From a big picture perspective, the 500 remains in a multi-year uptrend - currently finding Support at the central tyne of a pitchfork anchored at the multi-year highs and lows.
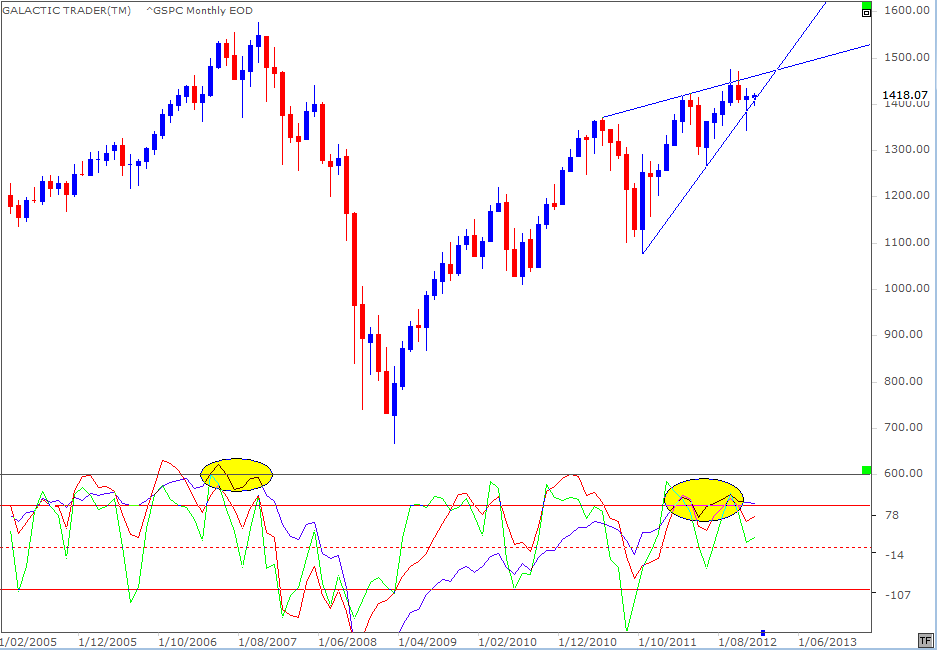
There is no clear-cut negative divergence yet in that line - divergence which was very obvious at the 2007 top. However, the green (fast) and red (medium) oscillators have been signalling trouble for some time, maintaining their position below the blue line, which is the opposite of what one wants to see for continuing price rally mode.
And it may be that a head-and-shoulders topping pattern is now in the process of forming its right shoulder.
And it may be that a head-and-shoulders topping pattern is now in the process of forming its right shoulder.
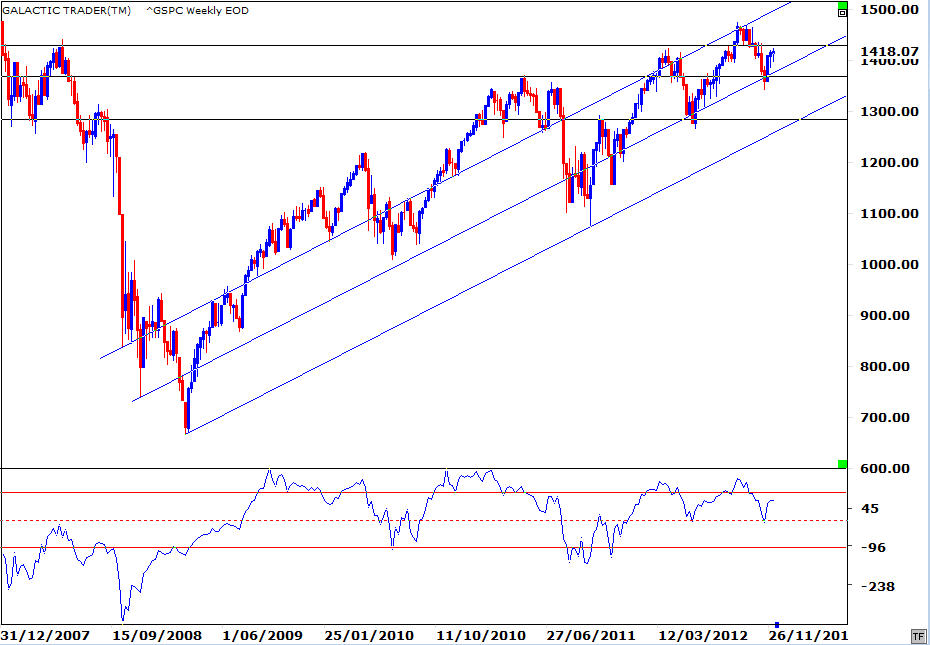
The long-term uptrend continues to weaken - and it is possible the final high of this Bull run was put in place 4 months ago. We've discussed in the past what appears to be an Ending Diagonal topping structure.
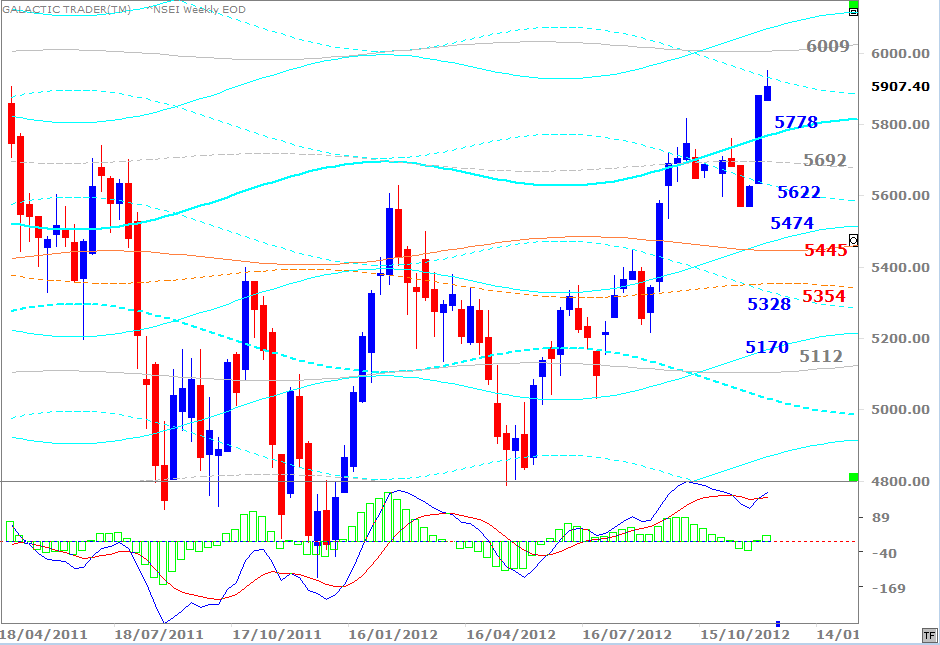
However, it's still possible the last rally has not yet been seen ... the one that gives us a new high, but with a distinctly lower high in the long-range oscillator (the blue line in the lower panel).
However, it's still possible the last rally has not yet been seen ... the one that gives us a new high, but with a distinctly lower high in the long-range oscillator (the blue line in the lower panel).
That negative divergence is also showing up in the Nifty's Weekly Planets chart, where the warning signs are amplified by the weakness of the MACD histogram.