Awoe! Alas! The sky is falling!
Week beginning August 8, 2011
Pollyanna picks up her pretty prisms and exits stage right; Chicken Little comes roaring back, head cut off, spraying arterial blood.


I spent some time last weekend waffling through some spooky stuff, specifically about Mercury Retrograde often starting "a sudden move, often in an unexpected direction at the start of the period and then reverse course halfway through" and also talked about the potential for a Mars-Uranus crash cycle developing.
Safe trading - RA
(Disclaimer: This article is not advice or a recommendation to trade stocks; it is merely educational material.)
There's no point in my reiterating any of it; it's in the Archives. Let's move on. Bear moves are predictable in the way they form, just as rallies are. They will target certain Price zones and stall when they're reached.
Those of you who already have the book might want to re-read a couple of chapters from The Technical Section, specifically those dealing with Time & Price and Bi-BBs.
Those of you who already have the book might want to re-read a couple of chapters from The Technical Section, specifically those dealing with Time & Price and Bi-BBs.
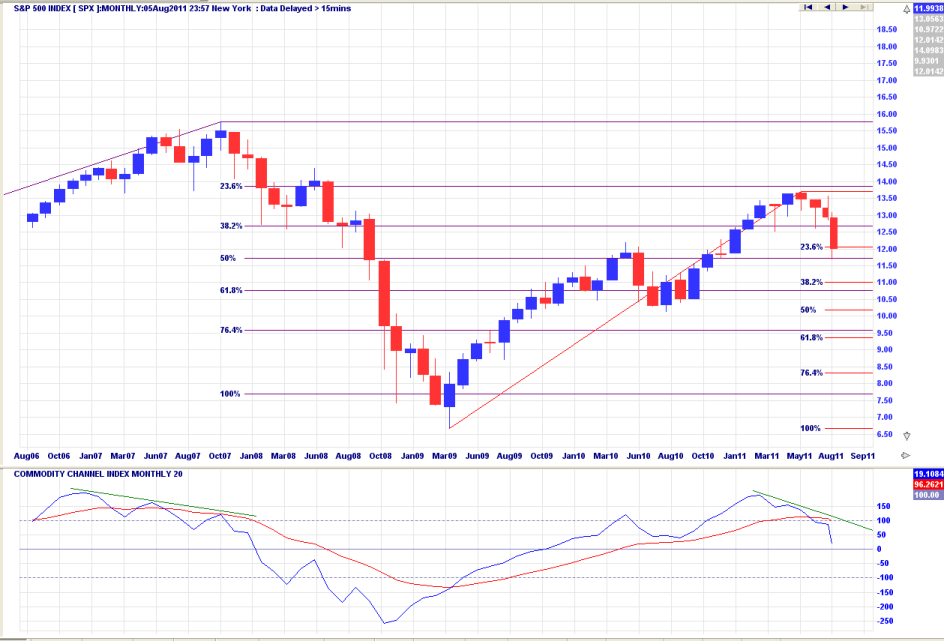
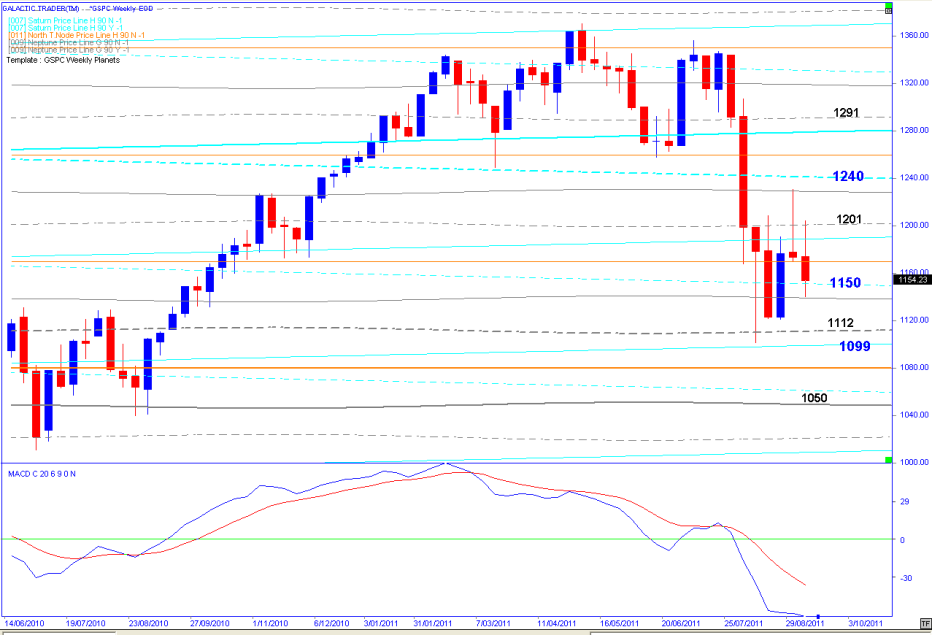
Firstly, we'll return to the long-term monthly chart of the SP500 to take another look at the overall forest ... and I've now added a second orange horizontal line which has, historically, capped or underlined Price moves.
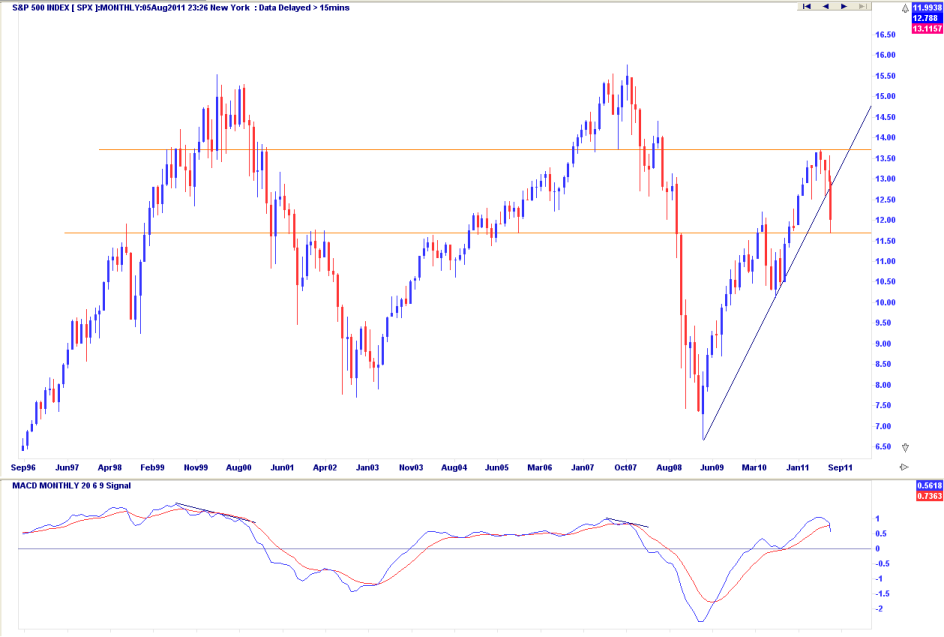
We have a negative cross on the fast MACD ... the too far-too fast trendline starting from the March, 2009, Bear bottom has finally been broken decisively to the downside.
There is every chance the Bear market is resuming, which was a fairly clear expectation in the book and has been discussed almost every week since I launched this website in June.
So, the real questions become: How far will it go and when and where will it pause? Well, we can see it has already hit a Price zone with a strong chance of forcing a pause, especially if you go over the material in the Bi-BBs chapter.
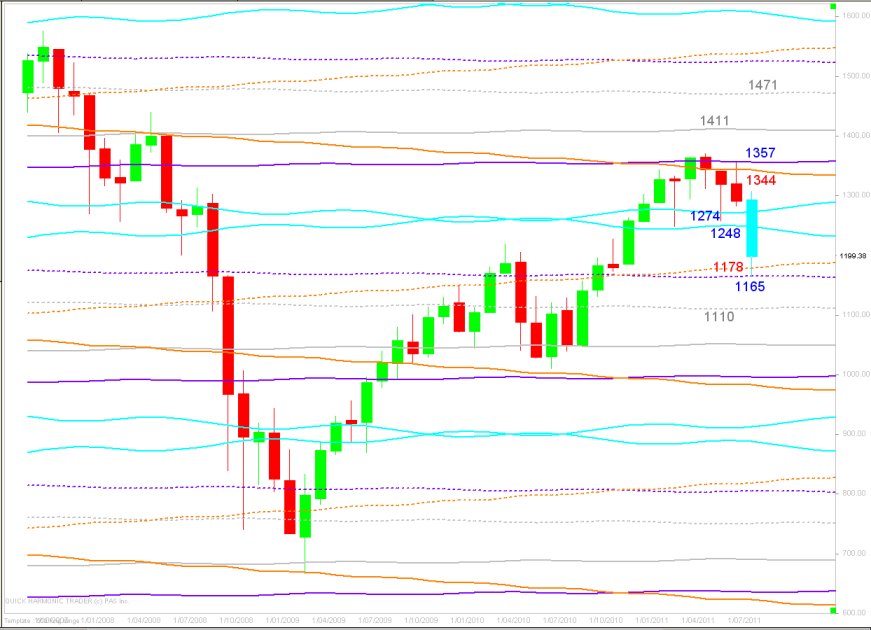
Last month, I left open the possibility the index would hit the overhead, downtrending, dotted Mars line before the decline started. As events turned out, it never quite made it - getting stopped out by the Old Gods lines instead.
What is interesting is that the sharp decline has taken Price down to exactly the level of a first harmonic, rising Mars ... precisely the line which stopped the previous Bear move in its tracks.
The importance of these Martian channels, especially the broader channels defined by the thicker, first harmonic lines, is fully detailed in Chapter 3.
So, we have a technical horizontal layer now in play ... a potential bounce from a couple of the Old Gods ... and also a test of the rising Mars channel.
And that's because these tragicomedies tend to follow a very old script. In the chart above are two sets of Fibonacci retracements ... the darker one for the 2002-2007 Bull and the red one for the Bull recovery run from early 2009.
The first leg of ANY Bear phase tends to stop at the 236 or 382 level and spend some time bouncing around there. Remember one of the lessons from the final chapter of the book - a large amount of Price in a small amount of Time needs to be followed by a large amount of Time for a small amount of Price.
I seriously doubt this particular downtrend is over. But, I'm also not going to bet the farm that a full-blown crash is taking us to Hades in one fast, unbroken movement. Not with Mercury Retrograde and an historical tendency to reverse course halfway through the Rx timeframe.
Very soon now, I'd expect a 2nd degree countertrend, followed by a retest of the Low, followed by a countertrend of some cyclical degree.
At this stage, I suspect we are within a developing Bear phase which will not be finished until late October or early November of 2012.
I will try to find time in the next few days to write an overview that I'll post under the Articles button.
Also, while I'm house-keeping ... the inestimable Rudy Dumas, one of the best Elliott Wave technicians I've seen at work, has finalised writing his introduction to the methodology and I'll put it online under the Guest Articles button in the next few days.
Rudy also has some thoughts about the potential pattern that will develop for the final phase of the brutish Bear which began in 2007 and now appears to be resuming. He is a tad more pessimistic than I am about the "end" date, but he and I are in broad agreement about where things are going and how they're most likely to develop.
Finally, I would hope that none of my readers stepped in front of this freight train, believing they could outsmart The Idiot. If you did, count it as a lesson and move on. To be honest, I still do it myself occasionally! More and more occasionally, I might add!! I almost inevitably regret it.
Catch you next weekend.
Copyright: Randall Ashbourne - 2011
A few sentences from last weekend's report: -
The first point I want to make is this: The Idiot is now on a confirmed Sell signal on daily and weekly charts and is within ONE CENT of being on a Sell in terms of the monthly chart.
We still have the potential for a surprise, relief run higher. But, for the first time since the recovery Bull run started, the danger klaxons are sounding very, very loudly.
We are at one of those times when all but the most adventurous traders should carefully consider all Open positions and take whatever steps they think are necessary to protect, firstly, their capital base and secondly any profits already accrued.
Oh, I know it's irksome! Incredibly bloody irritating, quite frankly. But, if that signal suddenly starts telling us to get the hell out of Dodge, fast ... don't stop to argue.
The state of the markets leads the TV news, human hyenas drool and growl as they fight for a few seconds of fame.
You know my view ... if you're excited OR depressed, you're just not doing it right.
Ho hum. Whatever. We've been here before. We will be again. It's all shock and awful and we're in "uncharted territory". Except it's not at all even vaguely uncharted.
In the Old Gods chapter of the book, I deal with the very long-term planetary price lines which have a decades-old history of proving to be key Support and Resistance levels on the SP 500 ... and having failed to break through an important barrier, the index has fallen to find at least temporary Support at the next lower level of those same planets.
We have also discussed how the index hitches a ride between those planets on a Martian spaceship.
We have also discussed how the index hitches a ride between those planets on a Martian spaceship.
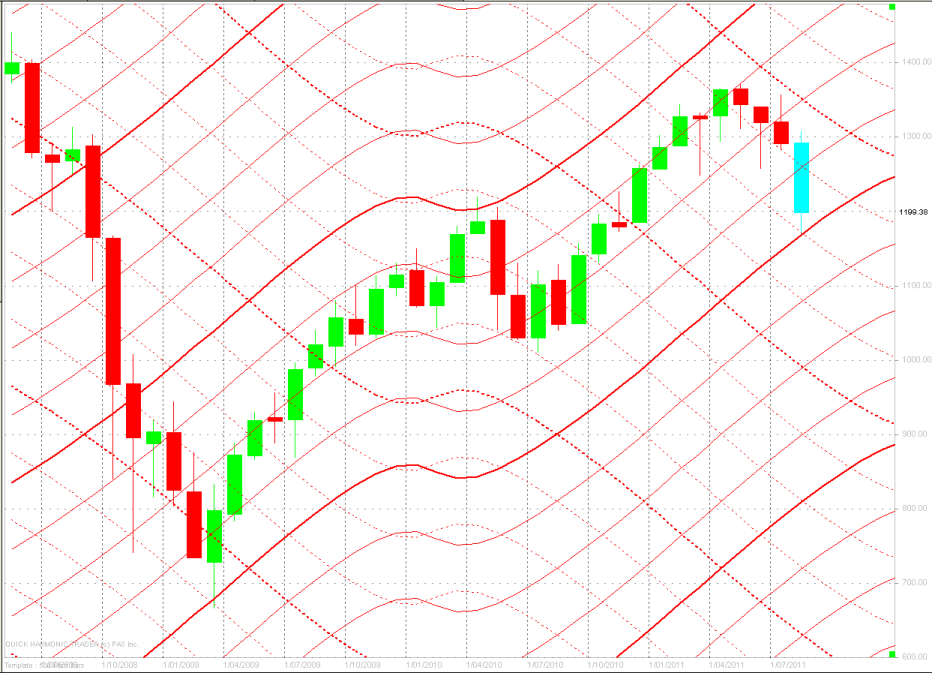
And as well as those, we also have the weekly planetary price lines coming into play. Now, while I am very mindful of what can happen when the panic-stricken Chicken Little displaces the vacuous heroine, Pollyanna, on the stage of that classic Greek temple on Wall Street, I try to tune out the Cassandra caterwauling and look at what is likely and probable.