


Probability No 1: We're now in a range
Week beginning August 29, 2011
The probability is that markets are now embarked on a range-trading period designed to eat Time rather than Price ... and if the past is any guide, it could continue for months.


Normally, the period from New Moon to Full Moon - ie: the next 2 weeks - is statistically negative. And we're also coming into September, statistically the worst month of the year for Wall Street.
Safe trading - RA
(Disclaimer: This article is not advice or a recommendation to trade stocks; it is merely educational material.)
However, it's also the week leading into the Labor Day long weekend in the USA ... volume will start to lighten. Oh! And there's a chance New York will be hit by a hurricane which could cause severe flooding. We assume steps have been taken to protect the luvvy-duvvy NYSE/Goldmans/Morgans computer banks in New Jersey.
But we cannot make plans based on the expectation of storms, regardless of whether they're generated by natural forces or the extraordinarily unnatural ones emanating from the minds of Tom Wolfe's other Masters of the Universe.
And why would we need to when, so far, the turns are coming at oh-so-predictable points?
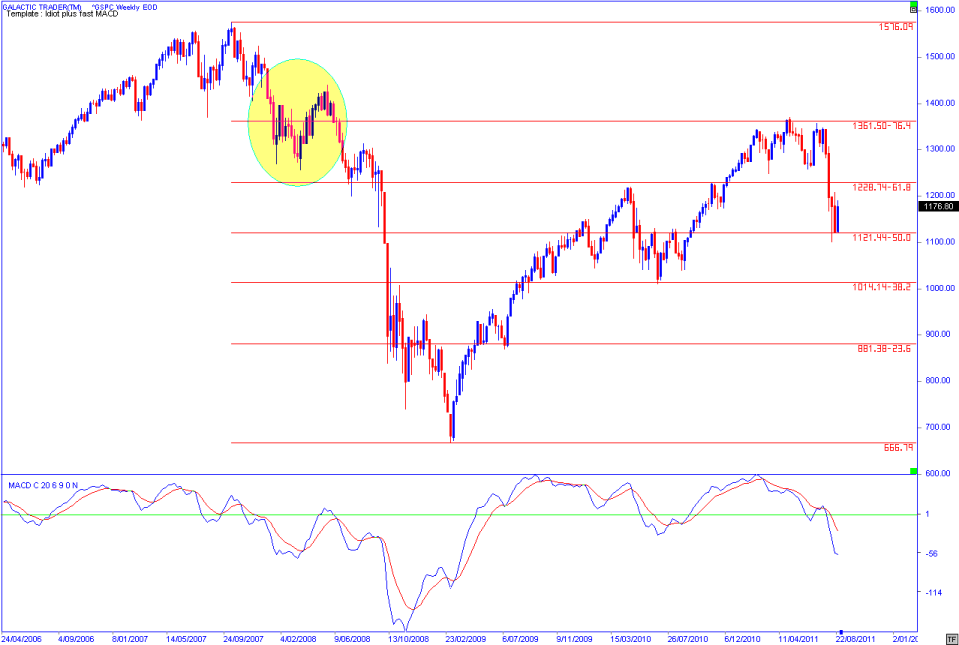
For our first chart this week, we'll look at the 2007-2009 Bear crash and the performance of the Bullish recovery within the Fibonacci levels set up by the crash.
But we cannot make plans based on the expectation of storms, regardless of whether they're generated by natural forces or the extraordinarily unnatural ones emanating from the minds of Tom Wolfe's other Masters of the Universe.
And why would we need to when, so far, the turns are coming at oh-so-predictable points?
For our first chart this week, we'll look at the 2007-2009 Bear crash and the performance of the Bullish recovery within the Fibonacci levels set up by the crash.
Copyright: Randall Ashbourne - 2011
It's still not entirely certain whether markets need to make a new Low around the level of the one on August 9, or whether the retest took place last Monday and stock markets are now within a cyclical-level rally period.
Of course, the term "rally" isn't quite right - at least, probably not quite right - because what is more likely is a period of range-trading where the sharp, recent falls are "digested" and various players shift positions to prepare for further dramatic falls into late 2012.
Of course, the term "rally" isn't quite right - at least, probably not quite right - because what is more likely is a period of range-trading where the sharp, recent falls are "digested" and various players shift positions to prepare for further dramatic falls into late 2012.
Last week's action on Wall Street suggests the chance of further near-term panic is diminishing.
Next week starts out under the influence of a New Moon in the worrywart sign of Virgo, an energy which insists on rather precise detail and practical proof. One of the things Virgo rules is accountancy/book-keeping.
Last week ended the Mercury Retrograde period - and, also, the last of the negative Mars transits to Saturn, Uranus and Pluto.
It ought to mean the energy which will now take over for a few weeks is less prone to Act Now/Think Later, but is more inclined to analyse the real worth of everything - from company balance sheets to verbal statements. And it will do all of it with a very critical eye ... critical in the sense of keen discernment, rather than mere nagging (something Virgo is also very good at!).
On the right of the chart we see the current action ... Price trying to find a Low right on the 50% range. The two other significant corrections during the Bullish recovery found Support at the 236 and 382 levels (and topped out right on the 764 level).
So, basically, there is nothing the slightest bit out of the ordinary in this. Over the past few weeks, I've discussed what I believe is happening because of the signals from The Idiot and from the warnings generated by the oscillators ... ie: a very high probability that The Bear Is Back!
And I've also discussed what is "normal" ... what is "likely" to happen ... if that prediction is correct. I think we are now probably in the same sort of pattern I've marked with a yellow oval, which covers the first sharp downleg of the 2007-2009 Bear market. You can see the pattern chomped up many weeks of Time without doing very much in terms of Price.
I've also discussed how the "normal" behaviour plays out to a very old script - that the first Bear leg tends to stall at a 236/382 retrace of the entire Bullish phase into the High and bounces around between those levels until it renews the downward crash impulse.
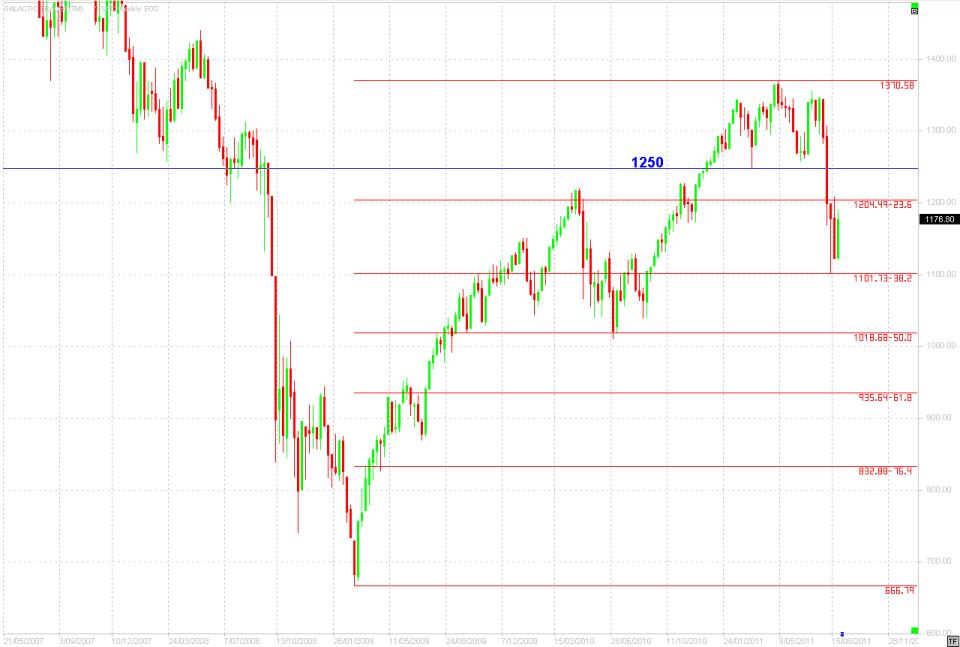
I mentioned at the beginning that I still don't think it's entirely certain we are yet within the "cyclical" countertrend higher from the August 9 Low - but, I also don't think it matters very much in terms of trading strategies because I suspect both the upper and lower ends of a range have now been set.
If there's going to be a new Low, it will come within the next two weeks and it's unlikely to go much below 1100 on the SP500.
If we're already in the cyclical countertrend, there will be strong Resistance as 1250 is approached from below. I've made reference to this before in a longer-term context.
It is a particular condition - the last Low before The High - and it is always a level of enormous Resistance. In fact, this 2-year Bullish recovery run on the SP500 turned down at exactly that barrier.
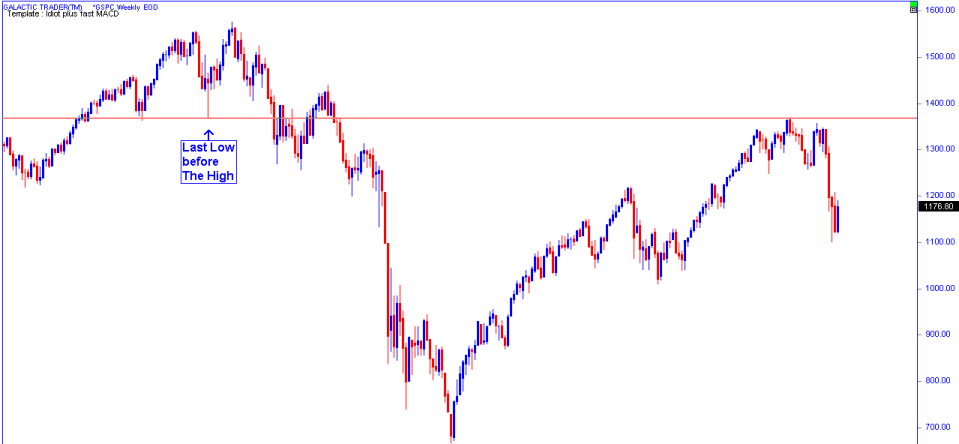
The chart above shows the August spike down in 2007, just before the index launched into its final blow-off - a Price level which became the recovery High.
Well, we think it is the "probable" recovery high ... we're not really expecting a repeat of the 2007 market - another blow-off rally.
Anyway, I make the point about the 1250 level in the current market because exactly how the index behaves as it gets back near that level on the first occasion should give us some good clues about what will happen next.
In a moment, we'll turn our attention to the Old Gods, but before we do I'd just like to recap a little - on today so far and some of what has been discussed, both in the book and during the past few weeks.
We were expecting a relatively high level Bearish phase to re-emerge - and recently I outlined why I think that's so and painted a big picture view. We've also discussed how it's most likely to follow a timeworn script ... and so far it's all behaving fairly much as expected.
We know from The Idiot & The Moon that what I refer to as Time phases need an adjustment in our expectation of the potential profits to be gained. It is possible to trade the expected range of a Time phase by entering and exiting at "probable" levels, but with tight Loss Stops in place "just in case" something else happens.
For the moment, despite all the angst and endless speculation, Price on the SP500 - and in lots of other markets - is dancing to the tune of the Fibolin ... and the Old Gods.
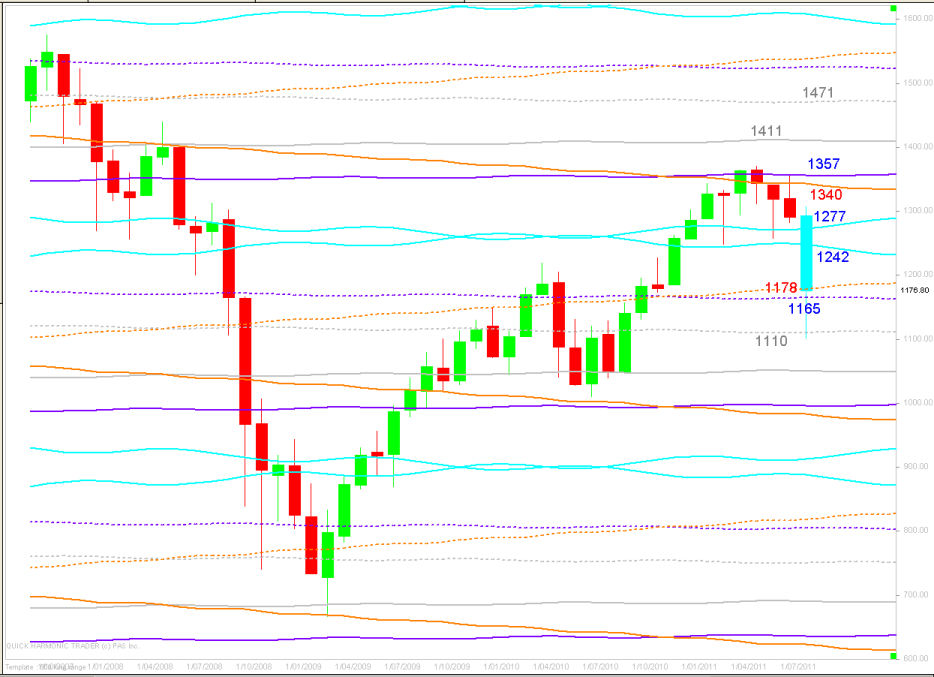
While I made the point about 1250 being an important "technical" level, the Old Gods planetary price chart for the SP500 lists 1242 and 1277 as significant barriers during the expected cyclical "rally" which corrects this strong downward plunge.
Notice how it's desperately trying to stay above the Node/Pluto zone around 1165/1180.
Notice how it's desperately trying to stay above the Node/Pluto zone around 1165/1180.
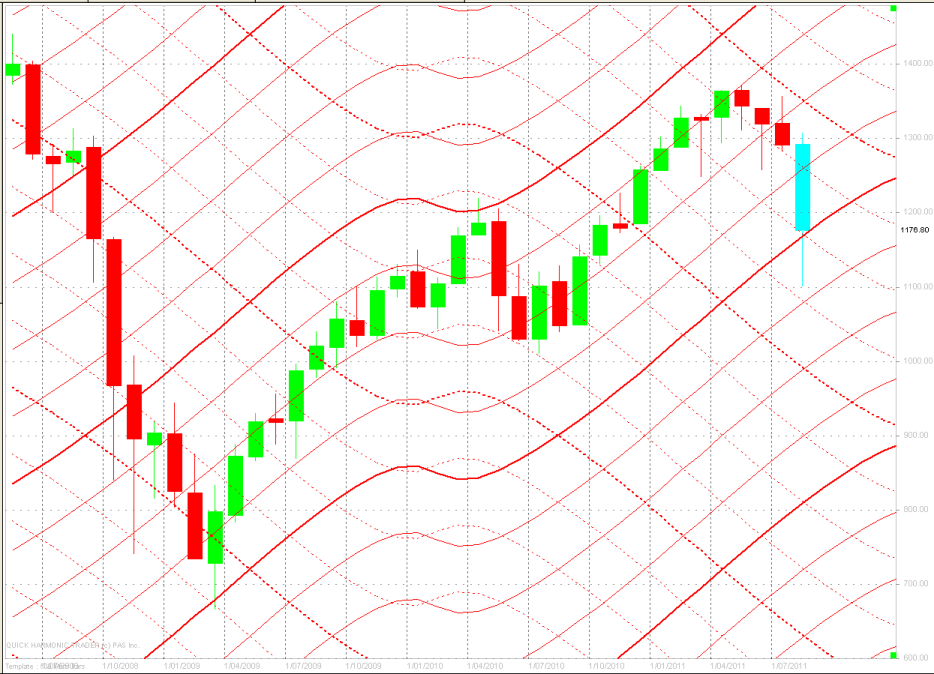
And in the Mars Bars chart above, it's still closing inside a rising channel marked out by primary, first harmonic Mars lines - currently testing and holding just above the channel line which marked the 2009 Low.
Now, I think that's quite enough of the vacuous troll, Pollyanna. We all spend far too much time concentrating on what Wall Street is doing ... and I think in the next few weeks I should spend some time looking at other markets.
And since I've ignored my home market for the past couple of weeks, it's time for a quick look at Auntie ASX.
If you've read the book, or been following along for a while, you'll know Auntie is a Neptunian ... and the silly old bat broke a couple of major Neptunians over-reacting to Pollyanna/ChickenLittle (or, maybe, it was Julia and the Jesuit).
Anyway, while Polly rides a Martian spaceship between Node/Pluto levels over the long-term, Auntie seems to like the company of that miserable grump, Saturn (the cyan lines).
The implications are:
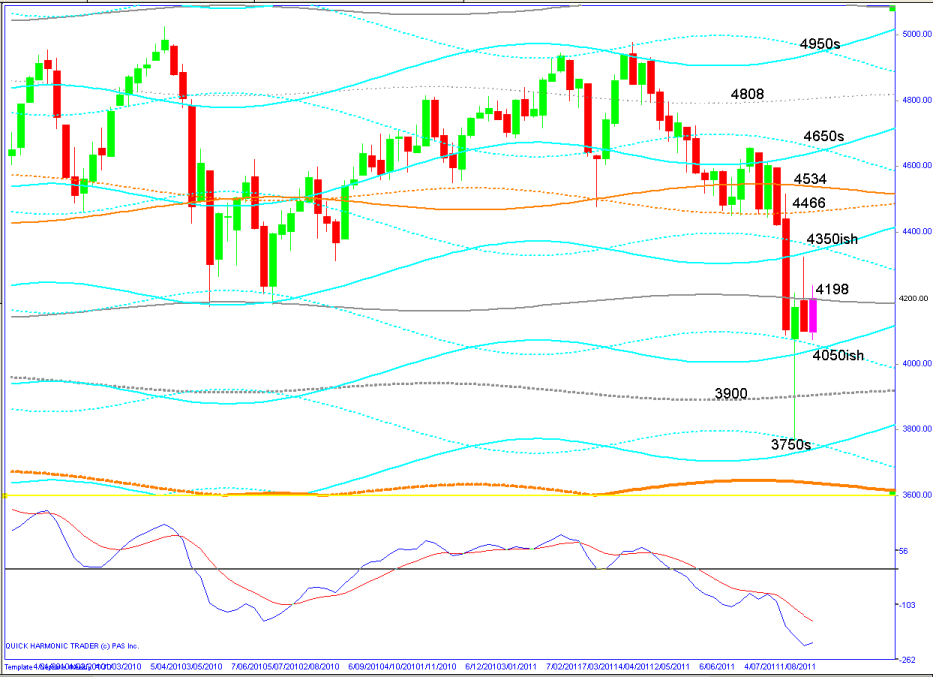
1. IF the downside is over and we're into a cyclical countertrend, she first of all needs to get above 4200 and stay there. She'll get the wobbles and need the smelling salts around 4350 ... but there is potential to get back into the 4400s.
2. IF the downside is NOT over near-term, the length of that tail and the long-term strength of Neptune lines, suggests the next downleg could truncate.
As with the SP500's Fibolin strings, it wouldn't be too unreasonable to assume the ASX200 will ride Saturn's rings and they'll mark the "likely" limits of any range.
Not, of course, that Auntie doesn't kick up her heels to the Fibolin's melody.
Anyway, while Polly rides a Martian spaceship between Node/Pluto levels over the long-term, Auntie seems to like the company of that miserable grump, Saturn (the cyan lines).
The implications are:
1. IF the downside is over and we're into a cyclical countertrend, she first of all needs to get above 4200 and stay there. She'll get the wobbles and need the smelling salts around 4350 ... but there is potential to get back into the 4400s.
2. IF the downside is NOT over near-term, the length of that tail and the long-term strength of Neptune lines, suggests the next downleg could truncate.
As with the SP500's Fibolin strings, it wouldn't be too unreasonable to assume the ASX200 will ride Saturn's rings and they'll mark the "likely" limits of any range.
Not, of course, that Auntie doesn't kick up her heels to the Fibolin's melody.
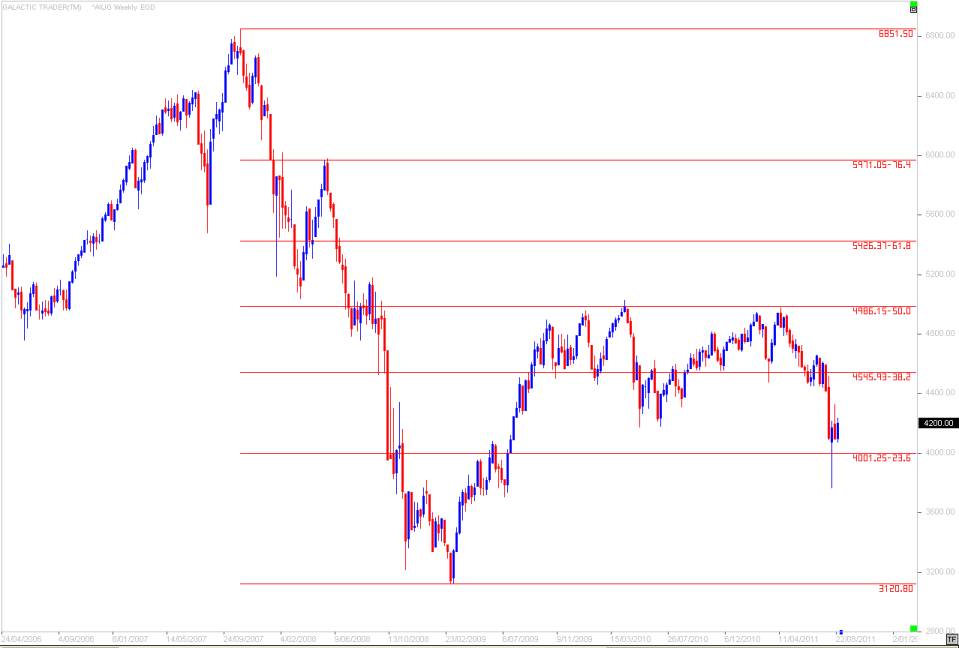
You'll recall the SP500'S Bullish recovery run took it to the August, 2007, spike Low (and the 764 Fibonacci Rx) and that index is now trying to bottom on top of the 50% level.
Auntie had only one little peek above the 50 mark and took a very long to work up the courage for a second look. Still, she seems to have a Fibonacci range of 500 points to play in for the intermediate-term.
Okay, enough of this waffle.
If, perchance, you're weird enough to enjoy these strange rambling journeys between planets and linear territory marked out by That Dead Italian Guy, please send The Eye's URL to your friends. Until next weekend!