


Retesting the Low - or renewed panic?
Week beginning August 22, 2011
For the past couple of weekends, I've talked about the pattern I expected to see here - a 2nd degree rally, followed by a retest of the Low, followed by a longer rally of cyclical length.


A few weekends ago, talking about spooky stuff and the potential for a Mars-Uranus crash cycle developing, I dealt briefly with the astrological symbolism. Mars, in the sign of Cancer, is involved in a Cardinal Grand Cross with Saturn, Uranus and Pluto. The final one of the aspects - the square to Saturn - occurs later this coming week.
Safe trading - RA
(Disclaimer: This article is not advice or a recommendation to trade stocks; it is merely educational material.)
So, while there is a strong possibility the panic continues and prices will continue plunging, there is also a strong chance that the "expected" pattern will play out and that the SP500 is in the process of retesting the Low of August 9.
I'll get to that expected pattern in a few moments. Before that, I want to show another long-range monthly chart with further evidence of why I doubt an ongoing panic move here and now.
I'll get to that expected pattern in a few moments. Before that, I want to show another long-range monthly chart with further evidence of why I doubt an ongoing panic move here and now.
Copyright: Randall Ashbourne - 2011
In a moment, we'll turn our attention to look at those possibilities. But first, I completed a big picture overview of whether we're in an old Bear or a New Bull and put it online under the Articles button early last week.
If you have not read it already, I suggest it's worth a look before you continue with this week's Eye of Ra report, since it will help put this report into perspective. Click on the button below and the overview should open in a new tab so you can read it and then return to this page.
If you have not read it already, I suggest it's worth a look before you continue with this week's Eye of Ra report, since it will help put this report into perspective. Click on the button below and the overview should open in a new tab so you can read it and then return to this page.
That is the roadmap which seems to be playing out - and the only danger is that instead of a mere "retest", we're still in a panic down.
While the "news" cycle is bad, the TV bulletins have swapped Libya and Syria for the latest gloom from Wall Street as their lead items, and the "experts" who were so incredibly Bullish a few weeks ago now wear harried looks as they drool their new opinions about how dire it all is, we try to ignore all of that and concentrate on what the charts are telling us about the next likely move.
And while Price appears to be accelerating downwards again, our favourite oscillators are actually decelerating - at least in the short-term timeframes.
And while Price appears to be accelerating downwards again, our favourite oscillators are actually decelerating - at least in the short-term timeframes.
I hope by now you've read the big picture overview so that you recognise we are now probably within a large-scale C wave downwards.
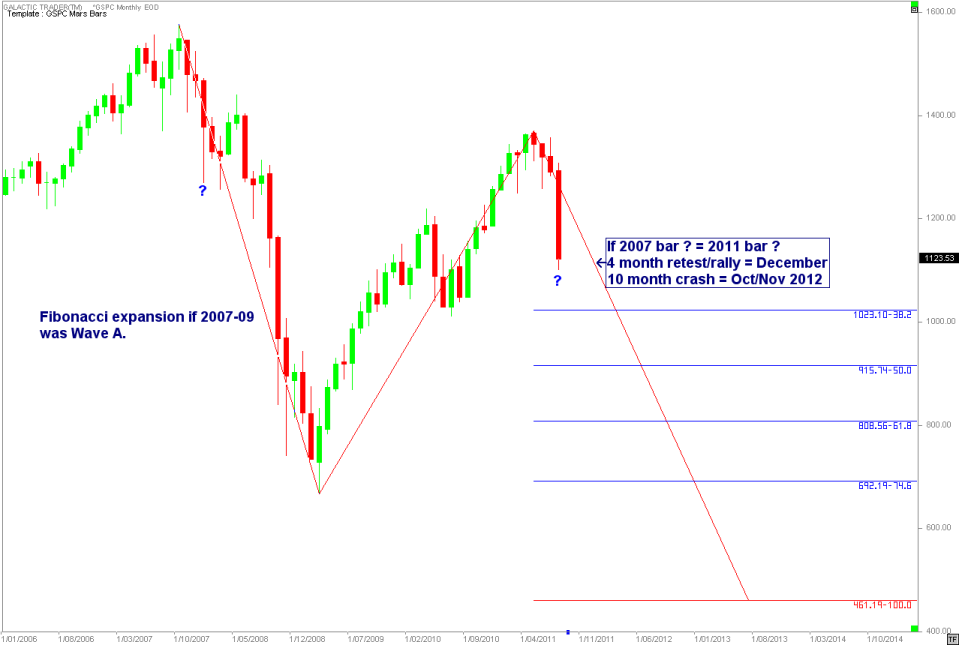
What is "normal" in ABC corrections, regardless of the timeframe, is that Wave C tends to bear a "size" relationship to Wave A. The chart above shows what is likely to happen if I'm right about the big picture.
If Wave A and Wave C are a similar size ... and IF the crash leg follows the normal angle of descent (the red diagonals) ... then this Bear leg now probably underway will run to a Price of $461 on the SP 500 by July, 2013.
I have marked two red bars on this chart with a "?", indicating what I suspect will be a broadly repeating pattern. Now, as I've indicated, I think this Bear leg is due to terminate in October/November of 2012 - not July/August of 2013.
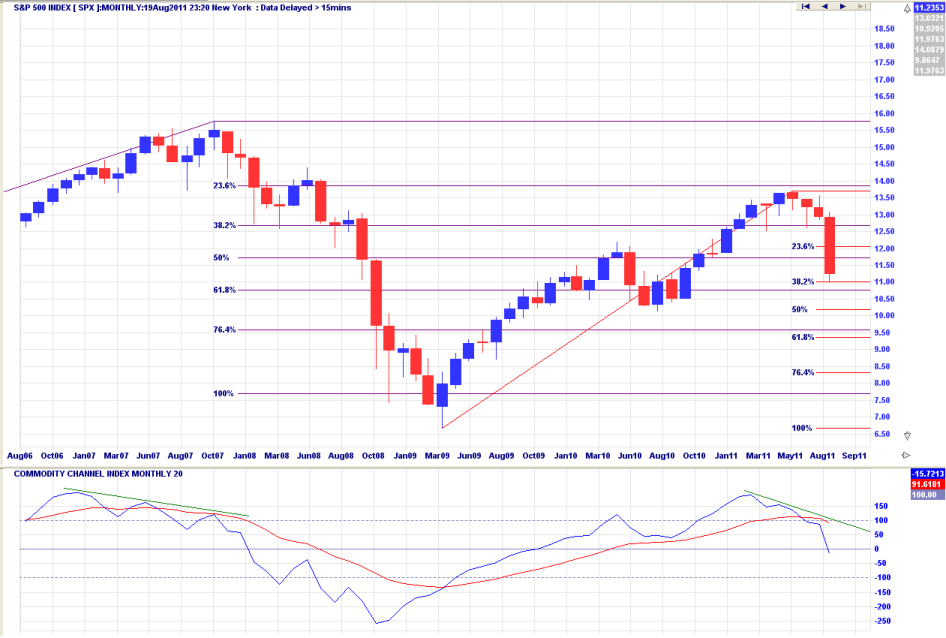
We've also discussed over the past couple of weekends, the general tendency for the first leg of a Bear to bounce around the 236 and 382 Fibonacci levels - and, so far at least, that seems to be the pattern in play.
What is "normal" in ABC corrections, regardless of the timeframe, is that Wave C tends to bear a "size" relationship to Wave A. The chart above shows what is likely to happen if I'm right about the big picture.
If Wave A and Wave C are a similar size ... and IF the crash leg follows the normal angle of descent (the red diagonals) ... then this Bear leg now probably underway will run to a Price of $461 on the SP 500 by July, 2013.
I have marked two red bars on this chart with a "?", indicating what I suspect will be a broadly repeating pattern. Now, as I've indicated, I think this Bear leg is due to terminate in October/November of 2012 - not July/August of 2013.
We've also discussed over the past couple of weekends, the general tendency for the first leg of a Bear to bounce around the 236 and 382 Fibonacci levels - and, so far at least, that seems to be the pattern in play.
So far, I'm not seeing anything we didn't expect - long before the news and rumours about banks and economic downturns started affecting Prices.
Those of you who've been with me for the past few weeks know we were anticipating the final end of the Bullish recovery run and the reappearance of a Bearish phase - and we took our cues from the charts, not from the "experts".
And you also know I've been talking about the "probable" pattern - a Low, a 2nd degree countertrend rally, a retest of the Low ... to be followed by a longer rally, probably running out to some cyclical length.
We are starting to see signs that is what is probably developing.
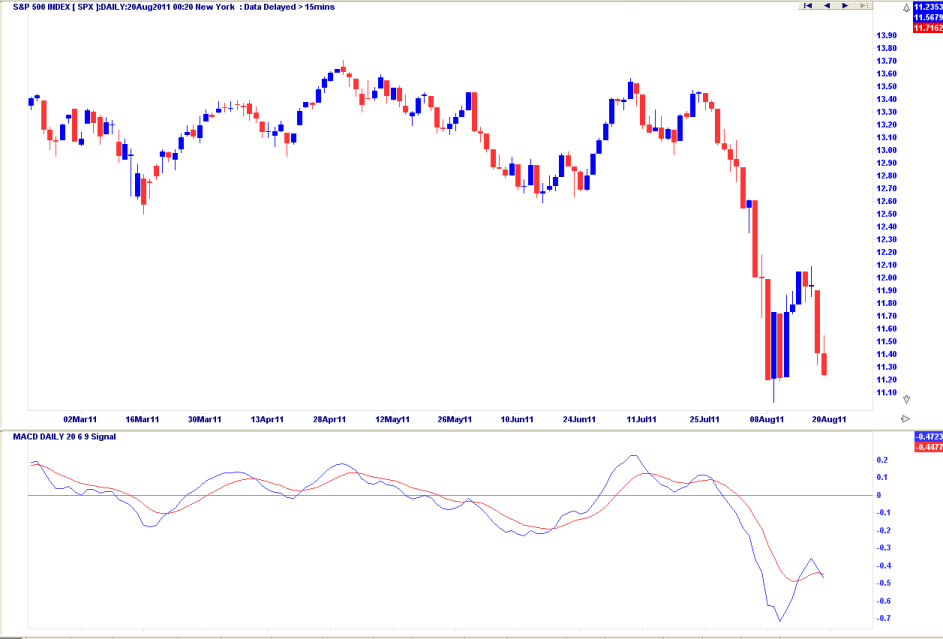
Turning our attention to the daily chart, we can see what The Idiot & The Moon teaches we NEED to see when looking for a "real" turnaround - divergence between the oscillators and the price.
The fast MACD looks as if it is going to put in a higher trough, even if Price declines below the August 9 spike Low. So far, it is only potential - but it is an early indication that what we expected is what is most likely to play out.
I'm not sure there's much point in going back-and-forth over all this in mind-numbing detail.
Overall, I think it is most likely that we are back in the grip of a Bear market. I've outlined exactly why I think that in the "big picture view" - and exactly where I think we are within the new Bear phase in the first two charts in this weekend's report.
If this Bear follows the old script which has played out so many times before, in so many markets, over so many decades, then we are now fast approaching both the Time and Price for a cyclical turn higher.
If we get some hard evidence for supporting that view over the coming week, I'll take a look at how far it's likely to go and how long it's likely to run.
In the meantime ...