
Price targets for the correction
Week beginning August 19, 2013
The correction I've been warning about finally started to bite deeply last week ... at least on Wall Street.

Copyright: Randall Ashbourne - 2011-2013
The coming week brings an exact hit of Jupiter square Uranus, an aspect which packs enough punch to either turn the markets ... or accelerate the downswing. We'll take a look at the relevant price levels as we go deeper into the charts.
The Sun is nearing the end of its journey through Leo and will enter Virgo. Leo is a "good mood" sign. It likes a show and has rulership over gambling. Virgo is much more picky and critical. Pull the wool over Leo's eyes and all it sees is the fabled golden fleece.
Try pulling the wool over Virgo's eyes and you'll get a sharp slap in the face, along with a nagging lecture about how dirty and unhygenic it is to be playing with that daggy, disgusting piece of animal skin.
And Venus will soon add her weight to the long-running Uranus/Pluto square.
I indicated last weekend it was becoming difficult to generalise about stock indices because not all markets were moving in the same direction.
The variations continued throughout last week. However, the main show remains Wall Street and that's what we'll be concentrating on this weekend.
The variations continued throughout last week. However, the main show remains Wall Street and that's what we'll be concentrating on this weekend.


Safe trading - RA
(Disclaimer: This article is not advice or a recommendation to trade stocks; it is merely educational material.)
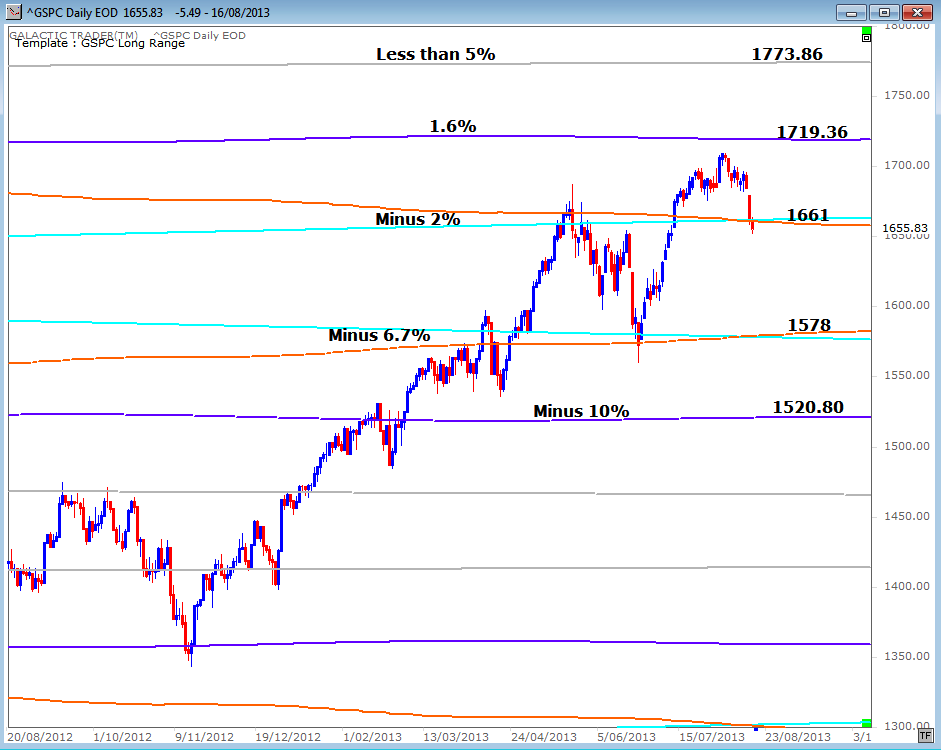
We'll begin this weekend with an update of a chart I used in the July 29 edition - Imminent danger of another fast drop. I indicated then that I thought there was very little upside left in the rally and the potential for some rather severe downside.
At the time I thought the maximum likely reach for the rally was only 1.6% higher at the 1719 Pluto barrier. Pollyanna, the SP500, couldn't quite get there ... and finished last week below the first downside target I marked in the July 29 edition.
At the time I thought the maximum likely reach for the rally was only 1.6% higher at the 1719 Pluto barrier. Pollyanna, the SP500, couldn't quite get there ... and finished last week below the first downside target I marked in the July 29 edition.
Forecast 2013 is now available for sale and download.
Click the button on the right for more details.
Click the button on the right for more details.


Forecast 2013 is now available for sale and download.
And since half the year is gone ... it's now half price!
And since half the year is gone ... it's now half price!
For the moment, we cannot be certain whether this correction is going to eat Price or Time. In other words, it could go on for weeks, but not lose a lot of value ... or it could be a fast, deep plunge.
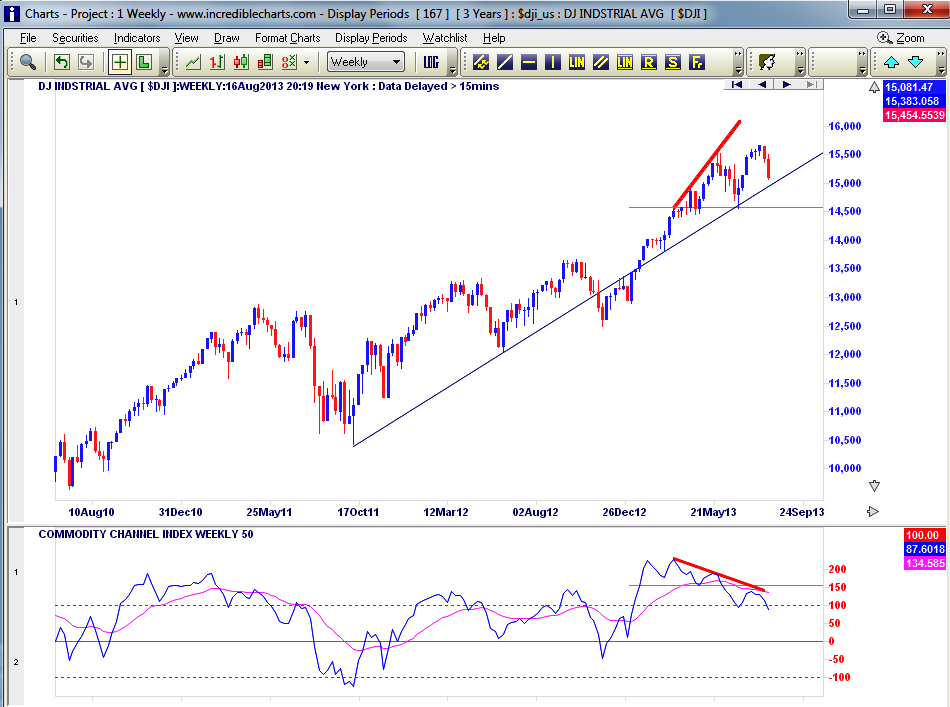
The state of the Dow Jones Industrials tends to favour the second scenario. Below is the DJI Weekly. The negative divergence between the higher Price peaks and the lower Big Bird peaks became very strident.
And there is no sign yet that it's lessening. Notice how the oscillator has now gone below the trough it recorded at the price low in late June? It's a preliminary warning the chances are high that Price, too, will plunge lower than it did in June.
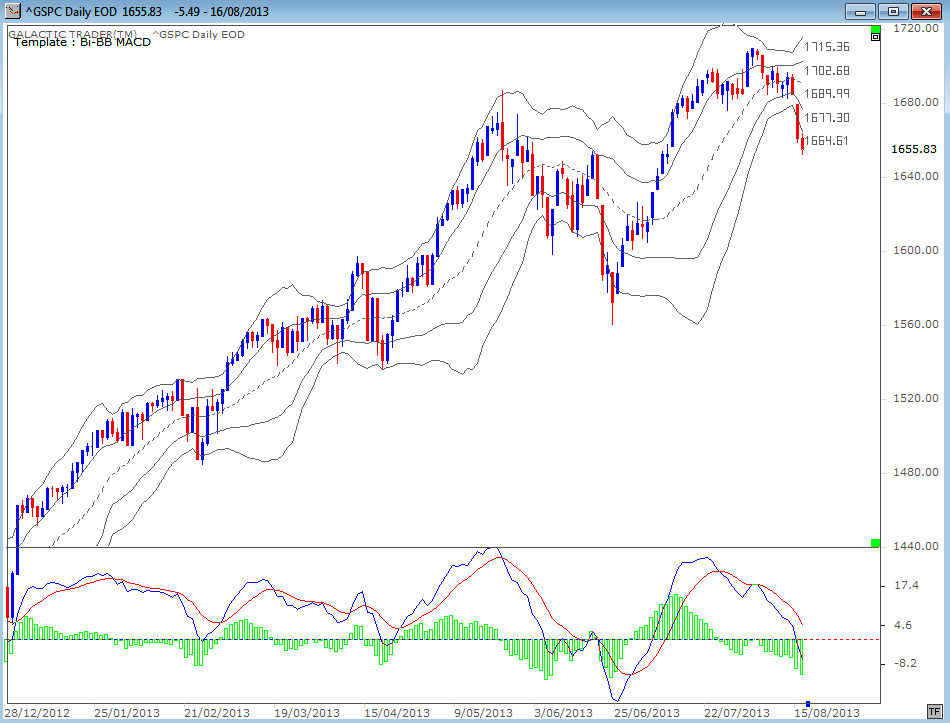
And the daily Bi-BB is below. It suggests a bounceback, or at least a sideways consolidation, is very nearby. The reason why that is so is outlined in The Technical Section of The Idiot & The Moon; a break of the outer bands almost always stalls the move, regardless of whether it's a topside or downside break. The stall need only be temporary.
Now let's look at what could turn it - or accelerate the downswing. The main astrological show this week is Jupiter squaring Uranus. I've been through this a few times in recent weeks and you might want to visit the Archives for a refresher.
The chart below deals only with the current Jupiter/Uranus/Pluto price levels in terms of the "price crossings" currently in range. To be assured of a strong bounce, we would need to see Pollyanna's price hit 1631-1632 fairly exactly on Wednesday/Thursday of this week ... and close higher than that price!
The chart below deals only with the current Jupiter/Uranus/Pluto price levels in terms of the "price crossings" currently in range. To be assured of a strong bounce, we would need to see Pollyanna's price hit 1631-1632 fairly exactly on Wednesday/Thursday of this week ... and close higher than that price!
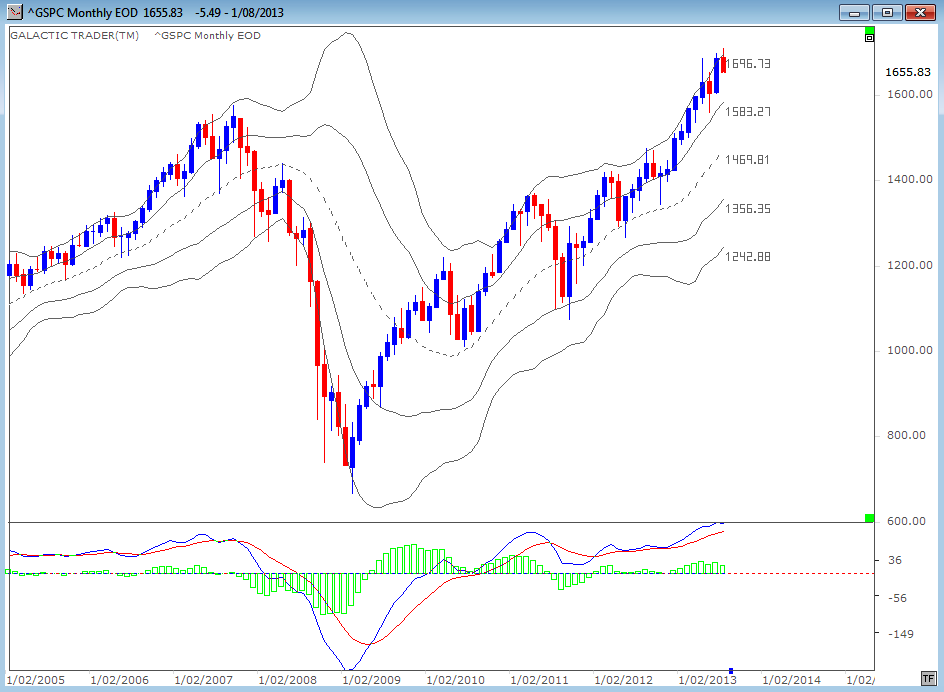
So, let's take a three-timeframe look at the 500 to try to get some sense of just how low this might go. We'll use the same mechanism across the monthly, weekly and daily trimeframes - the Bi-BB charts with a fast MACD.
For 9 months Pollyanna has been pushing the outer limits of the upside Bollinger Band, with only partial support from the MACD signal lines and at least some disagreement from the peaks in the MACD histogram.
Three previous corrections have declined all the way to the middle of the BBs. That seems a layer too far this time around. But the middle band of the upper tier, currently at 1583, is also close to the 1578 level listed as a target on the first chart.
The weekly Bi-BB chart is next. The top band has started to roll over, underpinning the potential for a significant correction. All corrections since this upleg began in 2011 have broken down through the middle of the bands, which tends to suggest a drop to at least 1590; pretty much in the same league as the 1583/1578 targets from the earlier charts.
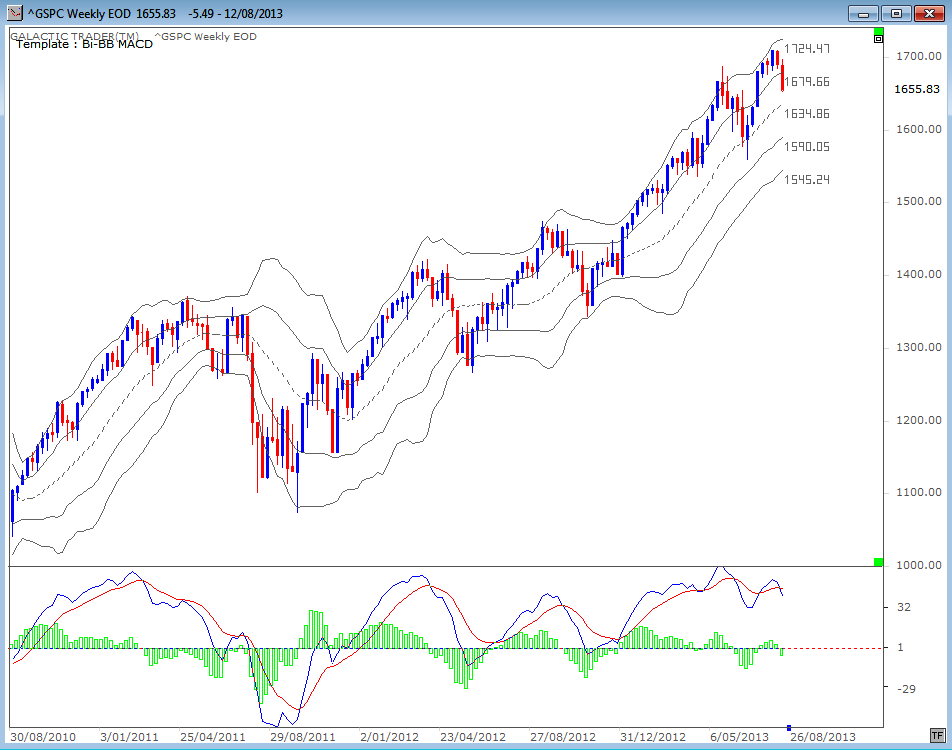
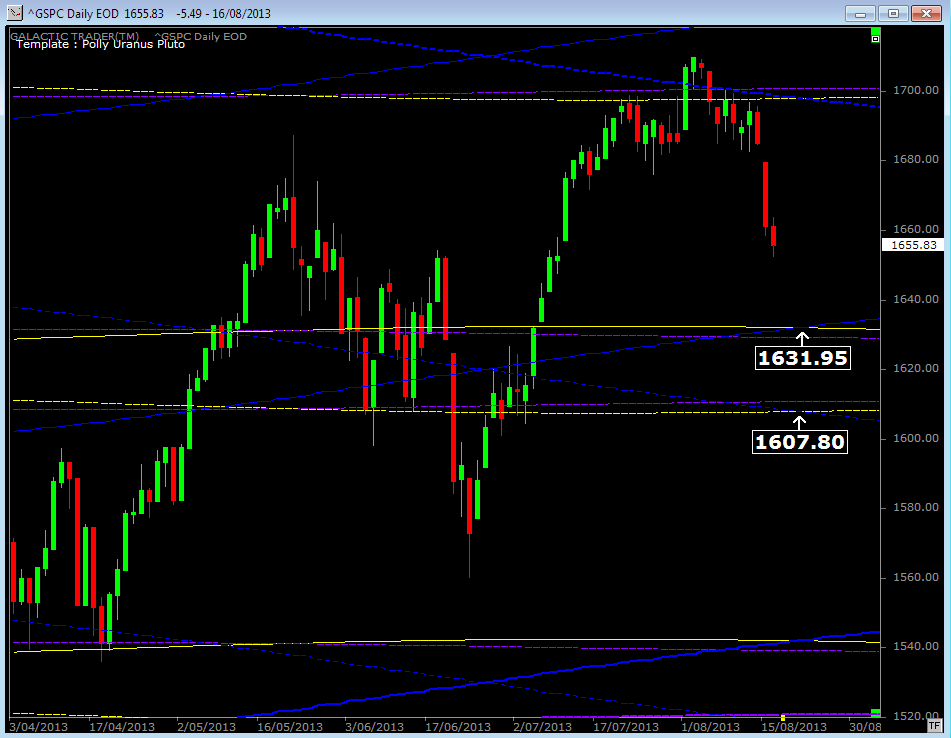
If the price closes below 1607.80 at that time, the downtrend is likely to plunge even deeper.
That's all for this weekend, folks. The Weekly Planets and long-range charts for various indices I've published recently contain valid price targets for other indices and you can check the Archives for those.
For the moment, the primary action is on Wall Street and what happens there is likely to have considerable impact on virtually all other markets.